A flowchart shows the steps in a process in order, along with the questions that send the work one way or another. A good one lets someone who has never done the job trace it from start to finish. A bad one grows until nobody can find the main route, and people go back to asking the one colleague who knows.
This guide walks through making a flowchart that stays readable: fix where it starts and ends, draw the usual route, add decisions and exceptions, then test it with the people who do the work. The editable starter gives you the same structure for your own process.
The four shapes you need
The Institute for Healthcare Improvement's flowchart guide describes the basics plainly: each step goes in a box, each decision goes in a diamond and is written as a yes or no question, and lines show how they connect. Add a shape for the start and end points and you have nearly everything an everyday chart uses.
| Shape | What it means | What to write in it |
|---|---|---|
| Oval | A start or an end | What sets the process off, or what is true when it stops |
| Box | A step | Who does what |
| Diamond | A decision | A yes or no question |
| Small circle | A connector | A matching letter where the chart continues somewhere else |
The 1970 American flowchart standard is old but still useful for its conventions. It treats a terminal symbol as a point such as start or stop, and sets the normal direction of flow as left to right and top to bottom. Readers expect that direction, so save arrows running the other way for steps that really do go backwards.
If you need to show how ideas relate and there is no order of steps, make a concept map with labelled links instead.
Set the start and end
To keep the steps concrete, this guide follows returns at a fictional online homeware shop. You're the operations lead, and you want new support staff to handle a return without asking around. The customer wants something simpler: to send an item back and get their money.
Begin with the two ends of the chart. The IHI guide starts by defining the first and last step, so everyone agrees where the process begins and stops. NHS England's process mapping guidance asks you to agree the level of detail at the same point, and suggests starting at a very high level and adding detail only where you need it.
In the example, the start is "Customer asks to return an item". The first attempt at an end was "Return complete", which meant different things to different teams. The warehouse meant the parcel was on the shelf, finance meant the money had gone, and the customer would want to know the refund had been paid.
So the end became "Refund paid, customer told". An end label should say what is true at that point, so a reader knows they've finished. This one also moved the customer's email inside the process, where finance now owns it.
If you are mapping work that already happens and want to find where it slows down, make a process map of the work as it really happens with the people who do each step.
Map the main route first
With both ends fixed, draw the route a typical return takes. Leave out the awkward cases for now. NHS England's advice is to concentrate on what happens most of the time, and the reason is practical: exceptions pull a chart apart before anyone can see its shape.
For the shop, the usual return has four steps. Support checks the order, support sends return instructions, the warehouse inspects the item and finance pays the refund. Open the editable starter near the top of this page to do the same for your process. It adds a fresh page and leaves your existing drawings alone. Double-click a label to replace it.
Name who does each step. "Check the order" leaves a reader guessing, while "Support finds the order, the delivery date and the reason" tells them who to look for and what they need afterwards.
Keep this route in a straight line, even when the chart needs more than one row, so a reader can follow the usual case with one finger.
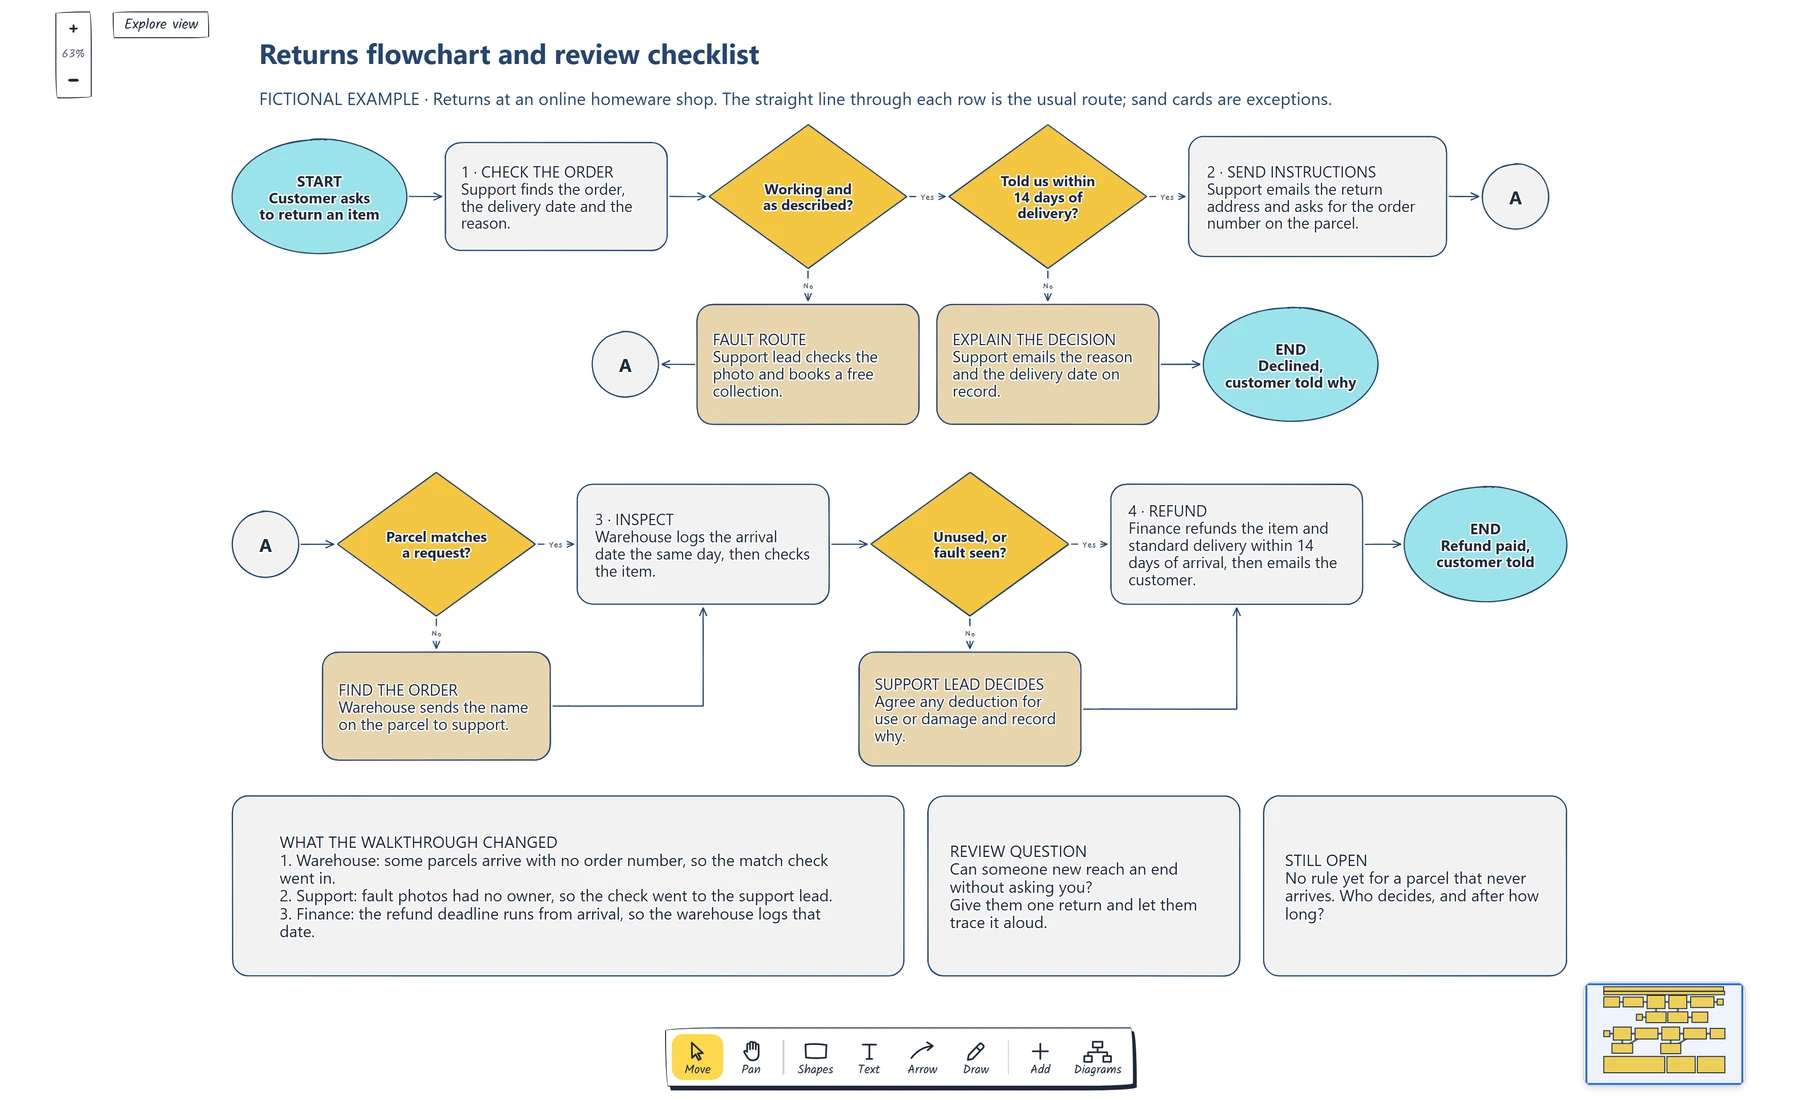
Follow the straight line through each row, then check that every No leads to a step with a name on it. The circles marked A join the rows.
Add decisions and exceptions
Now ask where the usual route could go differently. Each answer becomes a diamond on the line, written as a question someone could answer without judgement. "Told us within 14 days of delivery?" works. "Eligible?" sends the reader off to find out what eligible means.
Word each question so that Yes continues along the main route and No drops to an exception. Readers then learn one rule for the whole chart. It suits the editor too: select a diamond and it offers + Yes on the right and + No below, with an arrow already attached. If you need to ask "Is it faulty?", turn it round, as the example does with "Working and as described?".
The 1970 standard says each exit from a symbol should be identified, so label every arrow leaving a diamond. An unlabelled exit leaves the reader guessing which way their answer goes.
Three of the shop's four decisions come from its returns policy. GOV.UK's guidance for UK sellers gives customers 14 days from receiving an item to say they want to cancel an online order, then a further 14 days to send it back. Sellers must refund within 14 days of getting the item back, including standard delivery, and can only deduct money if the item has been used or damaged. Faulty items have separate rights, and some products, such as personalised items, are treated differently. Check the rules for your own country and products before you copy this logic.
Each rule gives the chart a question and a route. A fault goes to the support lead, who books a free collection. A late request goes to a card that explains the decision, and that route has its own end: "Declined, customer told why". An item that comes back used goes to the support lead, who agrees any deduction and records why, then rejoins the route at the refund. This fictional shop always refunds rather than replaces, which keeps the example short.
Every exception needs somewhere to finish. It either rejoins the main route or reaches a named end. If you can't say which, you've found a gap in the process.
The chart also ran out of width after step 2. A long line back across the page would have crossed the exceptions, so the example uses connectors instead. The standard describes this use: matching connectors carry the flow on when the chart runs out of space. Every circle carries the letter A, and the fault route joins at the same point. If your process needs a loop as well as branches, the inventory management flowchart template shows a daily check with an approval route that you can adapt.
For a process where the evidence can run out partway through, how to map a bug triage process shows how to give that case its own branch and review date.
Walk through it with someone who does the work
A chart drawn at a desk shows what you believe happens. The IHI guide asks for the people who know the process best and says to show it as it actually works, not as it should. NHS England explains why this matters: people carry their own mental map of a process, and it often differs from a colleague's.
Take one recent return and trace it aloud with someone from each team on the chart. Mark the places where they stop or disagree.
In the example, the walkthrough changed three things. The warehouse said some parcels arrive with no order number, so a new decision checks that a parcel matches a request. Support said nobody owned the review of fault photos, so that step went to the support lead. Finance pointed out that the refund deadline runs from the day the parcel arrives, so the warehouse now logs that date.
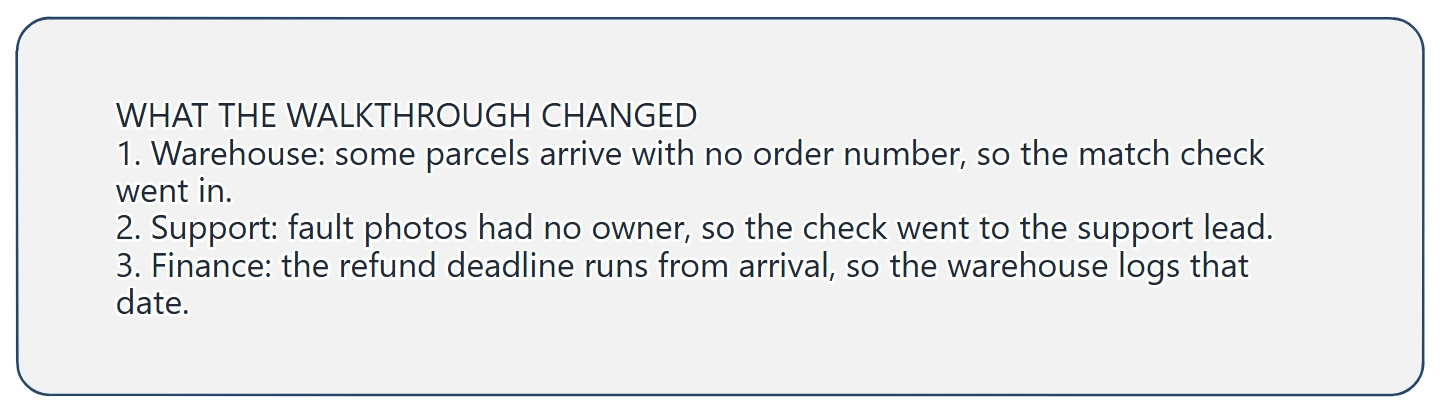
Each change names who raised it and what moved on the chart, so a reader can see why the step exists.
The walkthrough also raised something it couldn't settle: nobody knew what to do about a parcel that never arrives. Drawing a branch would mean inventing a policy, so the question sits on the chart until someone decides. NHS England suggests a similar habit for meetings, with a "car park" list for issues the room can't resolve quickly.
Then run the real test. Give the chart to someone new, hand them a return and ask them to reach an end without your help. Wherever they stop, change the wording or add the missing step. The IHI guide also says to keep the chart up to date, so name who owns it and note when you'll check it again.
If your process is a person moving through a product, compare a user flow, a wireframe and a wireflow to choose what to review next.
If nobody can say who owns a step because the reporting lines are unclear, create an org chart that shows reporting lines first, then come back to the flowchart.
Review checklist
Copy this worksheet to check your flowchart before you share it:
Process name:
Start, and what sets it off:
End, and what is true when it stops:
Usual route, in order:
Who does each step:
Decisions, as yes or no questions:
Where each No goes:
Other ends:
Walked through with:
Changes from the walkthrough:
Open questions and who decides:
Chart owner and next check date:
Before sharing, trace every arrow from the start. Each one should reach an end, and each arrow leaving a diamond should carry an answer.
Optional: create the example with an AI assistant
If you use an AI assistant that supports remote MCP with OAuth sign-in, you can ask it to build this flowchart in your EpicDraw workspace. MCP is the connection that lets the assistant use EpicDraw's diagram tools.
This route needs a free EpicDraw account and cloud sync. Open More, choose Connect AI assistant and add https://epicdraw.app/mcp in your assistant. When EpicDraw asks you to approve the connection, allow it to create and edit diagrams. The MCP connection guide walks through each step.
Paste this prompt into the connected assistant:
Using the connected EpicDraw MCP server, create a new editable page named "Returns flowchart and review checklist". Leave existing pages unchanged.

Map returns handling at a fictional online homeware shop as a flowchart. Start with "Customer asks to return an item". Show the usual route through checking the order, sending return instructions, inspecting the item and paying the refund, ending at "Refund paid, customer told". Add yes or no decisions for whether the item works as described, the 14-day window, whether the parcel matches a request and whether the item is unused or has a fault. Keep Yes on the usual route and give each No its own step. Add a second end for a declined return, and use connectors marked A where the chart continues on a new row. Add a card listing what a walkthrough changed, the review question "Can someone new reach an end without asking you?" and an open question about a parcel that never arrives.

Use editable shapes, text and connectors. Label the example as fictional and mark unknowns as open questions. This is a visual planning draft. Check for overlapping objects and overflowing labels, then return a PNG preview and the private editor link. Leave the result as a draft for me to review.
Open the returned private editor link while signed in. The assistant's layout may differ from the screenshot, so check the decisions, end labels and open question before adapting it. The result is a planning diagram, and your real returns policy still needs checking against the rules that apply to you.
Takeaways
- Fix the start and the end first, and write each end as what is true when the process stops.
- Draw the usual route as a straight line and name who does each step.
- Write decisions as yes or no questions, keep Yes on the main route and label every exit.
- Send every exception back to the route or to a named end.
- Trace a real case with the people who do the work, and leave unsettled questions visible on the chart.
Keep your next draft close
Create a free account to save your pages in the cloud and use them across devices.
Create a free accountYou can keep drawing without an account.