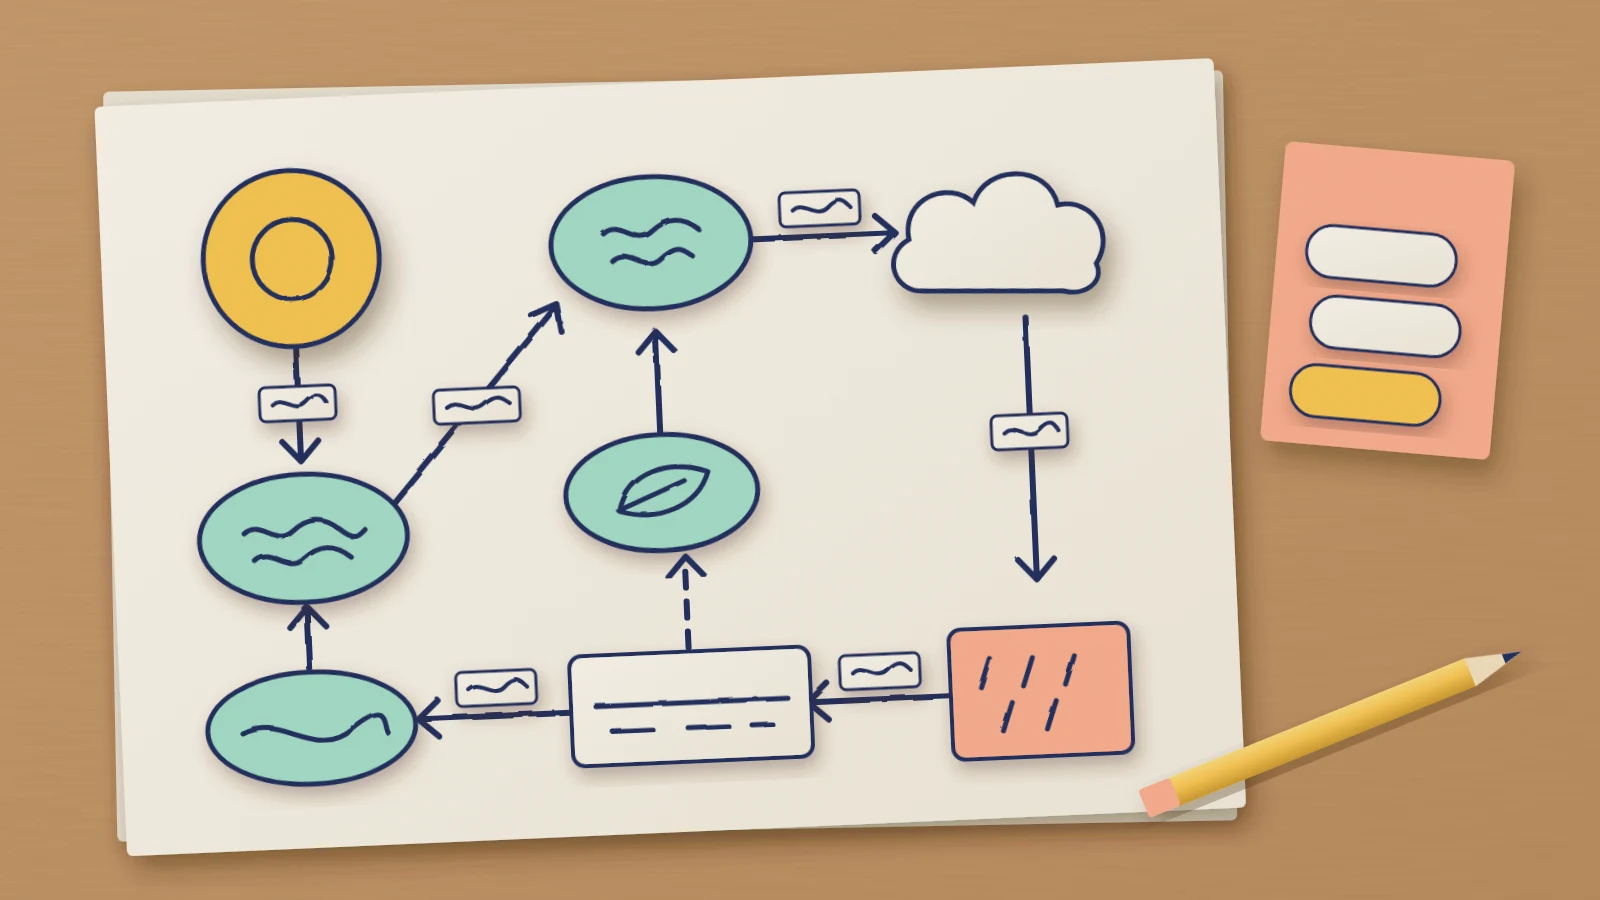
A concept map shows how ideas in a topic connect. Each idea sits in a shape, and every line between two ideas carries a few words that say how they're related. Read along any line and you get a statement you can check. That makes it useful for revision and for teaching: a student finds out which links they can explain, and a teacher sees which ones they can't.
Most first attempts stall in the same place. The page fills with good words joined by bare lines, and the map stops saying anything. This guide covers the steps that prevent that: write a focus question, list and rank the concepts, label every link, add a cross-link and read the whole map back as sentences. The editable starter gives you the same structure for your own topic.
What a concept map is made of
Joseph Novak developed concept maps in 1972 during his research at Cornell. Novak and Cañas's report on how to construct concept maps, published by the Institute for Human and Machine Cognition, sets out the parts:
| Part | What it is | Example from this guide |
|---|---|---|
| Concept | A named idea, usually a word or two, in a circle or box | Water vapour |
| Linking phrase | Words on the line that say how two concepts relate | evaporates into |
| Proposition | Two concepts and their link, read as a statement | Sea water evaporates into water vapour |
| Cross-link | A link between different parts of the map | Soil water is taken up by plants |
The report calls propositions units of meaning. A concept on its own shows only that the student knows the word; the proposition shows whether they know how it relates to the rest of the topic.
Start with a focus question
To keep things concrete, this guide follows a fictional Year 8 science class revising the water cycle before an end-of-unit test. You're the teacher, and you want to see which parts of the cycle each student can explain. Each student has a simpler goal: to explain how water gets around the cycle when a test question asks for it.
The first instruction on the board was "Make a concept map about the water cycle." Novak and Cañas advise against this. They say every concept map answers a focus question, and that students should be given a question rather than a topic, because answering it keeps the map on track. They also note that learners tend to drift from the question and build a map that's about the subject without answering anything.
The type of question matters too. The report says "What are plants?" leads to a more classificatory map than "Why do we need plants?". By the same logic, "What is the water cycle?" would invite a list of stages. The class got this instead:
How does water move from the sea to the land and back again?
That question asks for movement, so every link on the map has to describe something happening to water. It also gives the student a test for each idea: does it help answer the question?
List the concepts in a parking lot
Before drawing anything, the student lists the concepts the question needs. Novak and Cañas suggest that 15 to 25 concepts usually suffice, ranked from the most general to the most specific. They call the list a parking lot, because concepts wait there until they find a place on the map, and some never do.
The fictional student listed twelve: sun, sea, water vapour, clouds, rain, rivers, soil, plants, ice, lakes, weather and puddles. That's below the report's range, which suits a map revised in one lesson.
Two edits came next. "Sea" became "Sea water" and "Soil" became "Soil water", because the map is about what happens to water, and the label should name the thing that moves. "Rain" became "Precipitation", since the Met Office's guide to the water cycle lists hail, rain, sleet and snow as what falls from clouds.
Keep each concept to a word or short phrase. The report warns against putting whole sentences in the boxes, since a sentence usually hides several concepts that belong on the map separately.
If you only need to group a list like this around one question, create a mind map and give each branch a next step.
Link the concepts with verbs
Now place the concepts and draw the links. Put a linking phrase on each line, and write it as a verb so the line describes something happening: heats, evaporates into, soaks into.
The Met Office guide supplied the processes. Water heated by the sun evaporates into water vapour. Plants release water vapour through their leaves by transpiration. Vapour condenses as air rises and cools, often forming clouds, and droplets in clouds merge until they fall. On the ground, water may flow into rivers or soak into the soil, where it moves towards a river slowly.
Each sentence became one or two links. The student checked every arrow's direction against the sentence it came from, because "Plants transpire to release water vapour" only reads correctly one way round. The layout follows the cycle, so a reader can trace water from the sea, up into the air and back down to rivers.
You can open the editable starter near the top of this page to do the same for your own topic. It adds a fresh page and leaves your existing drawings alone. Double-click a concept to rename it, or an arrow to change its linking phrase.
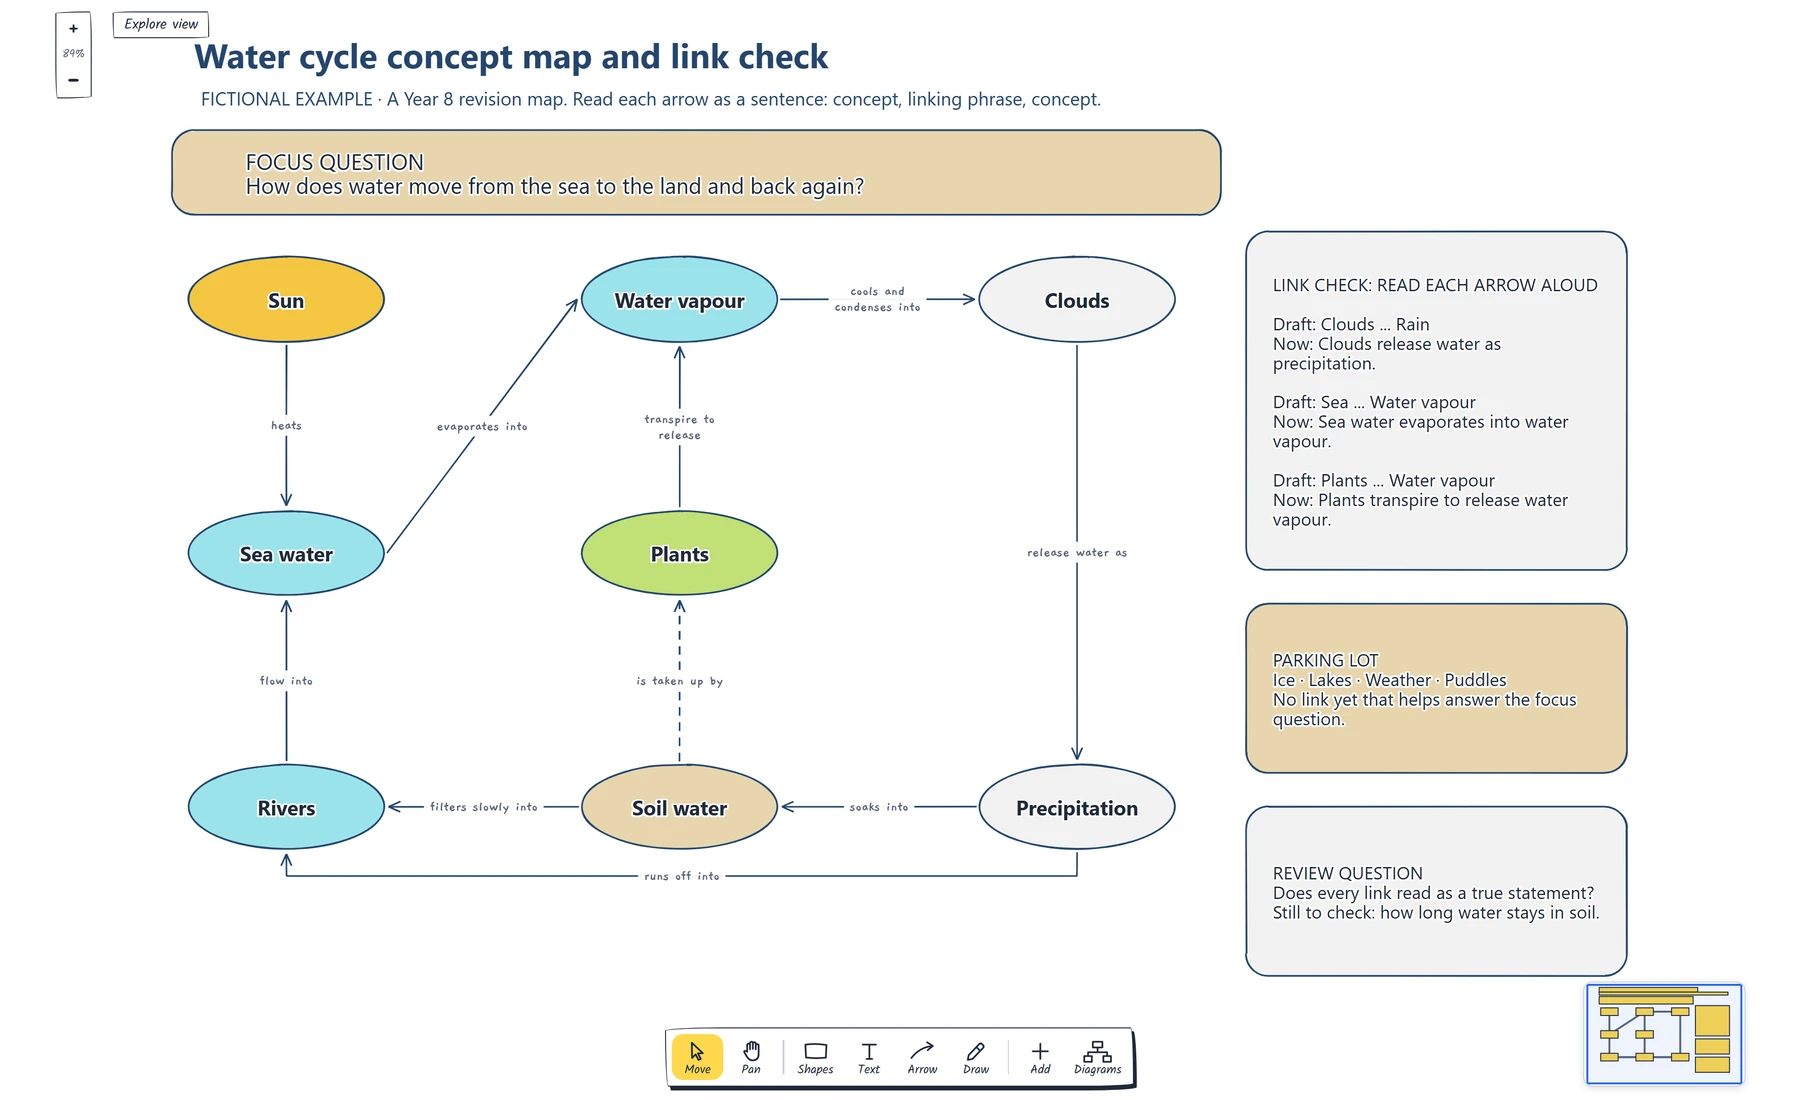
Read any arrow from the oval it starts at to the oval it points to. Each one should make a sentence that answers part of the focus question.
Four concepts stayed in the parking lot: ice, lakes, weather and puddles. The student could have linked ice, since the Met Office guide describes ice turning straight into water vapour by sublimation. But nothing else on this map leads to ice, so it waits until the student can say where the ice comes from. Leftover concepts are useful to you as the teacher: Novak and Cañas note that when students are given a list, the ones they can't place show which concepts they had trouble fitting in.
If your topic turns out to be a sequence of steps and decisions, make a flowchart people can actually follow so the order is clear.
Look for a cross-link
With the main cycle in place, look for links between parts of the map that seem separate. Novak and Cañas describe cross-links as links between different segments of the map, and say they show that the learner understands how those parts relate. They also advise being selective, because nearly every concept can be joined to every other.
The student's map has a ground route through soil water and rivers and an air route through plants and water vapour. One link joins them: soil water is taken up by plants, which the Met Office guide describes as water soaking into the roots of a plant. That cross-link explains how water in the ground can return to the air without passing through a river or the sea. The example draws it as a dashed line so it stands apart from the main cycle.
If you can't defend a cross-link in a sentence, leave it out.
Check that each link reads as a sentence
Now read the map aloud, one arrow at a time: concept, linking phrase, concept. Two things can go wrong. The sentence might not make sense, or it might make sense and be false.
The student's first draft had three bare lines: "Clouds" to "Rain", "Sea" to "Water vapour" and "Plants" to "Water vapour". Each looked right, and none said anything. Novak and Cañas say students often find linking words hard to write, because writing one forces them to state a relationship they may not understand. So a link that's hard to label shows the student exactly where to revise.
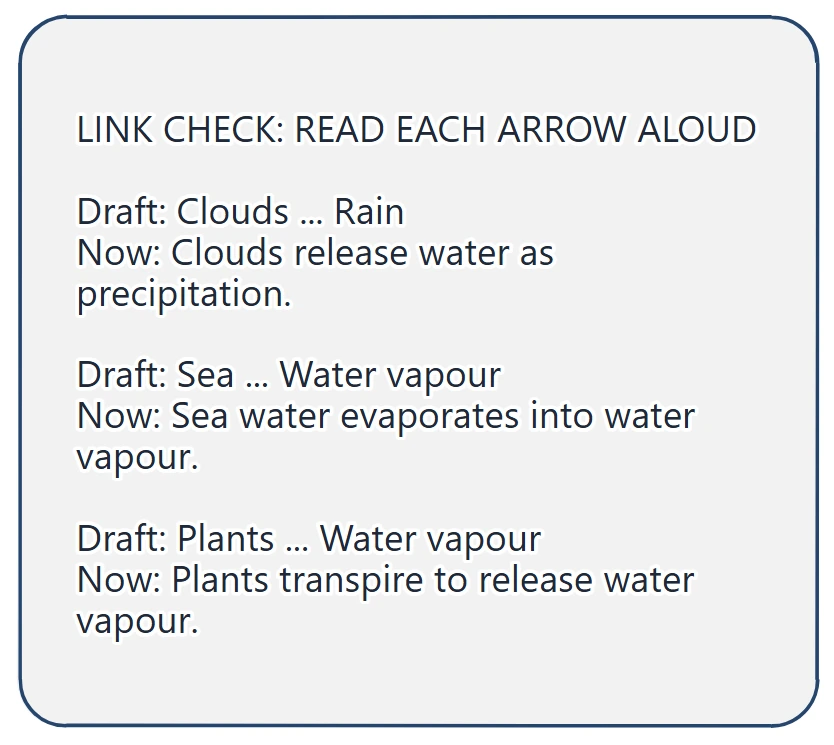
Compare each draft with its rewrite. The rewrite names the process, which is the part a test question will ask about.
For the true-or-false check, compare each sentence with the class textbook or notes. The review card on the example holds one question the student couldn't settle: how long water stays in the soil. The Met Office guide says the movement is slow, and the student needs more than that before adding a figure, so the question stays on the card.
The report says a concept map is never finished and that good maps usually take several revisions. Ask the student to redraw after the unit too. The photosynthesis concept map template uses the same focus question and linking phrase structure, with a cross-link to respiration, if you'd like a second worked example for another topic.
Review checklist
Copy this worksheet to check a concept map before it's used for revision or marking:
Topic:
Focus question:
Concepts in the parking lot, most general first:
Concepts placed on the map:
Concepts left in the parking lot, and why:
Links without a linking phrase:
Links that read as a false statement:
Cross-links, and the sentence for each:
Source used to check the links:
Still to check:
Before you finish, read every arrow aloud. Each one should give a true statement that helps answer the focus question.
Optional: create the example with an AI assistant
If you use an AI assistant that supports remote MCP with OAuth sign-in, you can ask it to build this concept map in your EpicDraw workspace. MCP is the connection that lets the assistant use EpicDraw's diagram tools.
This route needs a free EpicDraw account and cloud sync. Open More, choose Connect AI assistant and add https://epicdraw.app/mcp in your assistant. When EpicDraw asks you to approve the connection, allow it to create and edit diagrams. The MCP connection guide walks through each step.
Paste this prompt into the connected assistant:
Using the connected EpicDraw MCP server, create a new editable page named "Water cycle concept map and link check". Leave existing pages unchanged.

Build a fictional Year 8 revision concept map that answers the focus question "How does water move from the sea to the land and back again?". Use eight concepts in ovals: Sun, Sea water, Water vapour, Clouds, Precipitation, Soil water, Rivers and Plants. Join them with arrows labelled with linking phrases so each arrow reads as a sentence, such as "Sea water evaporates into water vapour" and "Clouds release water as precipitation". Add a dashed cross-link showing that soil water is taken up by plants. Add a parking lot card for Ice, Lakes, Weather and Puddles, a link check card comparing three unlabelled draft links with their rewrites, and the review question "Does every link read as a true statement?" with one thing still to check.

Use editable shapes, text and connectors. Label the example as fictional and mark unknowns as open questions. This is a visual planning draft. Check for overlapping objects and overflowing labels, then return a PNG preview and the private editor link. Leave the result as a draft for me to review.
Open the returned private editor link while signed in. The assistant's layout may differ from the screenshot, so read every arrow as a sentence and check the science against your own notes before using the map with a class.
To write a prompt like this for your own topic, use the five parts of an AI diagram prompt, including the constraint that makes the assistant label anything you didn't supply.
Takeaways
- Give the map a focus question, not a topic, and use it to decide which concepts belong.
- Keep concepts short and park the ones you can't yet link.
- Write every linking phrase as a verb, and check each arrow's direction against the sentence it should make.
- Add a cross-link only when you can defend it in a sentence.
- Read the map aloud as sentences, check each one against a trusted source and keep unsettled questions visible.
Keep your next draft close
Create a free account to save your pages in the cloud and use them across devices.
Create a free accountYou can keep drawing without an account.