An org chart shows who reports to whom. A good one also answers the questions people actually bring to it: who leads this team, who do I ask about that, and where will the next hire sit. Most charts answer those questions on the day they're drawn and then drift, because nobody owns the changes.
This guide covers the decisions that keep a chart useful: what the chart is for, how to set the reporting lines, how to show open and shared roles, and who updates it when someone joins or leaves. The editable starter on this page has the same structure, ready for your own team.
What an org chart records
Underneath the boxes, an org chart is a list of posts, and each post reports to one other post. The UK government publishes its departments' organisation charts as data in this form. A quick guide to the organogram datasets, published on GOV.UK, describes the fields:
| Field in the dataset | What it records | What it means for your chart |
|---|---|---|
| Post unique reference | A code for each post, unique to the organisation | Chart posts, then put people in them |
| Reports to senior post | The reference of the post above; the top post reports to "XX" | Every box except the top one has exactly one solid line up |
| Name | The holder's name for the most senior pay bands; posts that no longer exist are listed as "Eliminated" | Names are a choice, and a removed post is recorded, not silently deleted |
| Senior reporting post (junior staff file) | Junior staff are counted in groups under the senior post they report to | You can show a team as one box with a headcount |
You don't need a dataset for a small company. The idea carries over, though: draw the structure as posts with one reporting line each, and the people, vacancies and changes have somewhere to go.
Decide what the chart is for
To keep this concrete, the guide follows Fernhill Software, a fictional software company with 25 people and one open role. You're the operations manager, and you've been asked for a chart. The people who'll read it have simpler goals. A new starter wants to know who leads each team and who to ask. The leadership team wants to see where the next hire will sit.
Write those readers down before drawing, because they decide what goes in each box. A new starter needs the names of the chief executive, the four heads and the two engineering leads. They don't need the name of every engineer on day one, and every name you add is a name you'll have to change when that person moves. So Fernhill's chart names the leaders and shows each team as a box with a headcount, much as the government data counts junior staff under their senior post.
A chart for a different reader would make different choices. A chart for payroll needs every person; a chart for a fundraising deck may need only the leadership team. The purpose goes at the top of the board, where anyone editing it can see it.
Set the reporting structure
Start with a two-column list before you draw a box: post, and the post it reports to. Fernhill's list begins like this:
Chief executive          reports to: (top)
CTO                      reports to: Chief executive
Head of Product          reports to: Chief executive
Head of Customer         reports to: Chief executive
Operations manager       reports to: Chief executive
Platform team (5)        reports to: CTO
Apps team (5)            reports to: CTO
The list catches problems the drawing hides. If a post has two entries in the second column, you have a shared role to decide on, which the next section covers. If a post has none, nobody manages it.
Now draw the chart from the list. Put the chief executive at the top and each level on its own row, so a reader can tell seniority from height alone. Label each box with the role first and the name second, because the role usually outlasts the person in it. Point the arrows up towards the manager and say so in a key: on this board a solid arrow means "reports to".
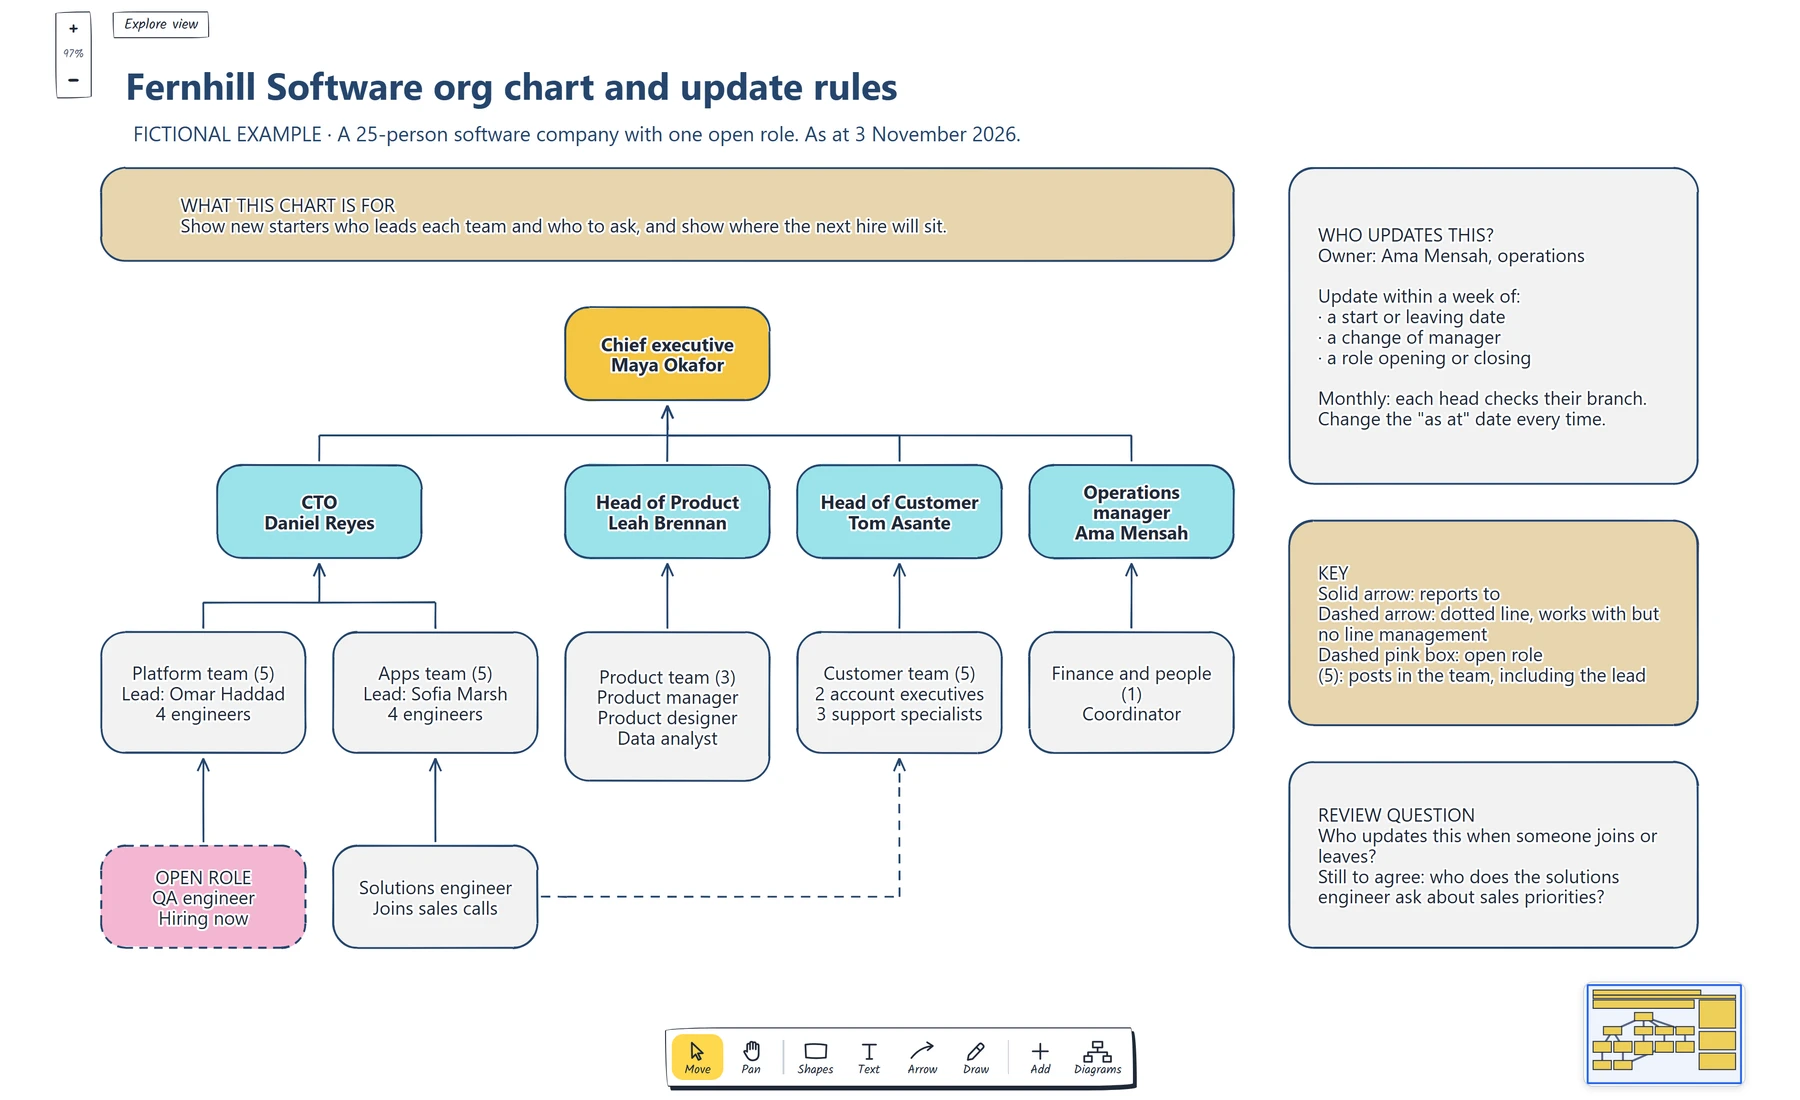
Follow any solid arrow up from a box: it should reach exactly one manager. Then check that the team counts add up to 25 people plus the open role.
The team boxes keep the chart readable at this size. The CTO has two teams of five, so the chart shows two boxes with their leads named, instead of ten small ones. If Fernhill grows, the startup org chart template draws a company at 8, 25 and 45 people, which helps you plan where new team leads will appear before the hiring starts.
Show vacancies and shared roles
Because the chart is built from posts, a vacancy is easy to draw: it's a post with no name. Fernhill is hiring a QA engineer for the Platform team, so the chart shows a box with "Open role" and a dashed pink outline, connected to the Platform team like any other post. The leadership team can see where the hire will sit, and a new starter can see the gap.
Leaving the vacancy off would make the chart look complete when it isn't. Showing it also gives you a clear update when the role is filled: replace "Open role" with the name and change the outline back.
Shared roles need a decision first. Fernhill's solutions engineer works in the Apps team and also joins sales calls. A chart with two solid lines from that box would tell a reader the engineer has two managers, which isn't the arrangement. So the solid arrow goes to the Apps team, where the line management sits, and a dashed arrow goes to the Customer team for the working relationship. This is often called a dotted line. The key on the board says what each kind of line means, because readers bring their own assumptions about dashed lines.
If you can't decide which line is solid, the chart has found a real question about who manages that person. Put it on the review card rather than drawing two solid lines.
Agree who updates it
A chart is only right on the day it was last checked, so put that date on it. Fernhill's strap line says "As at 3 November 2026". A reader who finds a mistake can tell whether the chart is stale or wrong.
If your chart names people, it holds personal data. The ICO's guidance on the accuracy principle says you should take reasonable steps to keep personal data from being incorrect or misleading, and that whether you need to keep it updated depends on what you use it for. It also explains that a record which is clearly historical can stay accurate after things change. An org chart used to find the right person needs to be current; one filed as a snapshot should say when it was taken.
Fernhill's answer is the card on the right of the board. The operations manager owns the chart. Three events trigger an update within a week: a start or leaving date, a change of manager, and a role opening or closing. Once a month, each head checks their own branch, since they'll notice a wrong reporting line before anyone else does.
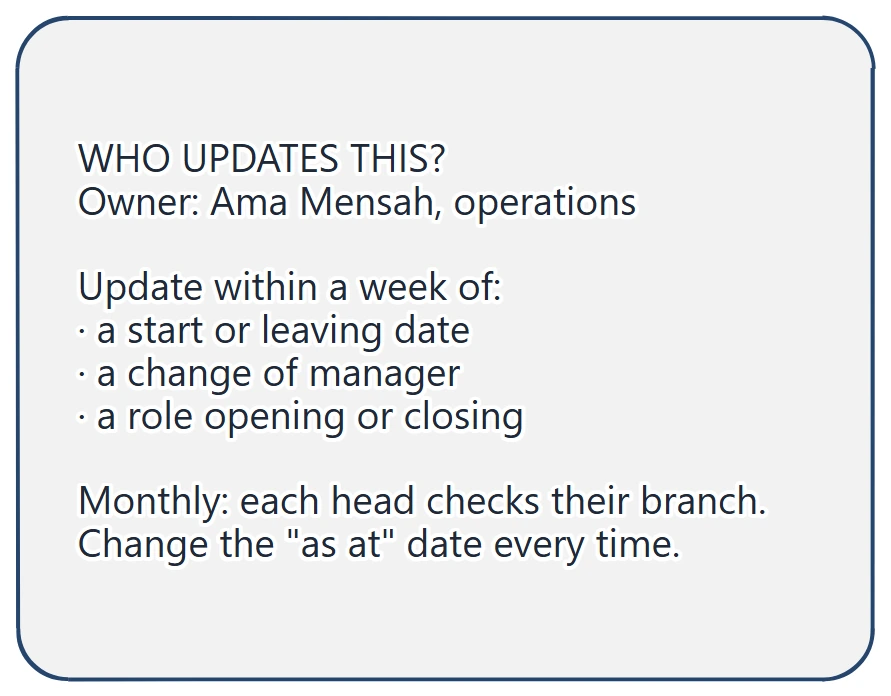
Check that the card names one person, not a team, and that each trigger is an event someone will notice on the day it happens.
The review card holds the question this guide started with: who updates this when someone joins or leaves? Fernhill has answered it. The card also keeps one thing still to agree: who the solutions engineer asks about sales priorities. That question belongs with the Head of Customer and the Apps lead, and the chart makes it visible.
You can open the editable starter near the top of this page to build your own. It adds a new page and leaves your existing drawings alone. Double-click a box to change its role and name, and drag a team box to move it with its arrows attached.
If the steps for a joiner or leaver aren't agreed yet, make a flowchart of the main route so each update trigger has a step and an owner.
Review checklist
Copy this worksheet before you share the chart:
Who reads this chart, and what do they need to find:
As at date:
Posts with no solid line up (should be only the top post):
Posts with more than one solid line up:
Open roles shown, and their status:
Dotted-line relationships, and what each one means:
Team counts, and the total they should add up to:
Owner who updates the chart:
Events that trigger an update:
Regular check, and who does it:
Questions still to agree:
Before sharing, follow every solid arrow up from a box and check it reaches exactly one manager.
Optional: create the example with an AI assistant
If you use an AI assistant that supports remote MCP with OAuth sign-in, you can ask it to build this org chart in your EpicDraw workspace. MCP is the connection that lets the assistant use EpicDraw's diagram tools.
This route needs a free EpicDraw account and cloud sync. Open More, choose Connect AI assistant and add https://epicdraw.app/mcp in your assistant. When EpicDraw asks you to approve the connection, allow it to create and edit diagrams. The MCP connection guide walks through each step.
Paste this prompt into the connected assistant:
Using the connected EpicDraw MCP server, create a new editable page named "Fernhill Software org chart and update rules". Leave existing pages unchanged.

Build a fictional org chart for a 25-person software company with one open role, dated "As at 3 November 2026". Add a purpose card: show new starters who leads each team and who to ask, and show where the next hire will sit. Put the Chief executive at the top, with four heads reporting to them: CTO, Head of Product, Head of Customer and Operations manager. Under the CTO add a Platform team (5) and an Apps team (5) with named leads; under the other heads add a Product team (3), a Customer team (5) and Finance and people (1). Use solid arrows pointing up to the manager. Add a dashed open role box for a QA engineer under the Platform team, and a Solutions engineer under the Apps team with a dashed dotted-line arrow to the Customer team. Add a card saying who updates the chart and which events trigger an update, a key for the line styles, and the review question "Who updates this when someone joins or leaves?" with one thing still to agree.

Use editable shapes, text and connectors. Label the example as fictional and mark unknowns as open questions. This is a visual planning draft. Check for overlapping objects and overflowing labels, then return a PNG preview and the private editor link. Leave the result as a draft for me to review.
Open the returned private editor link while signed in. The assistant's layout may differ from the screenshot, so follow each solid arrow up to check the reporting lines, and replace the fictional names and counts with your own before sharing the chart.
Takeaways
- Write down who reads the chart and what they need to find, then let that decide which names appear.
- Build the chart from posts, each with one solid line to the post it reports to.
- Show open roles as posts with no name, and draw shared roles with one solid line and one labelled dotted line.
- Put an "as at" date on the chart, name one owner and list the events that trigger an update.
- Keep unresolved reporting questions on the chart where the people who can settle them will see them.
Keep your next draft close
Create a free account to save your pages in the cloud and use them across devices.
Create a free accountYou can keep drawing without an account.