Healthcare
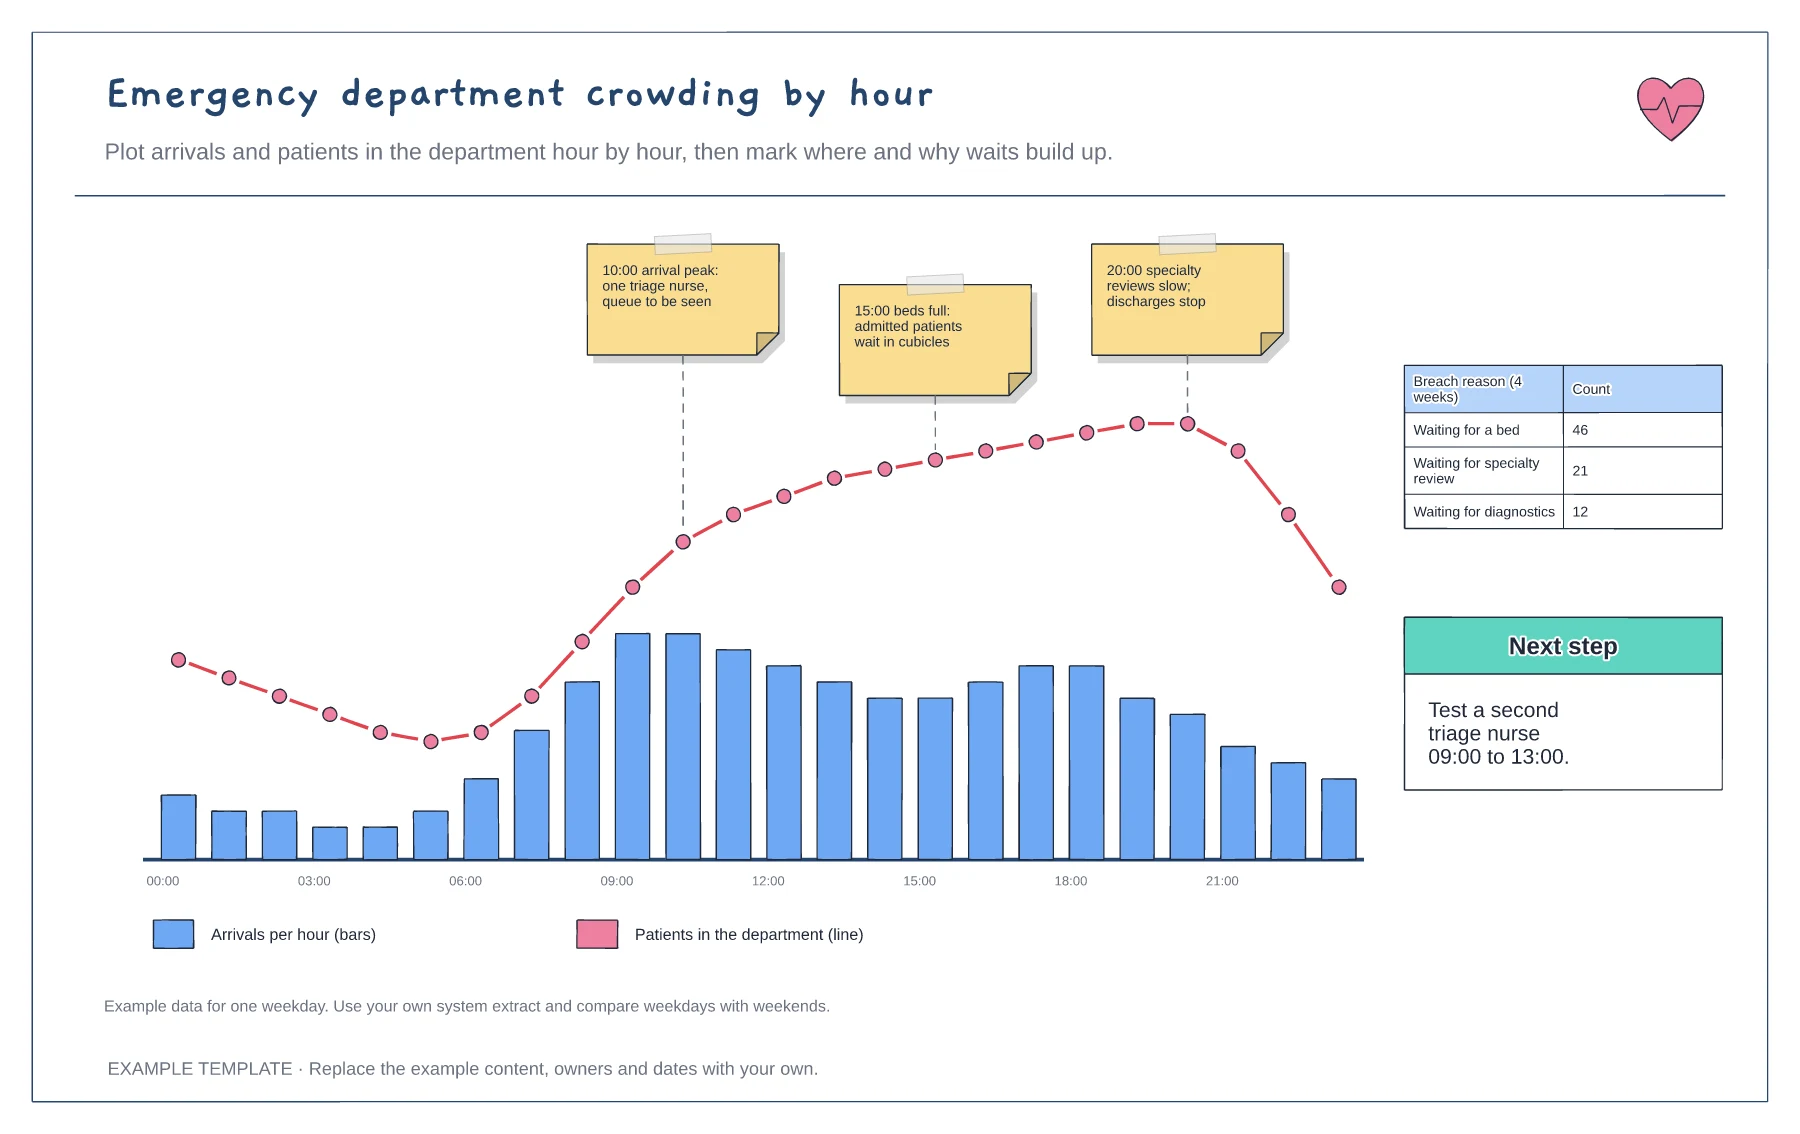
Emergency department crowding by hour template
Arrivals per hour and occupancy line · Annotated pressure points · Breach reason tally and next step
Preview and use template →A falls heat map shows where and when falls happen on a ward, so the team acts on patterns rather than single incidents. This example plots twelve falls from three months of incident reports on a schematic ward plan, charts them by time of day and lists the clusters the plan reveals, such as night-time falls near the toilets and falls in the side room furthest from the nurses' station.
This is a planning example for process improvement, not clinical guidance. Follow your organisation's policies and clinical protocols.
No account needed · Opens as your own editable page
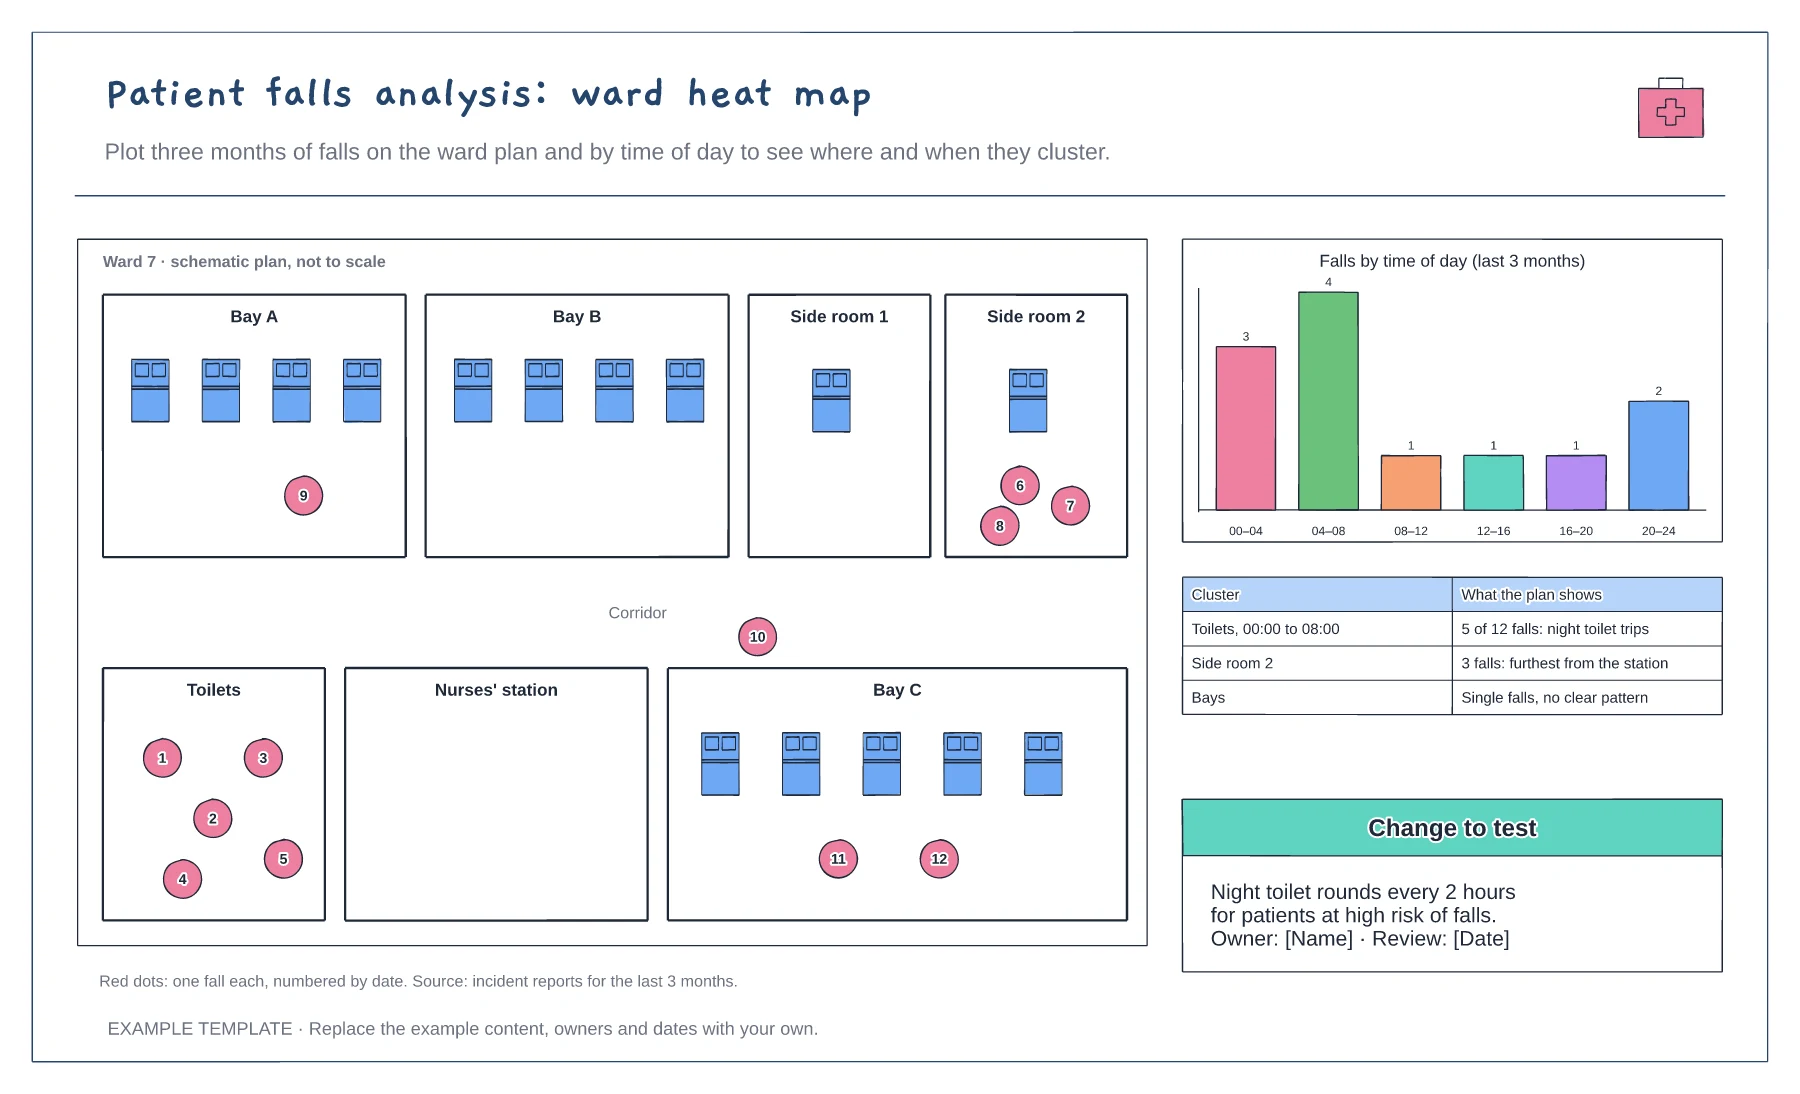
Replace the example layout with your own bays, side rooms, toilets and nurses' station. It does not need to be to scale, only recognisable.
Take each fall from your incident system for the last few months and add a numbered dot where it happened. Add the time to the chart.
Look for places and times where dots bunch up, discuss why with the whole team, and choose one change to test first.
Yes. Replace the ward plan with your own bays and side rooms, then drop a marker where each fall happened and update the time of day chart to match.
No. Open the template and edit it in your browser. Your work saves on this device. An account is optional if you want to sync your workspace.
Yes. Use Export in the editor to save a PNG, SVG or PDF, or download an editable .epicdraw backup.
Arrivals per hour and occupancy line · Annotated pressure points · Breach reason tally and next step
Preview and use template →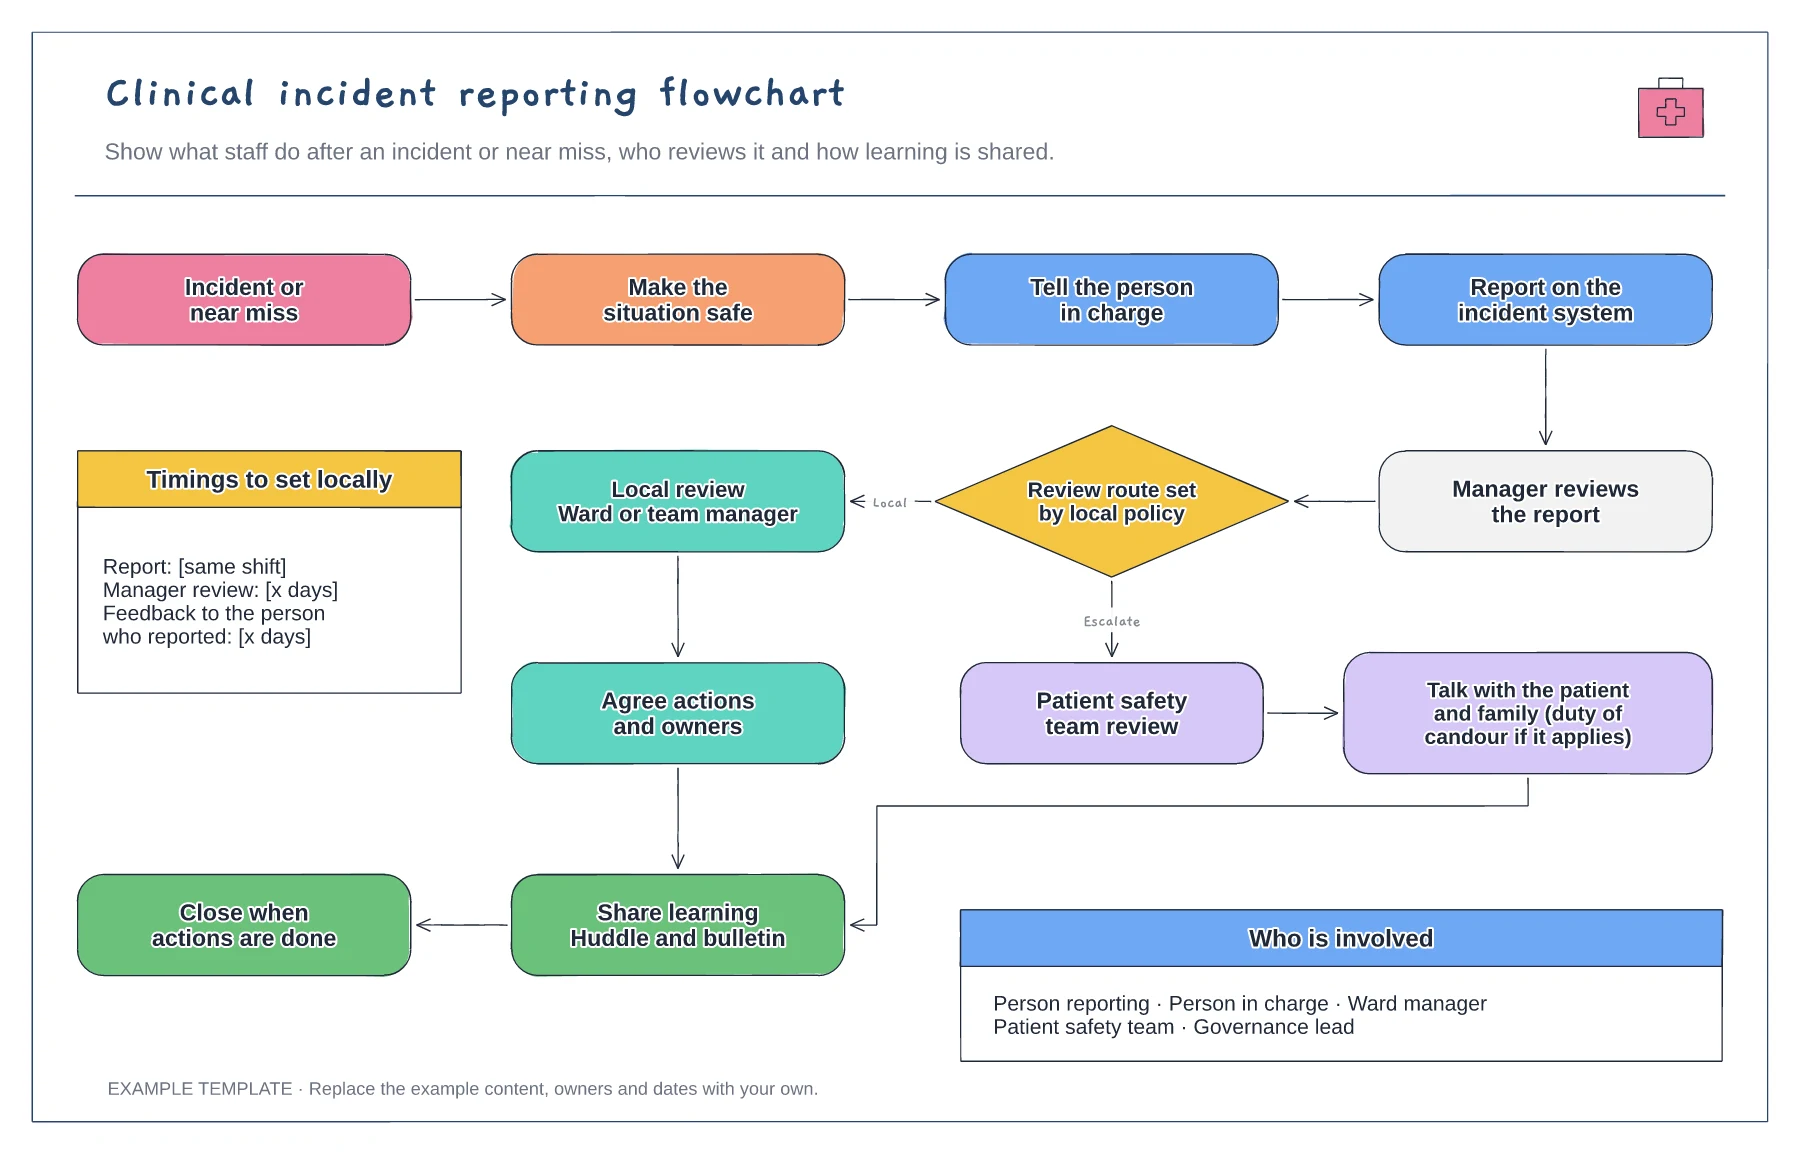
Immediate actions and reporting · Review route set by local policy · Learning shared and report closed
Preview and use template →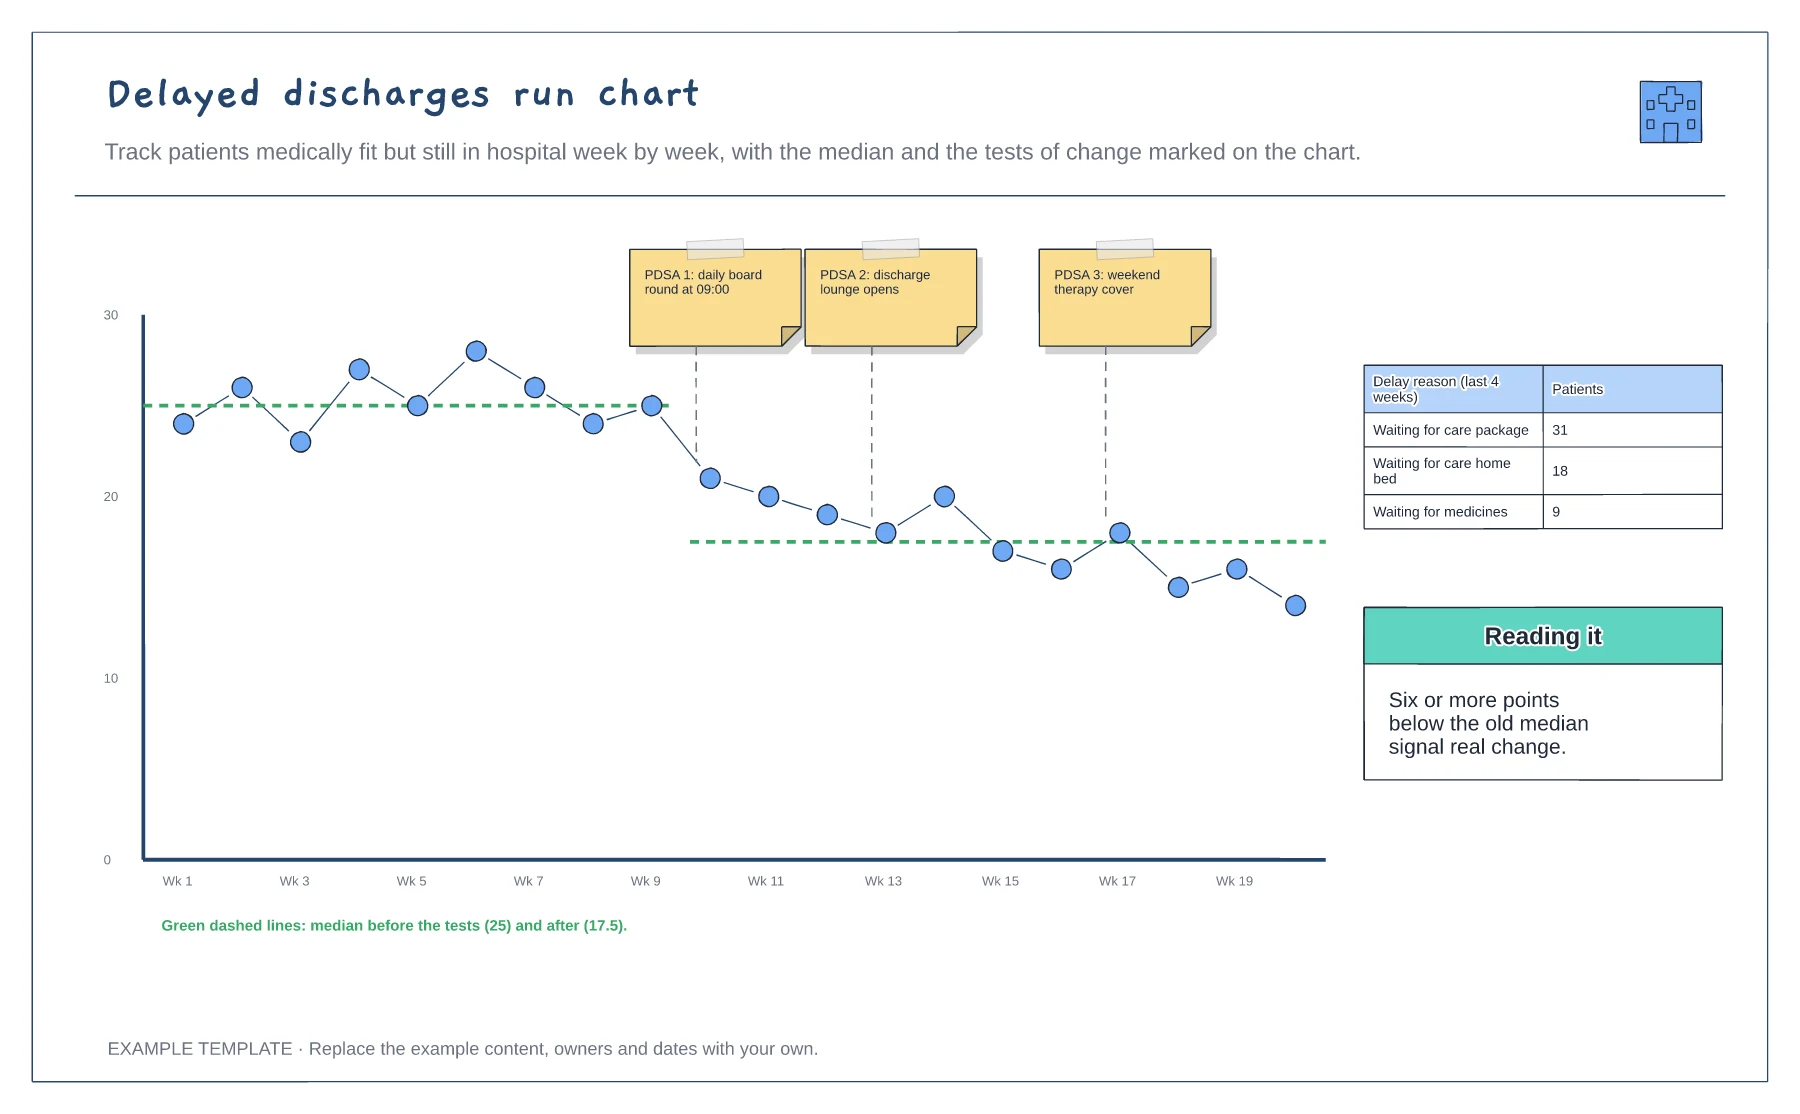
Weekly counts over 20 weeks · Tests of change marked on the chart · Medians before and after, and delay reasons
Preview and use template →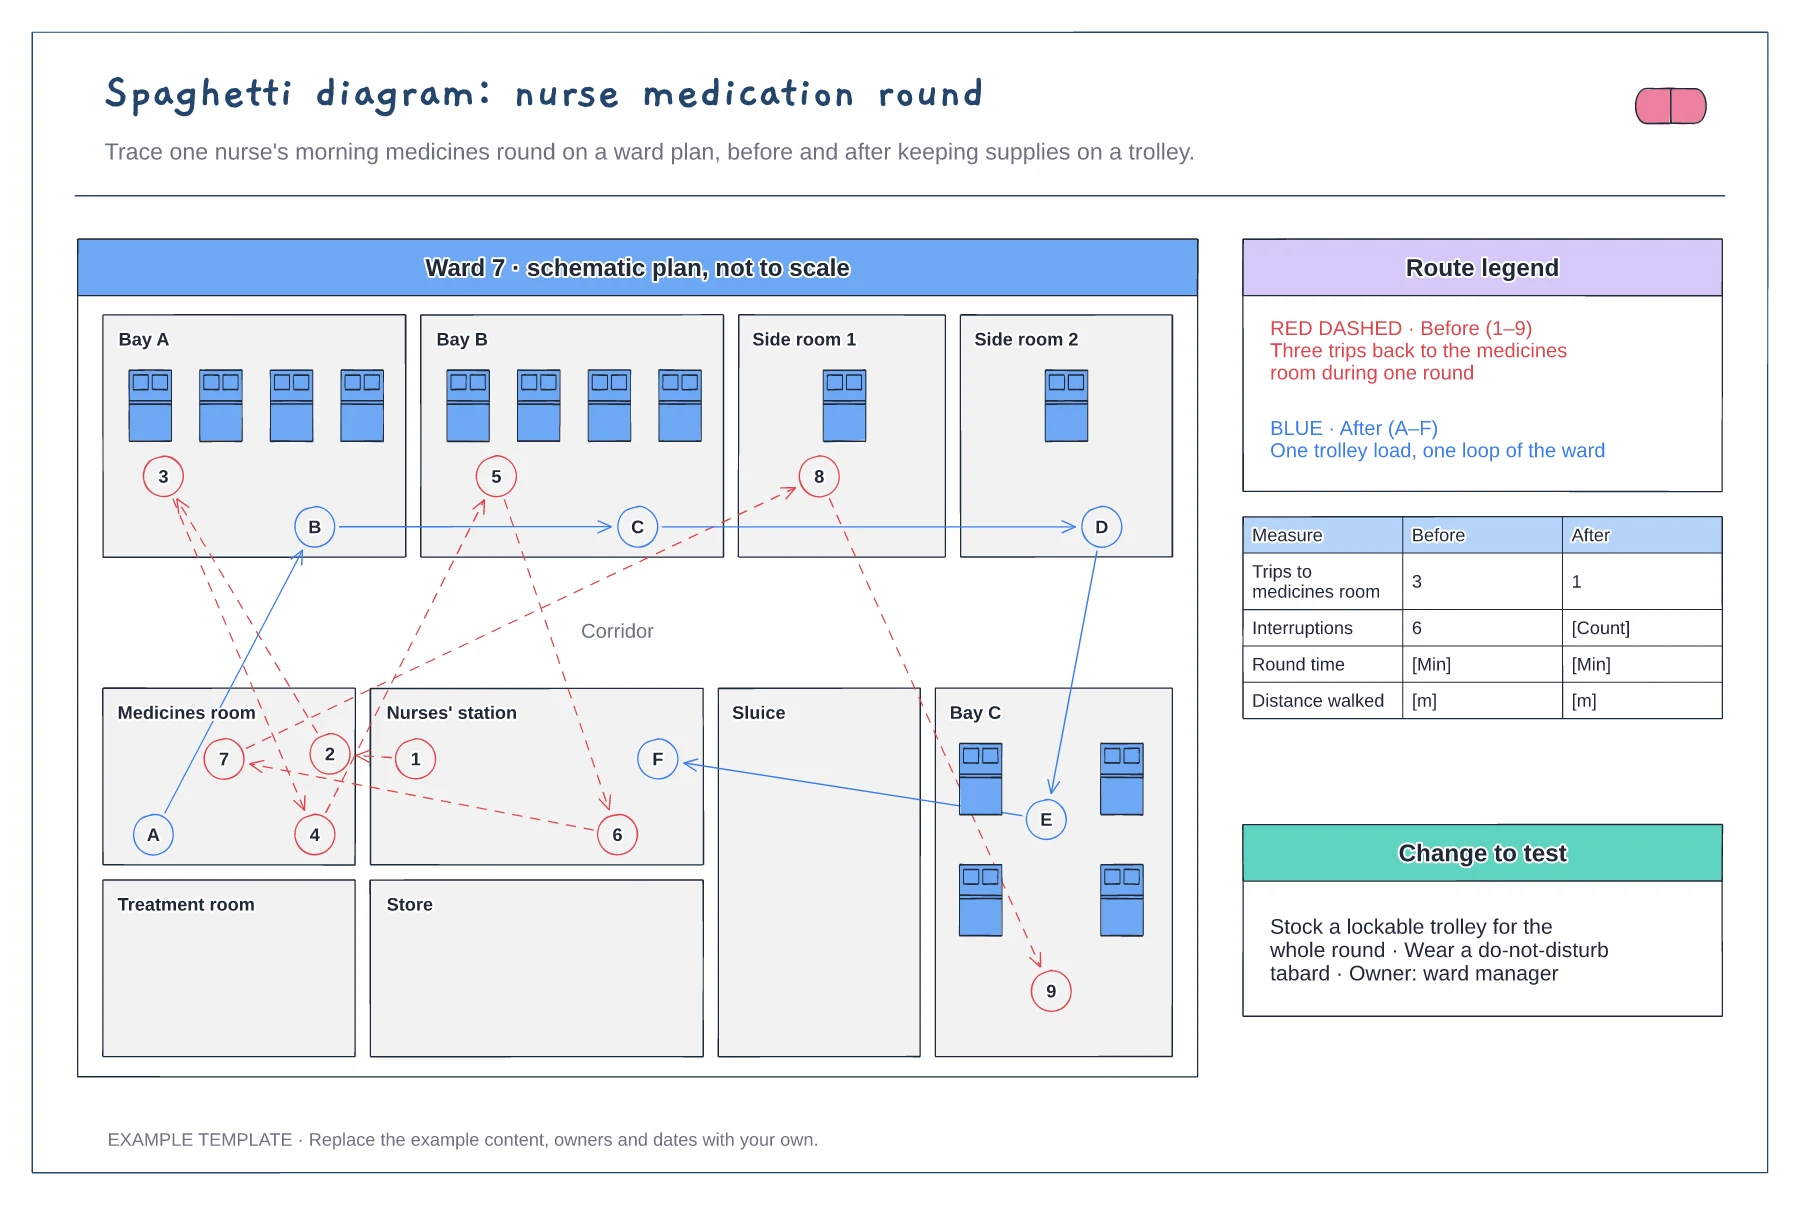
Ward floor plan with bays and rooms · Before and after routes with numbered stops · Measures table and change to test
Preview and use template →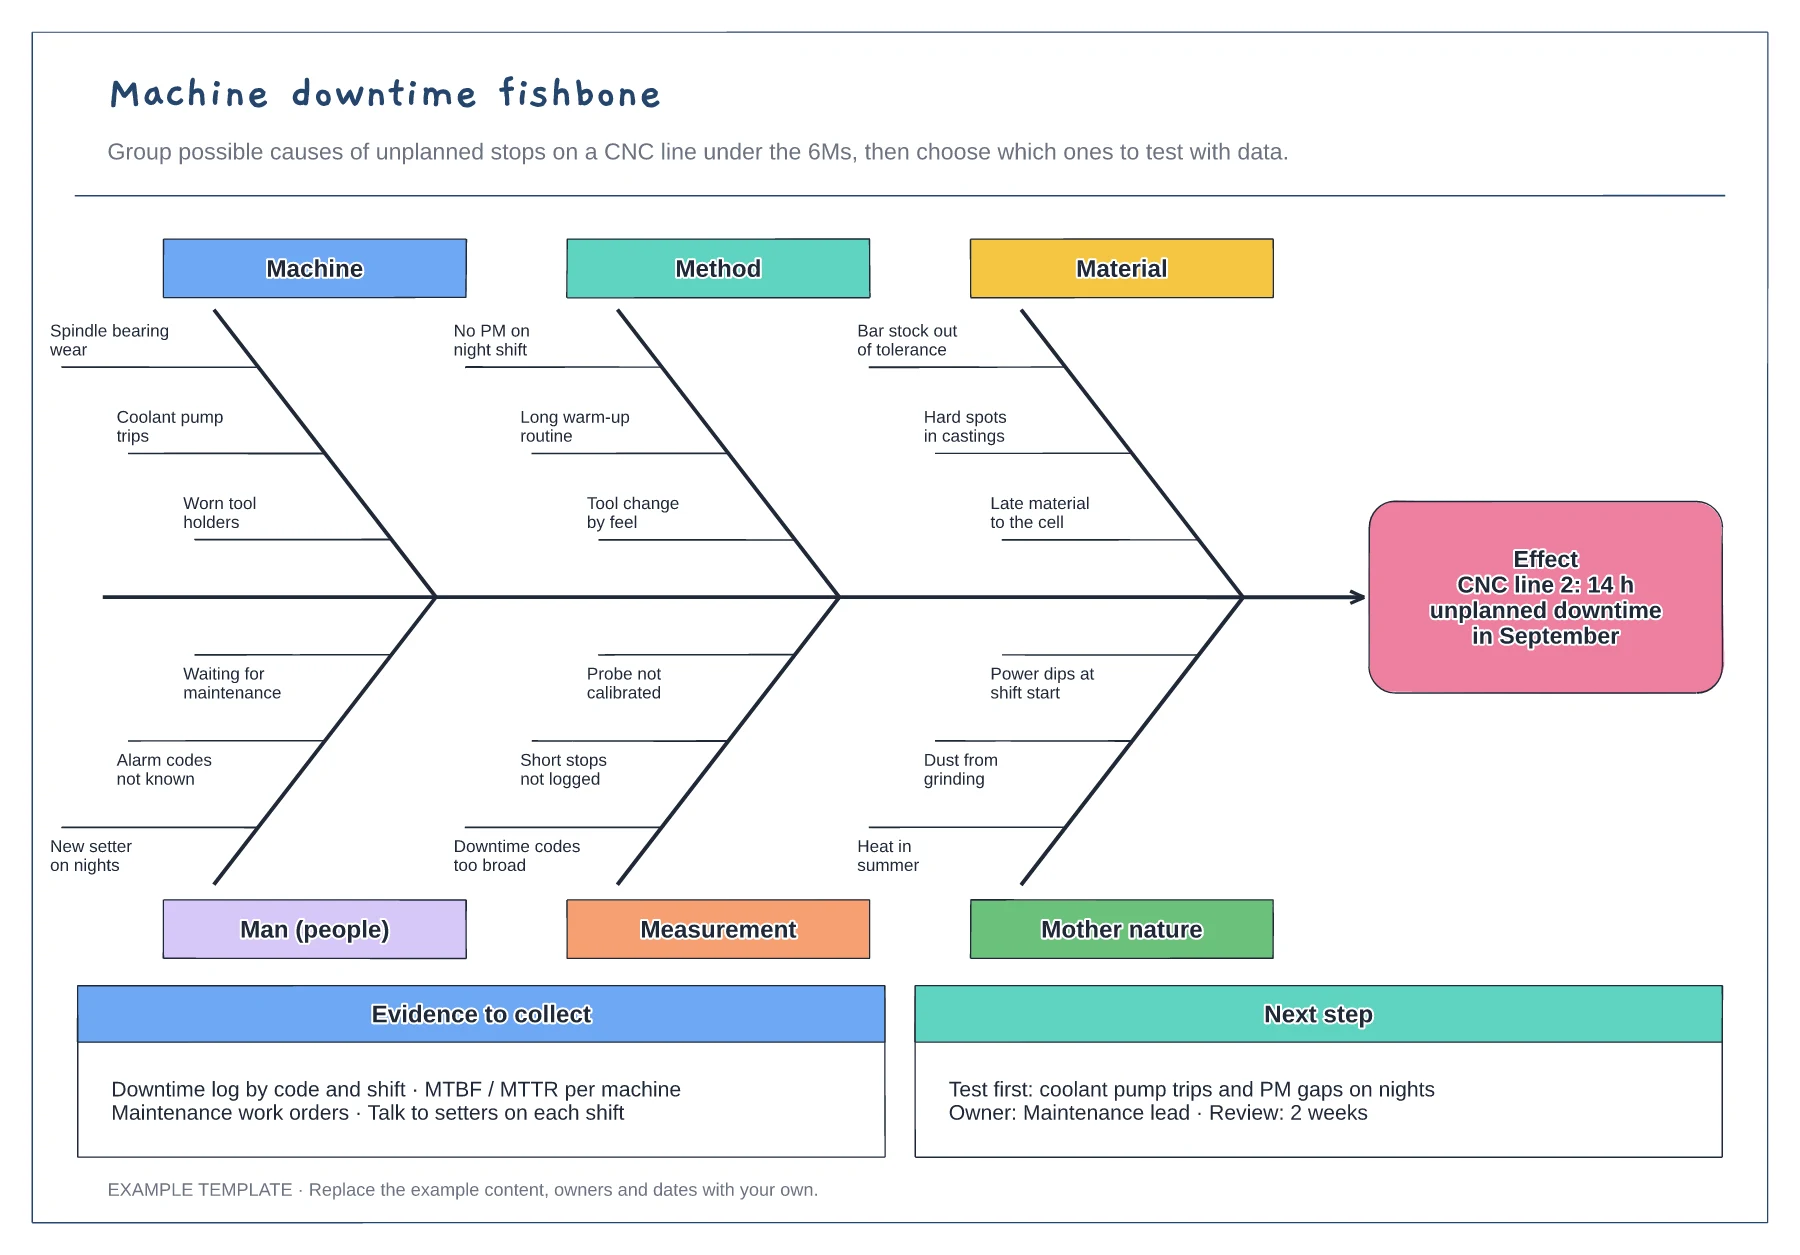
6M fishbone with three causes per bone · Downtime effect stated with hours lost · Evidence list and next test with an owner
Preview and use template →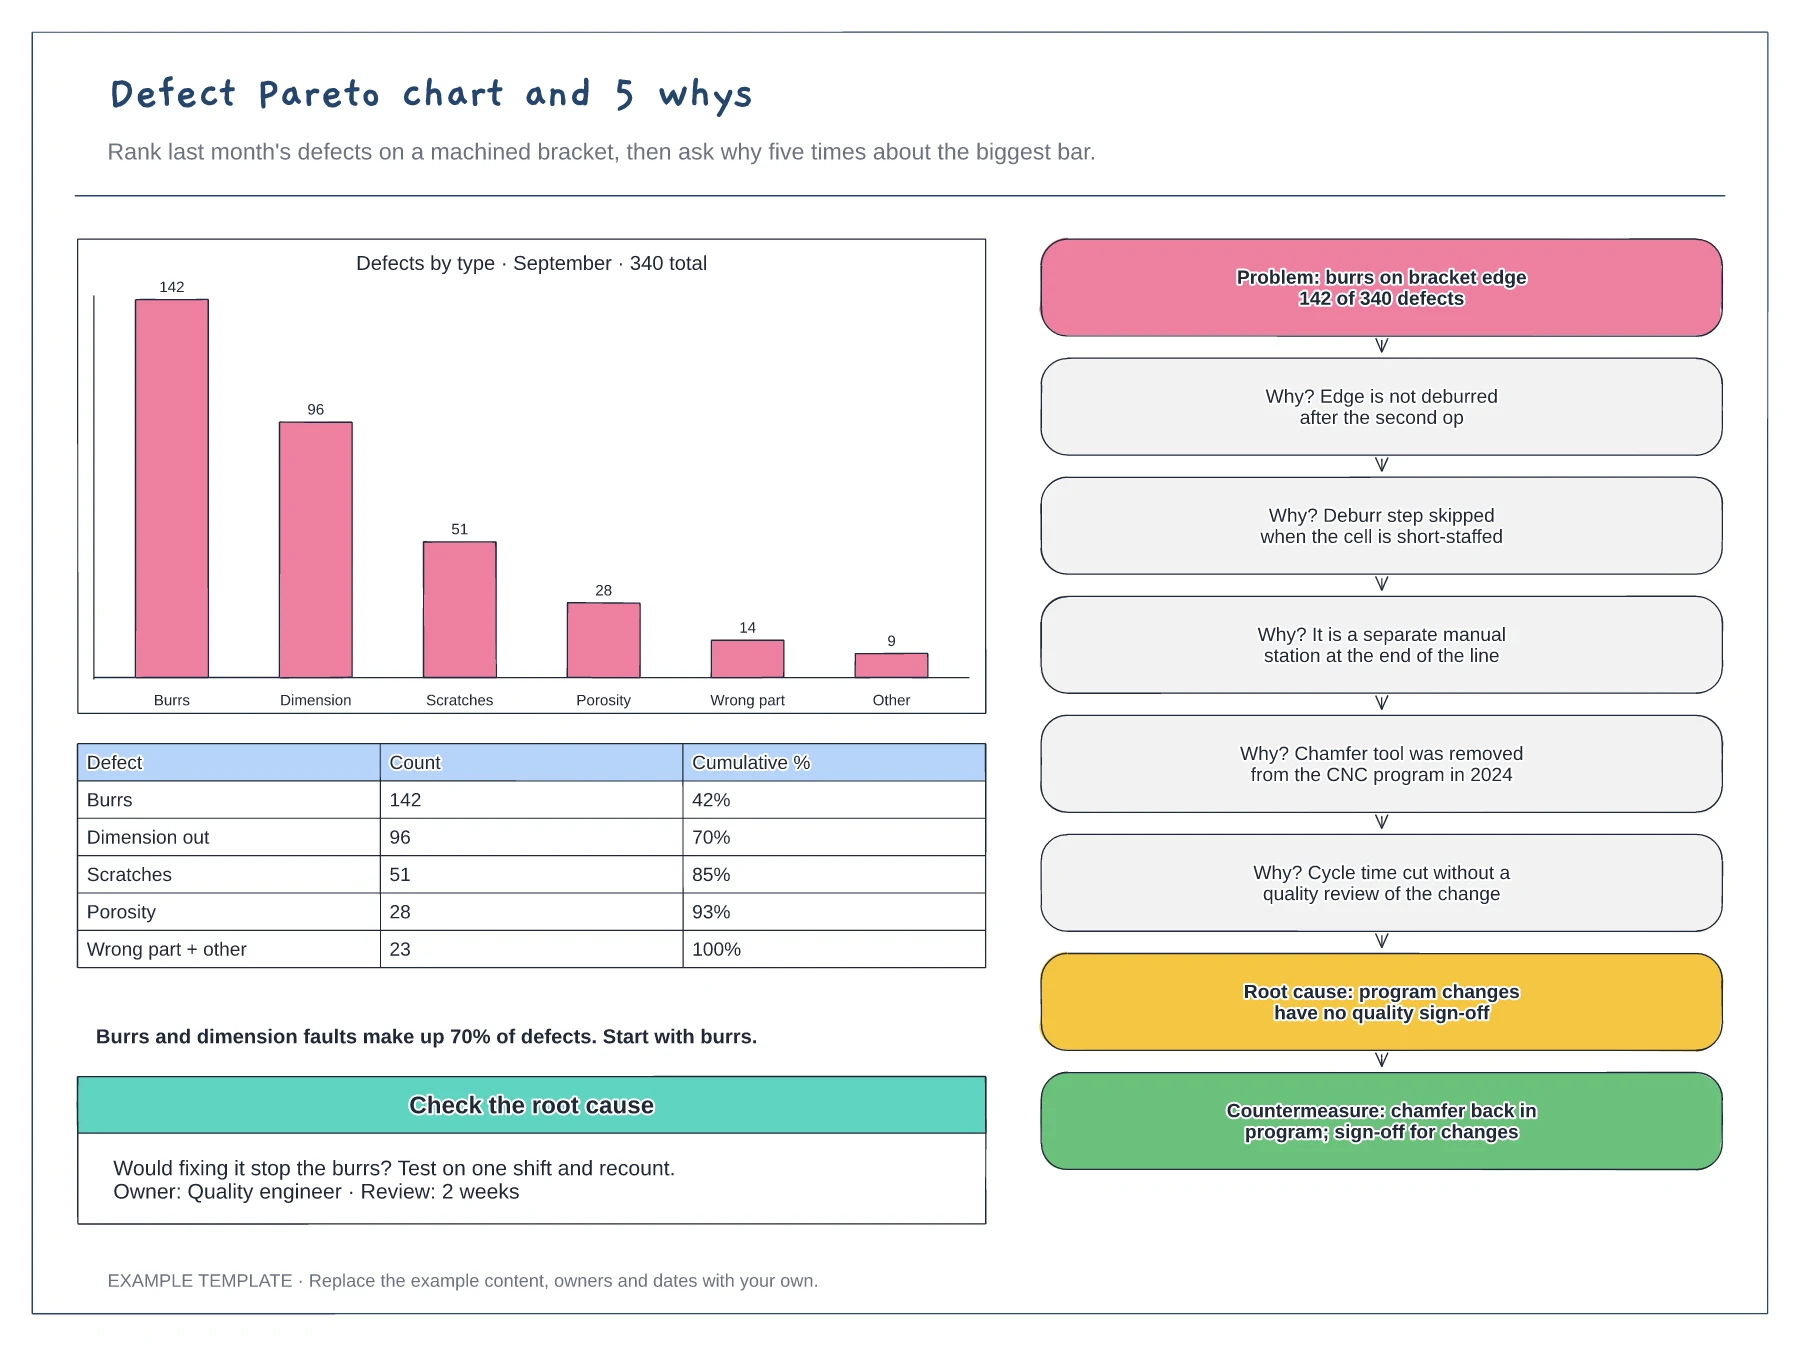
Pareto bar chart and cumulative table · 5 whys ladder from problem to root cause · Countermeasure and a check of the cause
Preview and use template →