Manufacturing
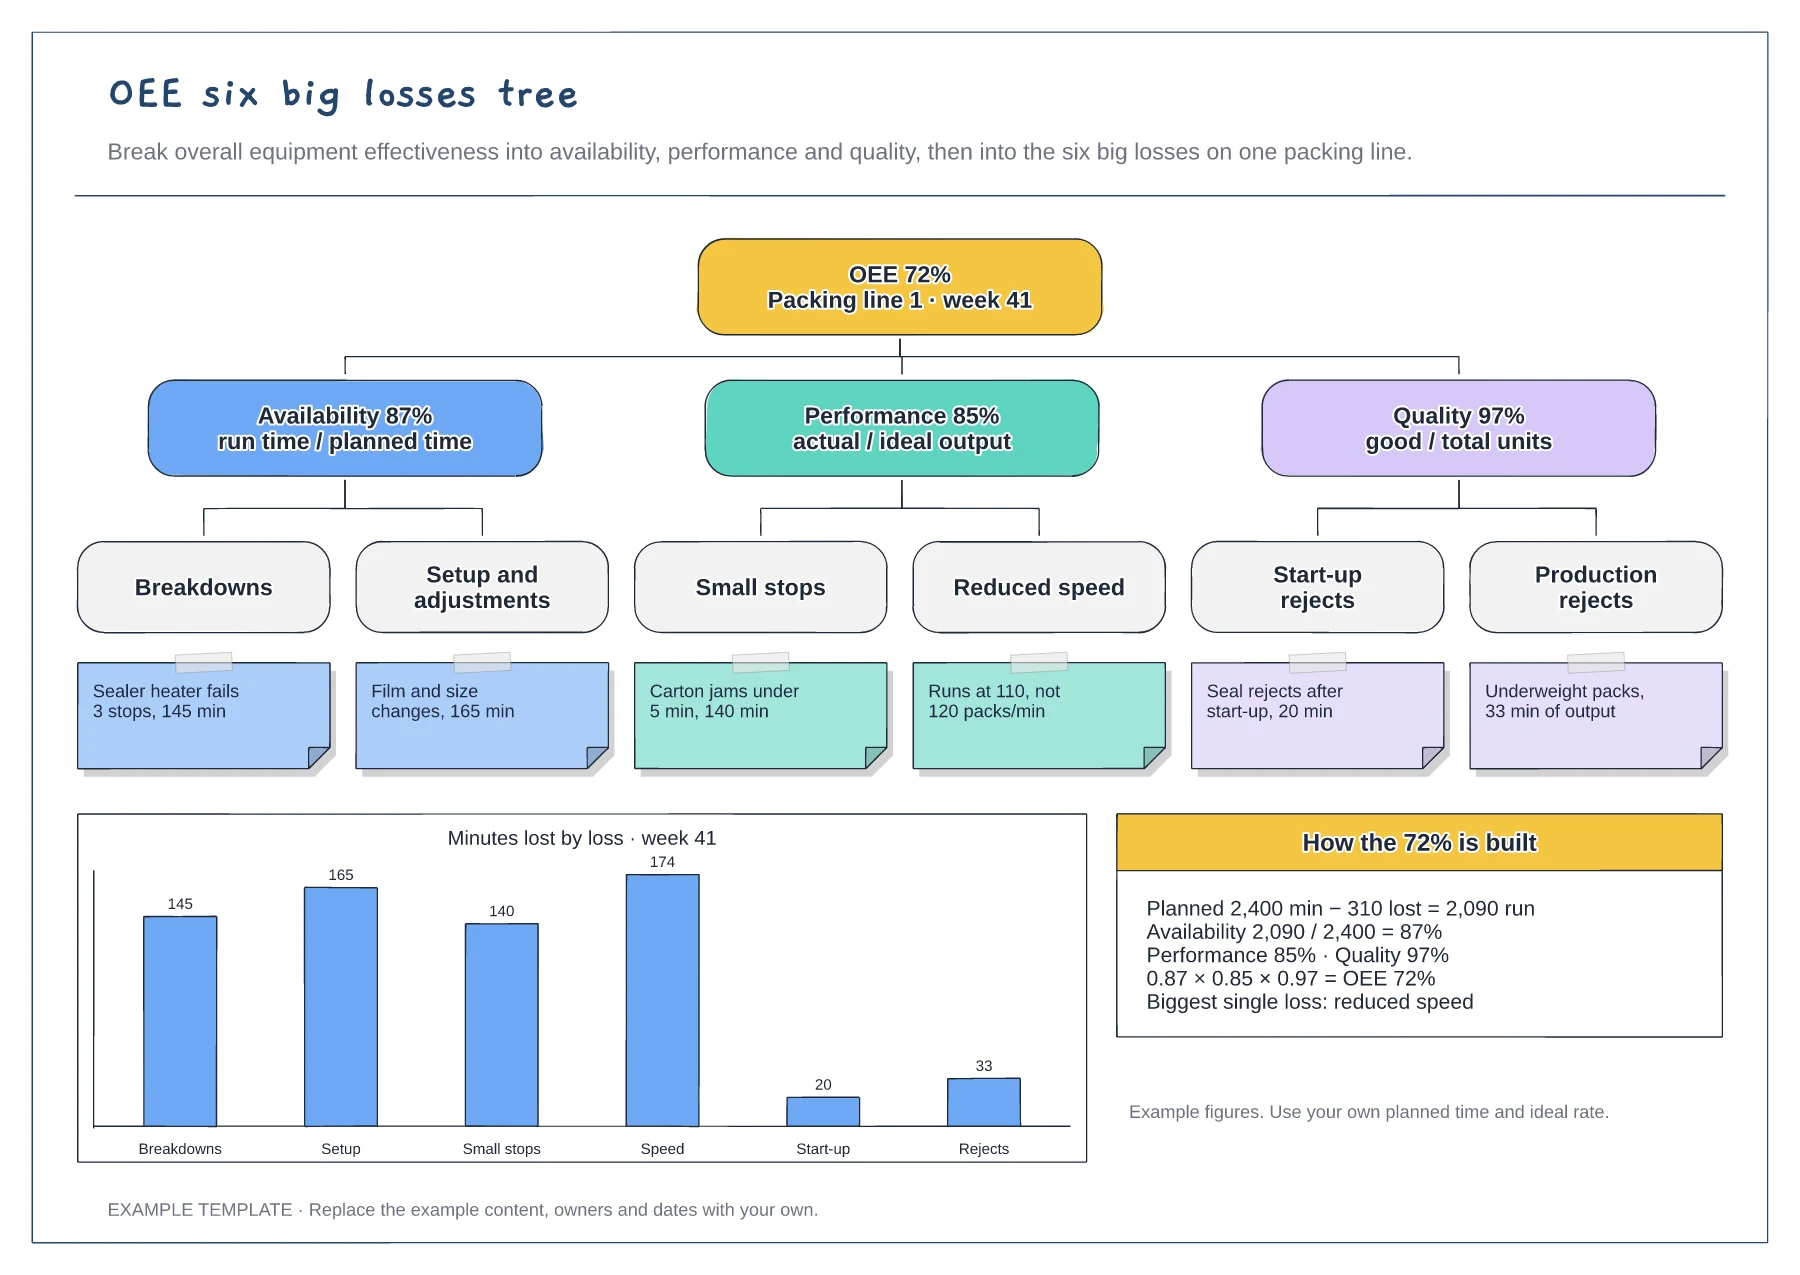
OEE six big losses tree template
Tree from OEE to the six big losses · Example cause under each loss · Minutes-lost chart and the OEE calculation
Preview and use template →A fishbone diagram helps a maintenance and production team list every plausible cause of unplanned downtime before agreeing which to investigate. This example looks at 14 hours of lost time on a CNC line, groups 18 candidate causes under Machine, Method, Material, Man, Measurement and Mother nature, and names the two to test first.
No account needed · Opens as your own editable page
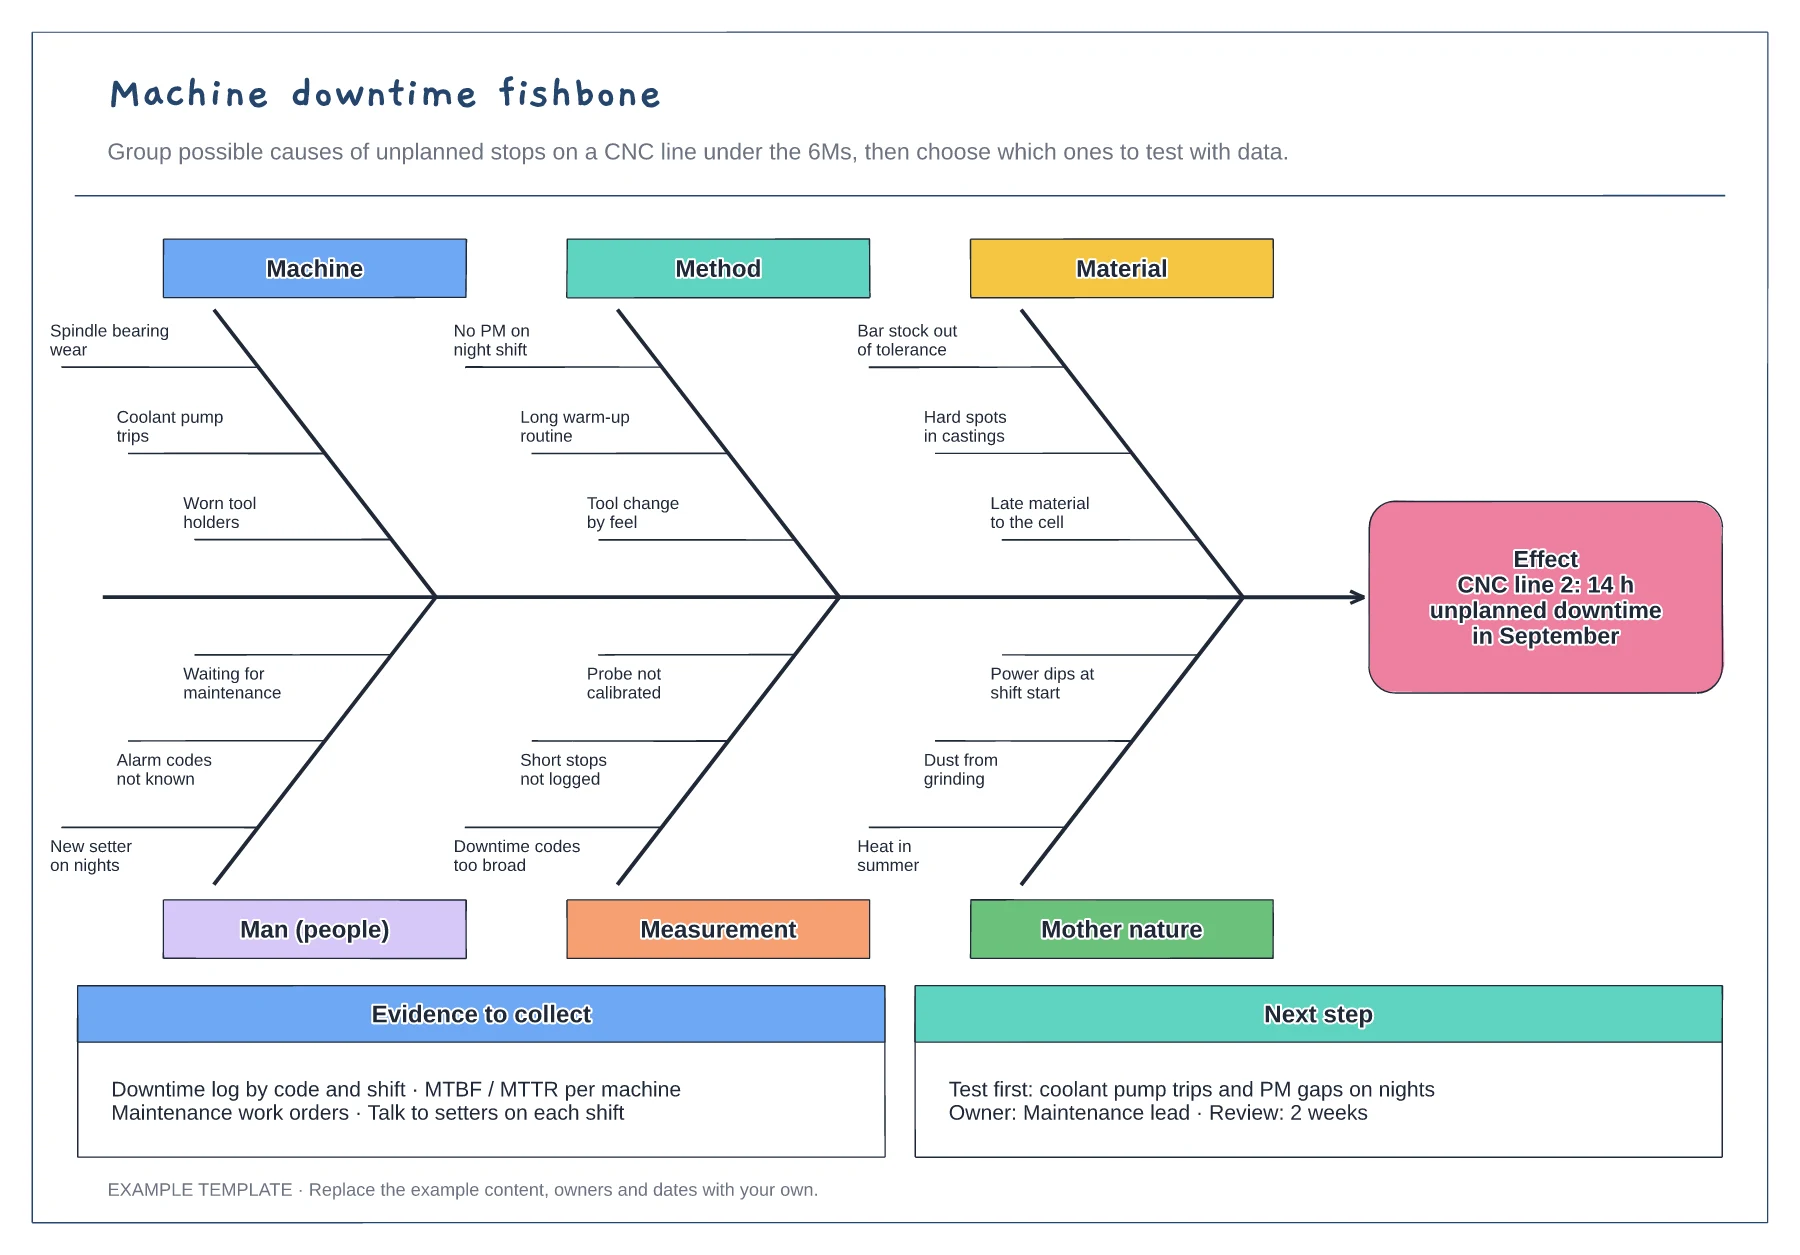
Replace the effect with your machine, period and hours or stops lost. A measured effect keeps the discussion on one problem and gives you a baseline to check against later.
Fill the bones with setters, operators and maintenance from every shift. Night shift often sees causes, such as missing preventive maintenance, that day shift never does.
Pick two causes the team suspects most and check them against the downtime log, MTBF and work orders. A cause that is not in the data is probably not your biggest loss.
Yes. Rewrite the effect at the head of the fishbone and replace the causes on each 6M bone; rename a bone if a category does not fit.
No. Open the template and edit it in your browser. Your work saves on this device. An account is optional if you want to sync your workspace.
Yes. Use Export in the editor to save a PNG, SVG or PDF, or download an editable .epicdraw backup.
Tree from OEE to the six big losses · Example cause under each loss · Minutes-lost chart and the OEE calculation
Preview and use template →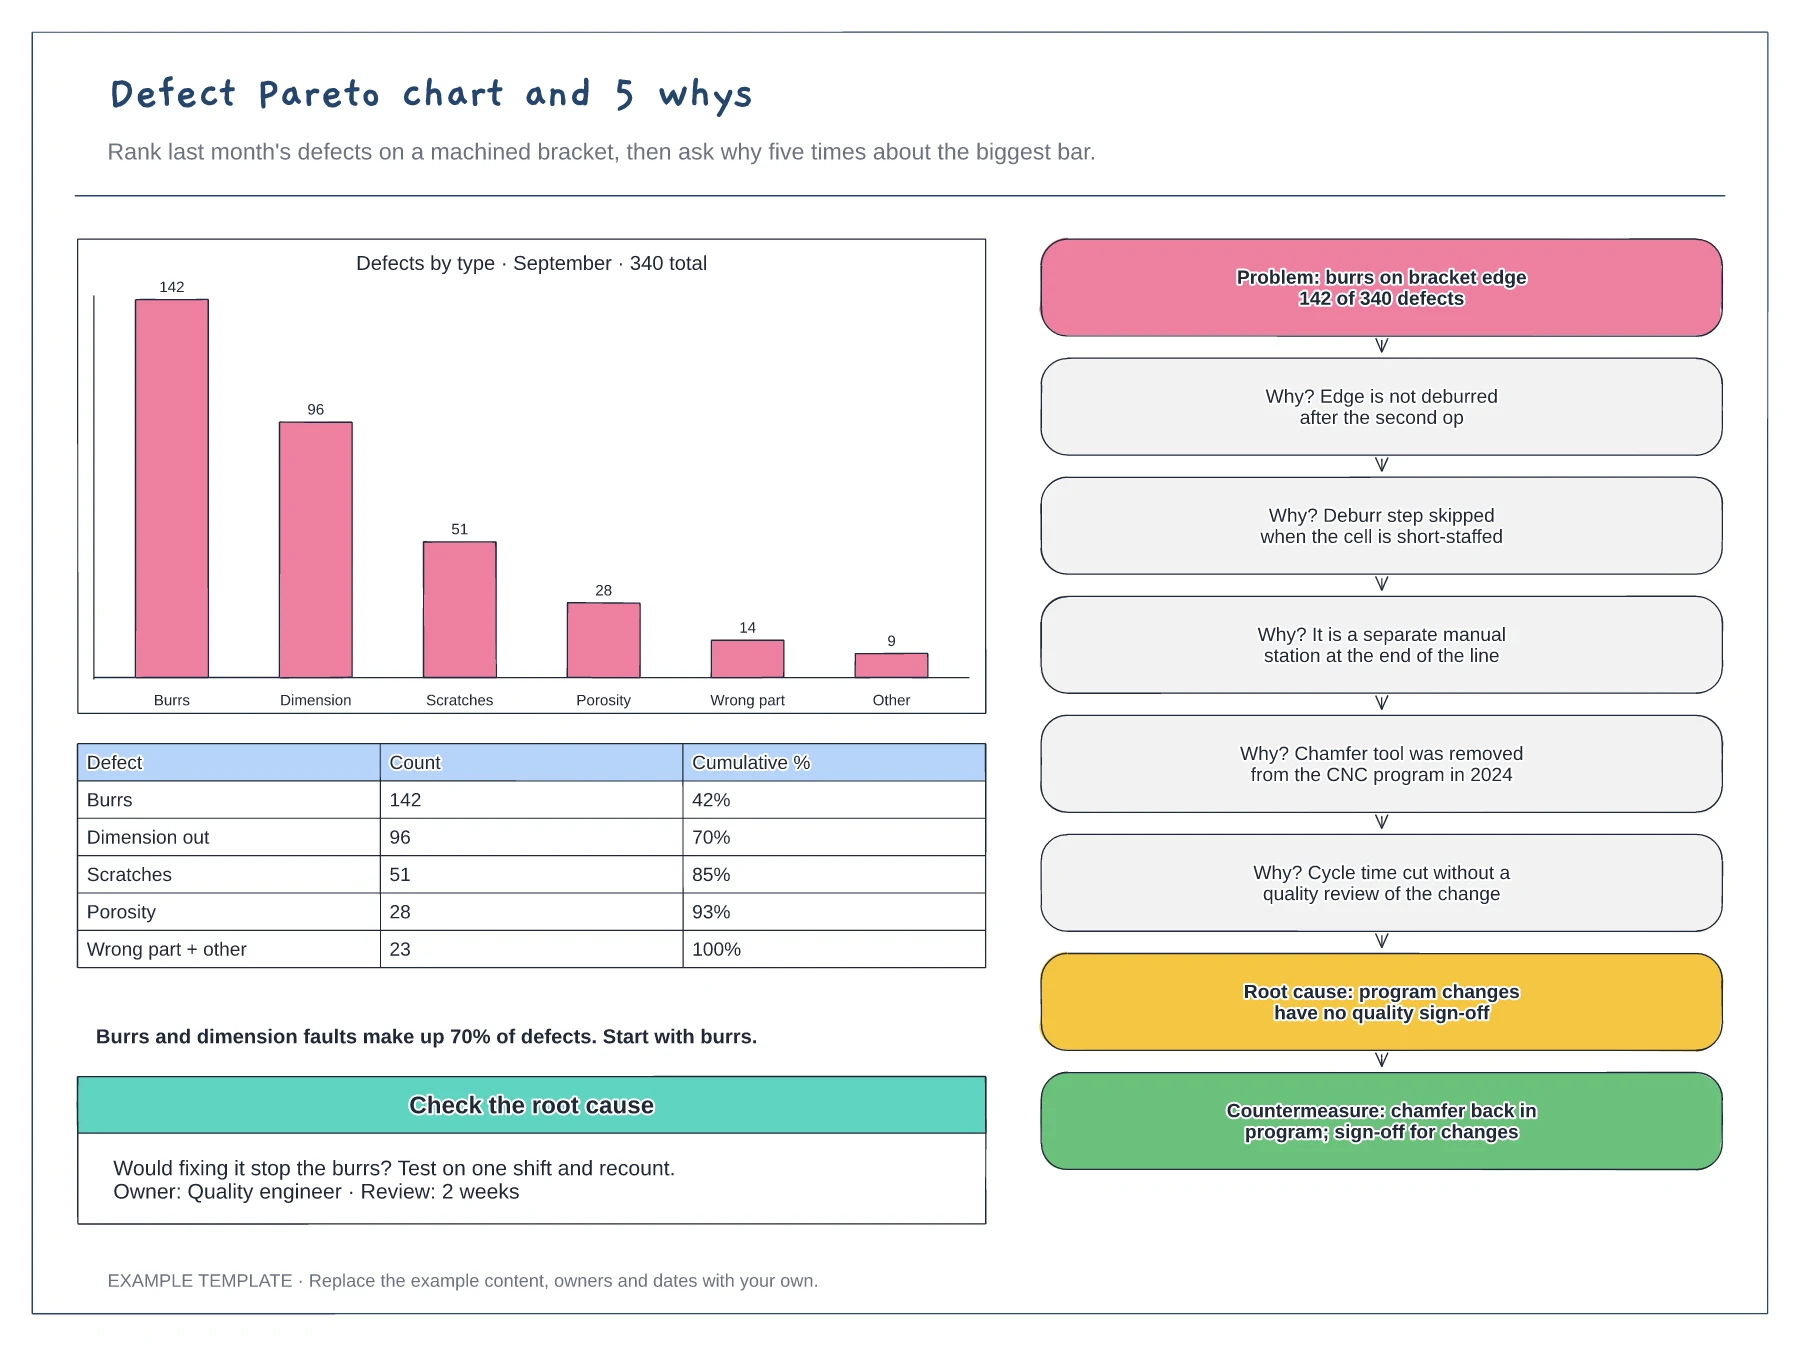
Pareto bar chart and cumulative table · 5 whys ladder from problem to root cause · Countermeasure and a check of the cause
Preview and use template →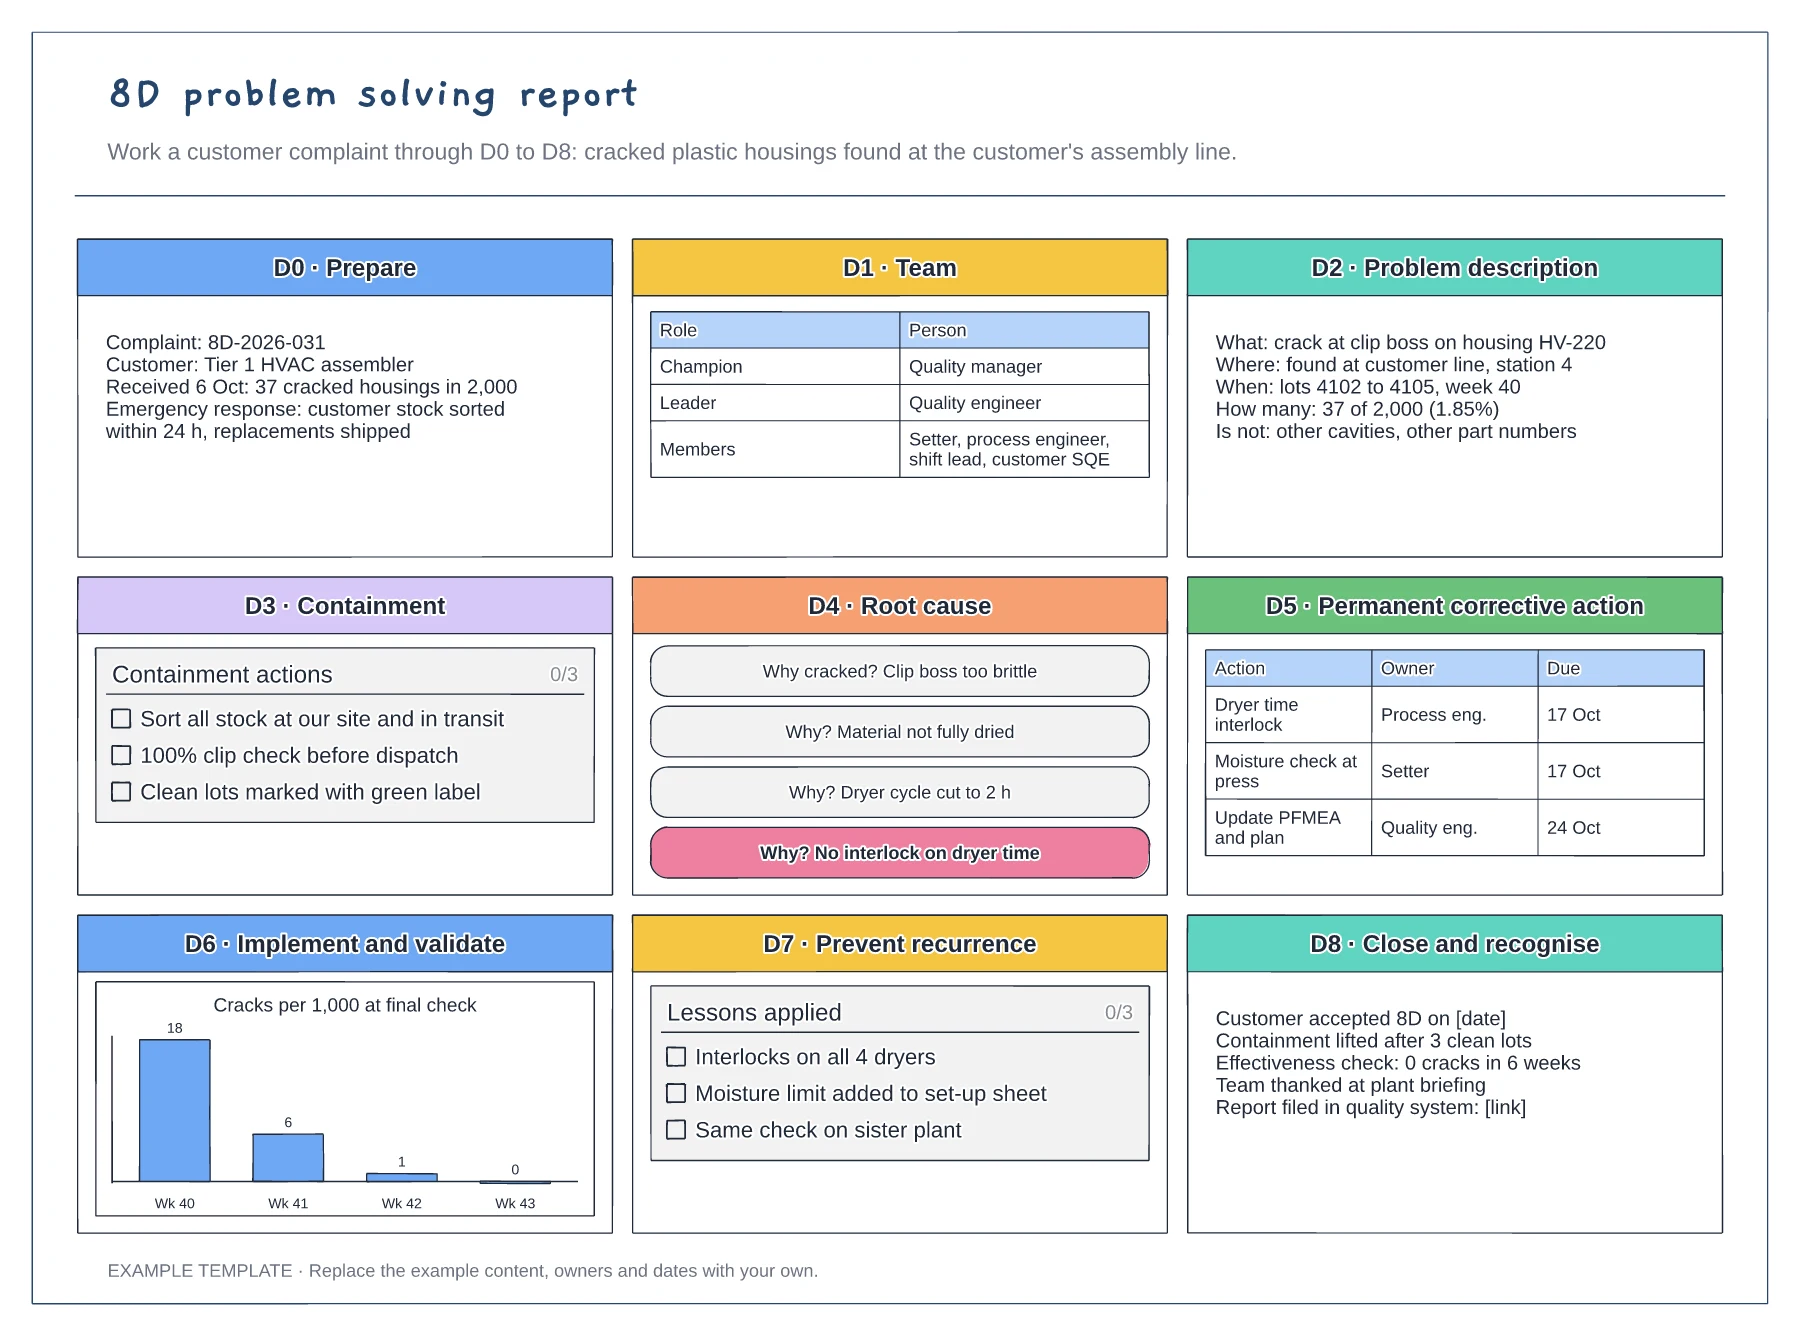
Nine panels from D0 to D8 · 5 whys root cause and action table · Validation chart and closure record
Preview and use template →
Promise-to-delivery waterfall · Hours added by each stage · Share of late orders and owners
Preview and use template →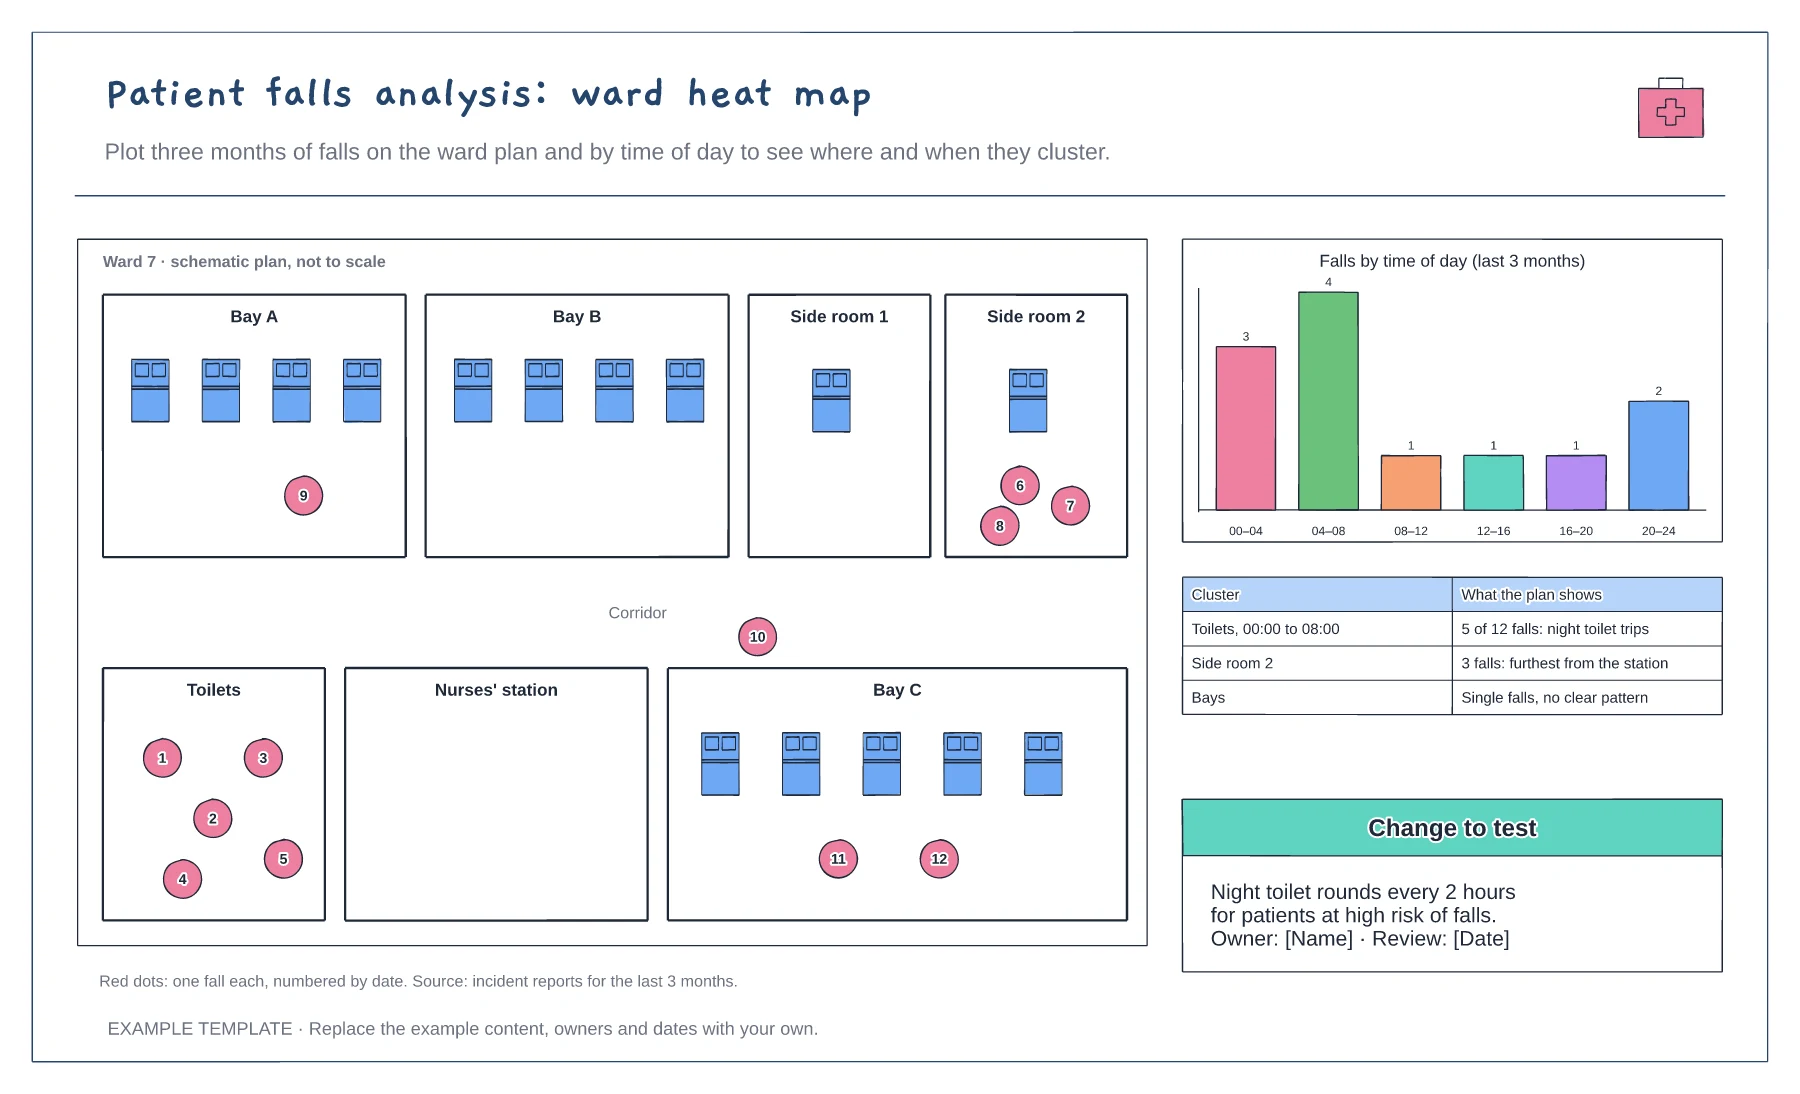
Ward plan with each fall plotted · Falls by time of day chart · Clusters and a change to test
Preview and use template →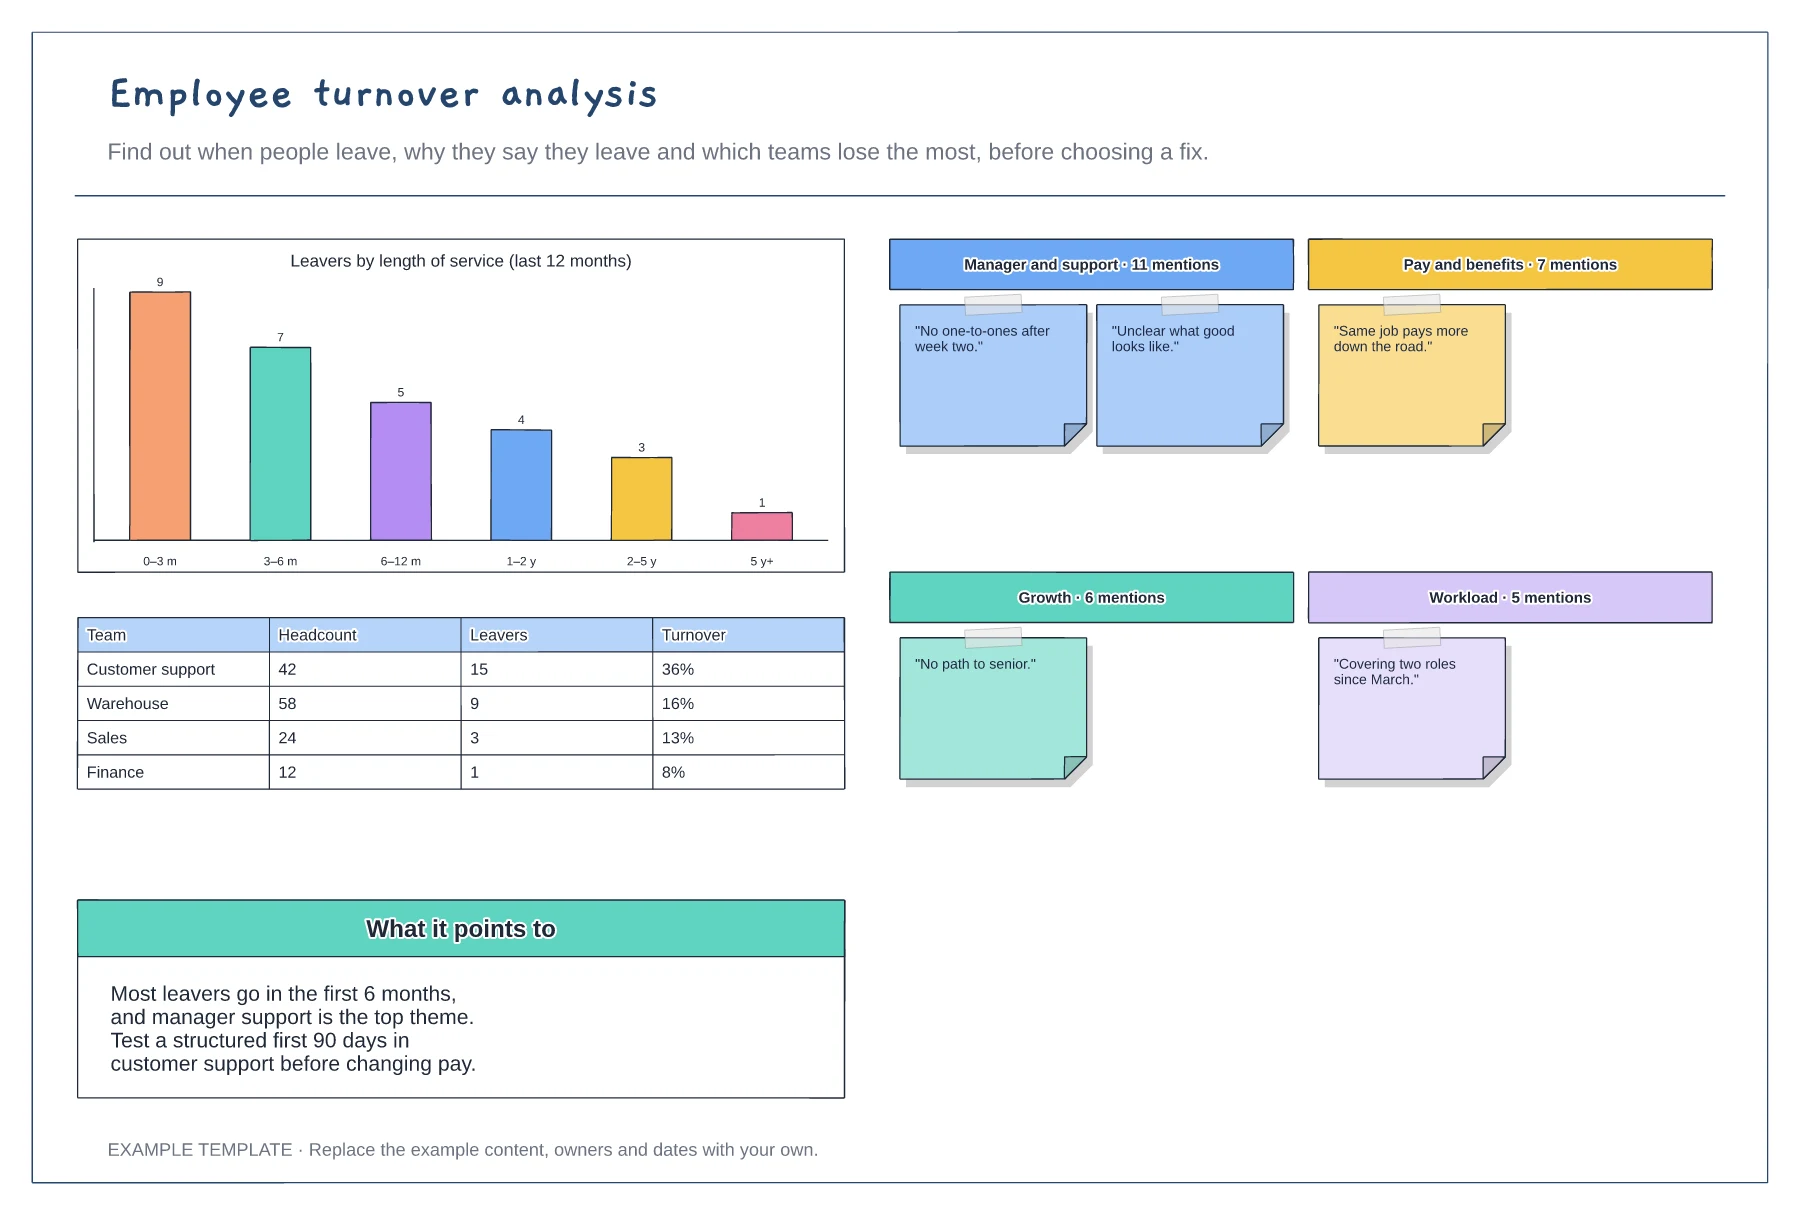
Leavers by length of service · Exit interview themes with quotes · Turnover by team
Preview and use template →