Manufacturing
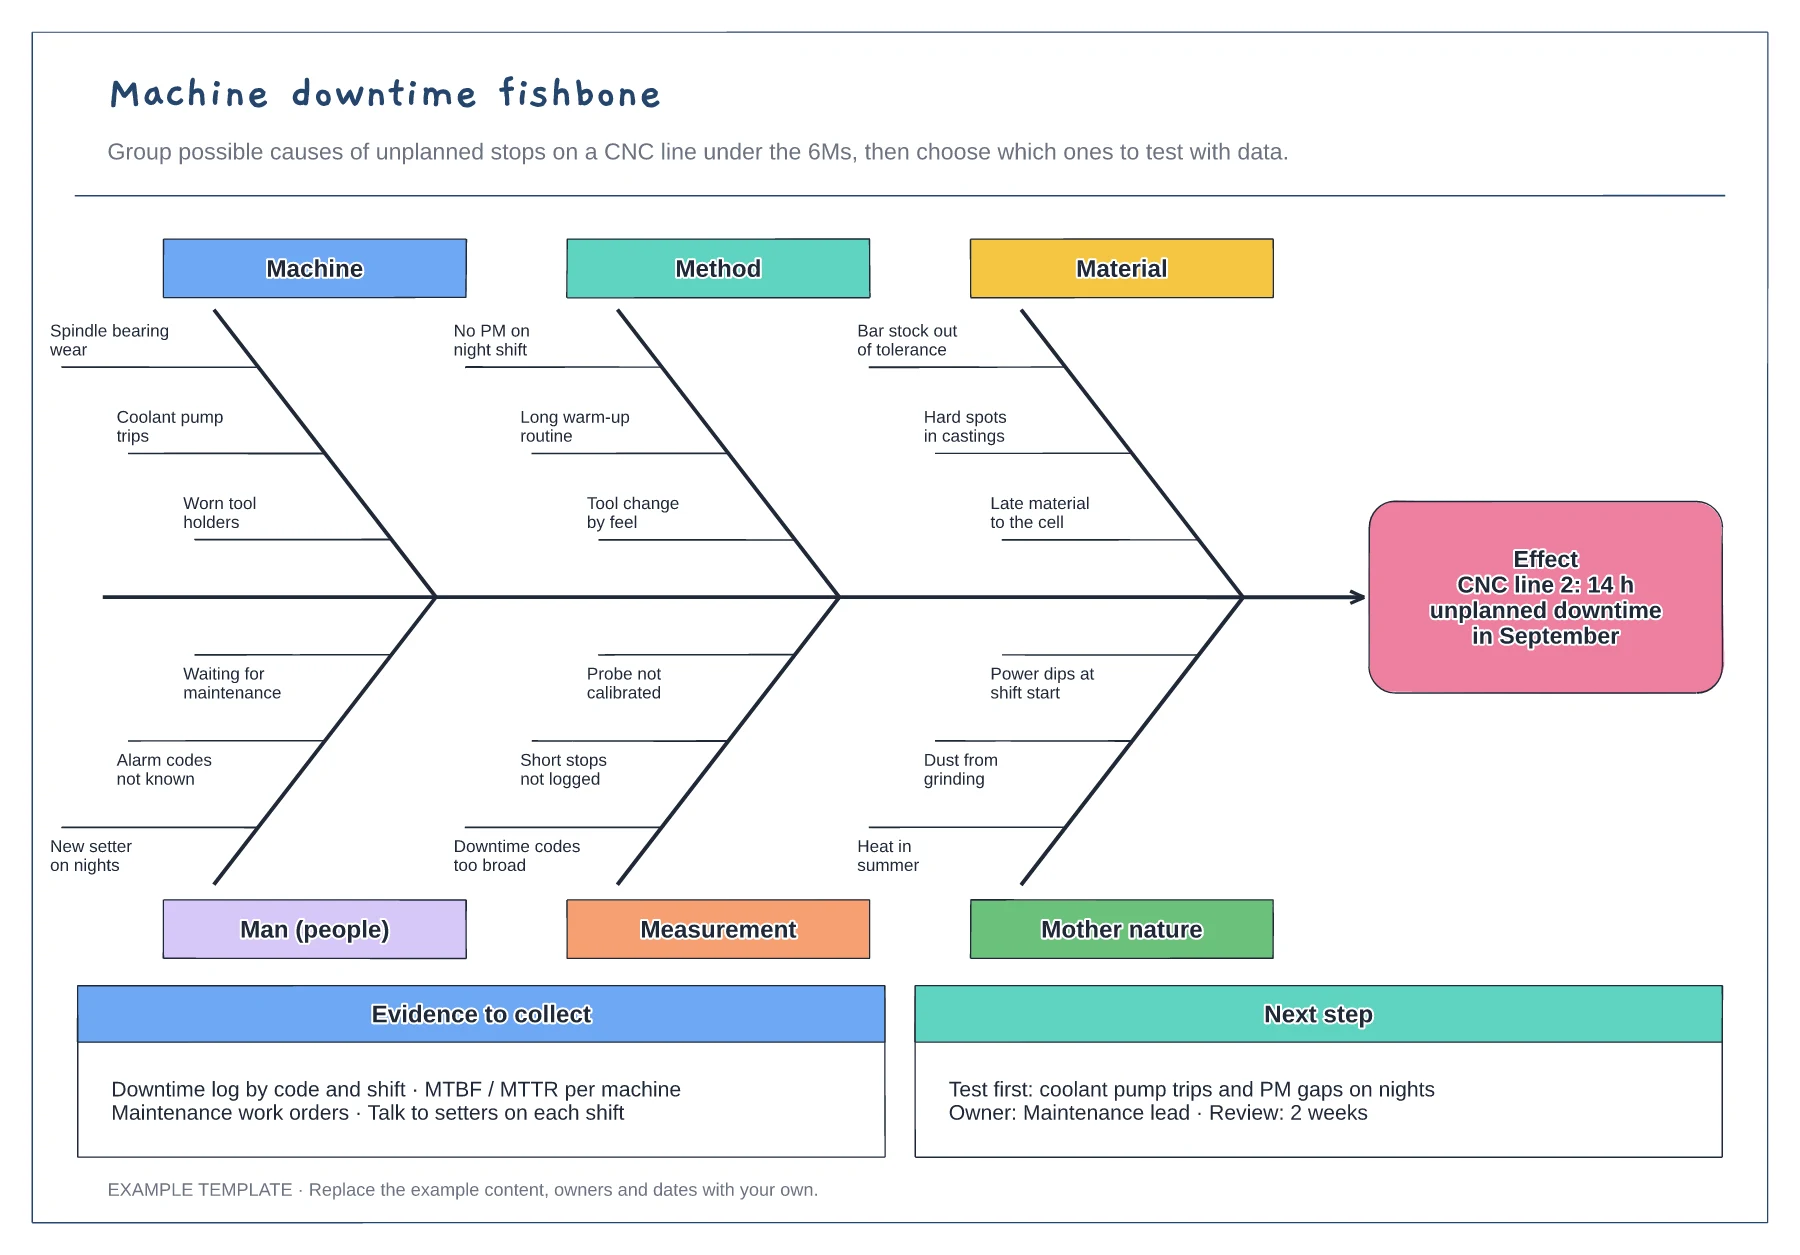
Machine downtime fishbone diagram template
6M fishbone with three causes per bone · Downtime effect stated with hours lost · Evidence list and next test with an owner
Preview and use template →A Pareto chart shows which few defect types cause most of the problem, and the 5 whys digs into the biggest one. This example ranks 340 defects on a machined bracket, shows that burrs and dimension faults account for 70%, then asks why five times about burrs until it reaches a program change made without a quality review.
No account needed · Opens as your own editable page
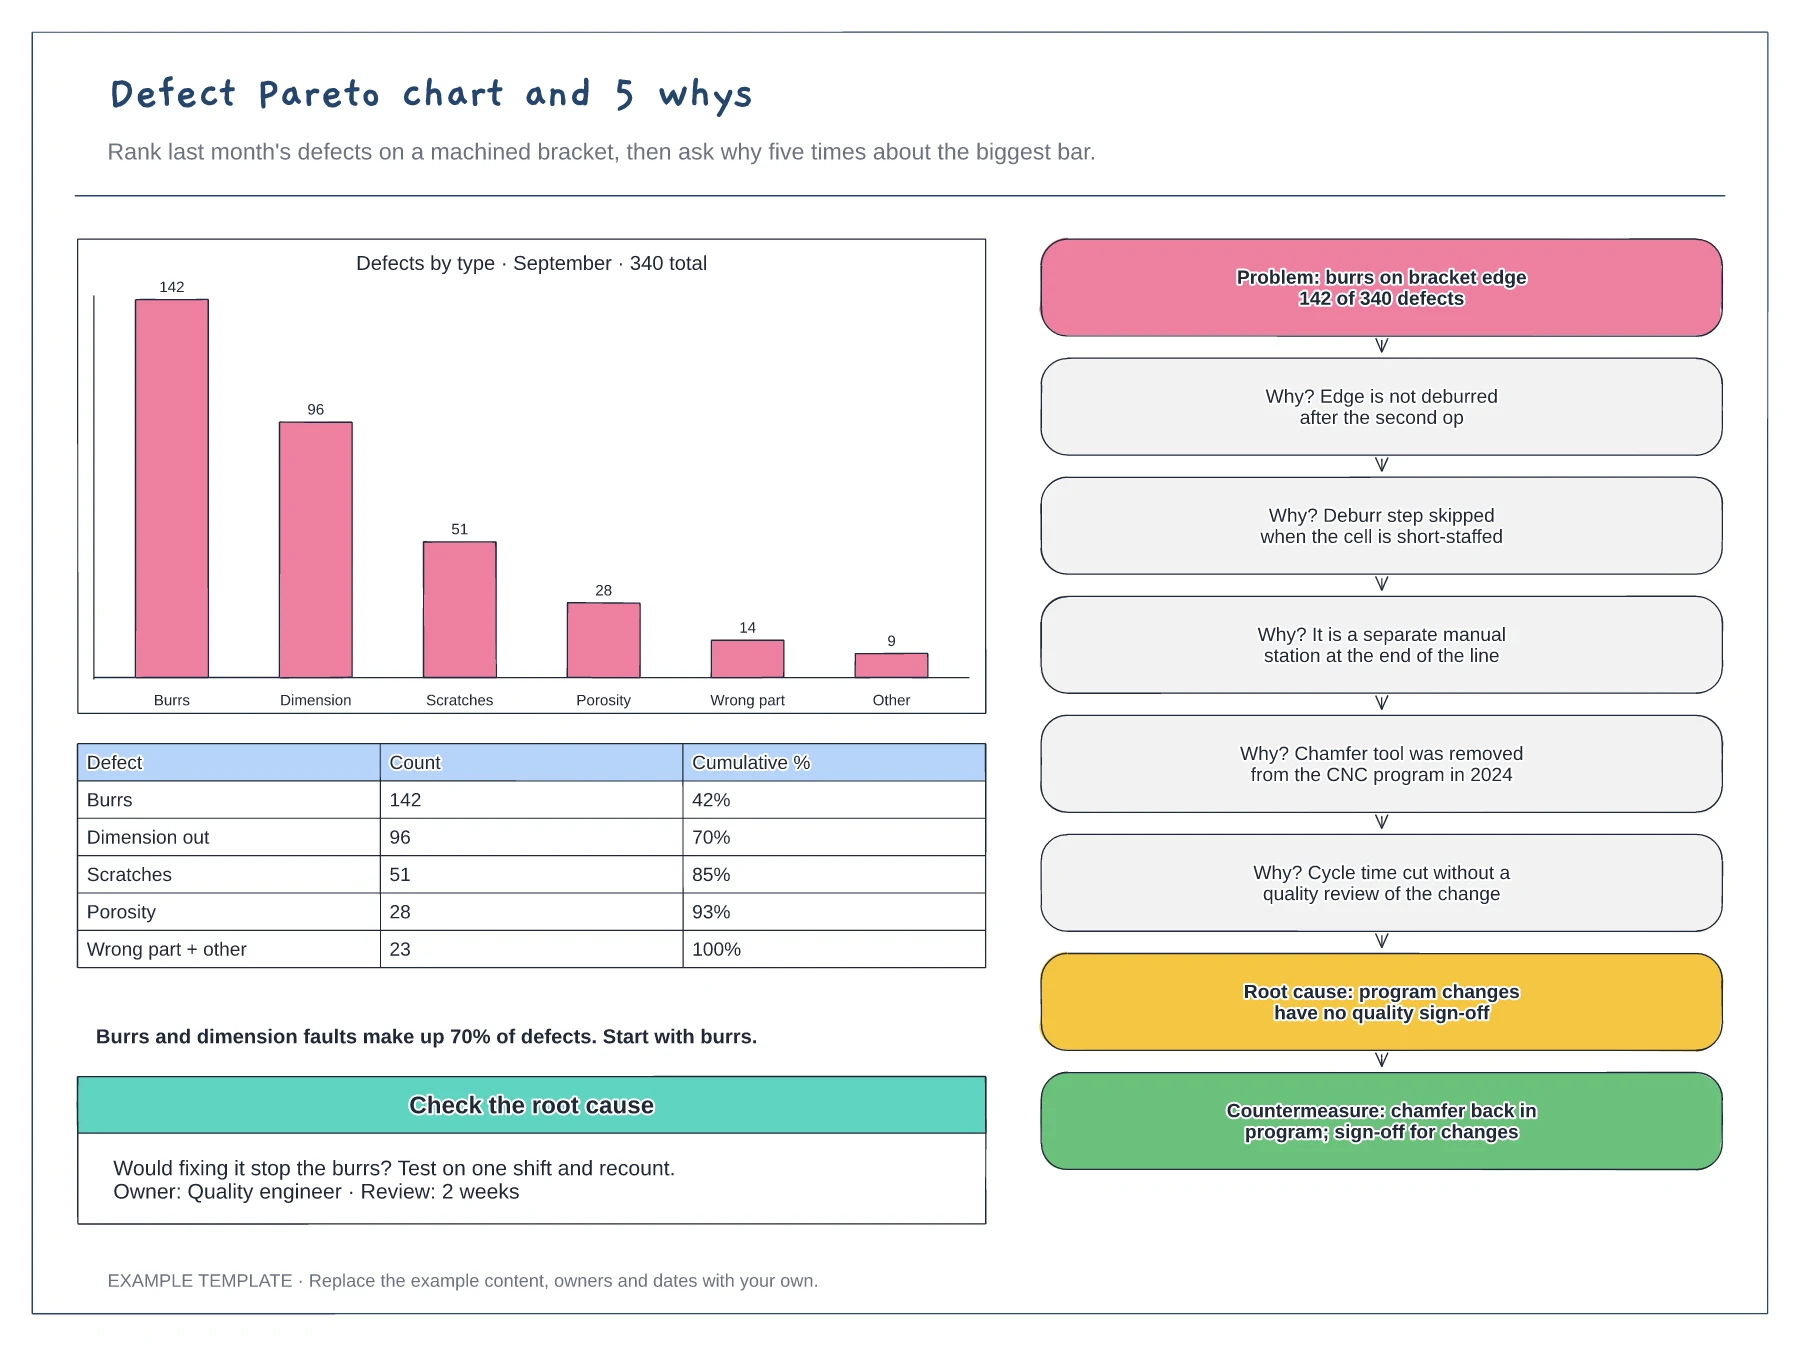
Replace the bars with your defect categories and counts, sorted largest first. Use the same categories as your inspection records so the chart can be repeated next month.
Run the 5 whys on the largest category, with people who know the process. Each answer should be a fact you can check, not a guess about someone's attitude.
Before rolling out the countermeasure, ask whether removing the cause would stop the defect, then trial it on one shift and recount. If the bar does not fall, go back up the ladder.
Start with the largest bar, as the board does, because it covers the most defects. Copy the ladder if you want to analyse the next bar too.
No. Open the template and edit it in your browser. Your work saves on this device. An account is optional if you want to sync your workspace.
Yes. Use Export in the editor to save a PNG, SVG or PDF, or download an editable .epicdraw backup.
6M fishbone with three causes per bone · Downtime effect stated with hours lost · Evidence list and next test with an owner
Preview and use template →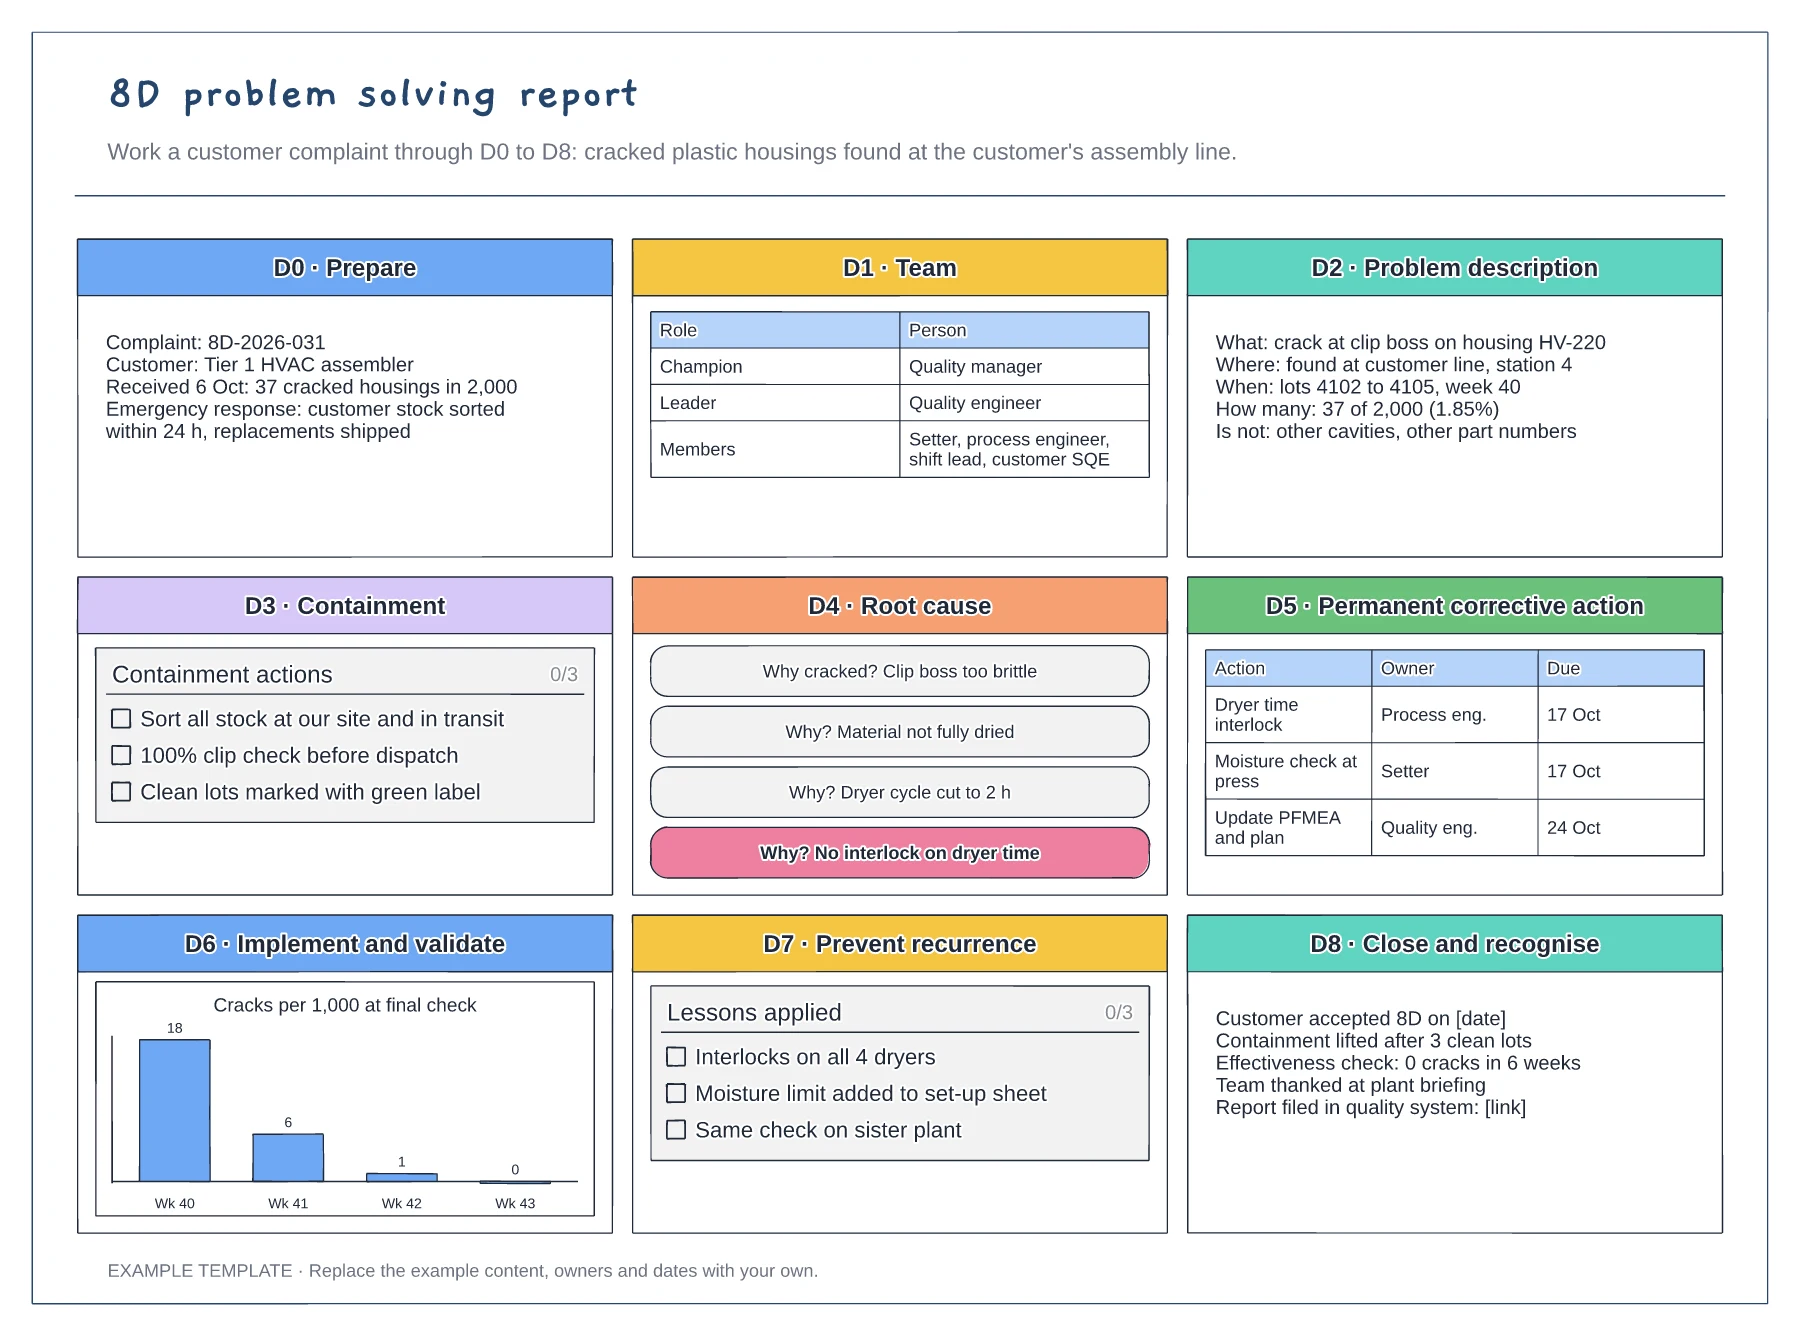
Nine panels from D0 to D8 · 5 whys root cause and action table · Validation chart and closure record
Preview and use template →
Problem statement and current condition · Cause analysis and countermeasure plan · Owners, checks and follow-up
Preview and use template →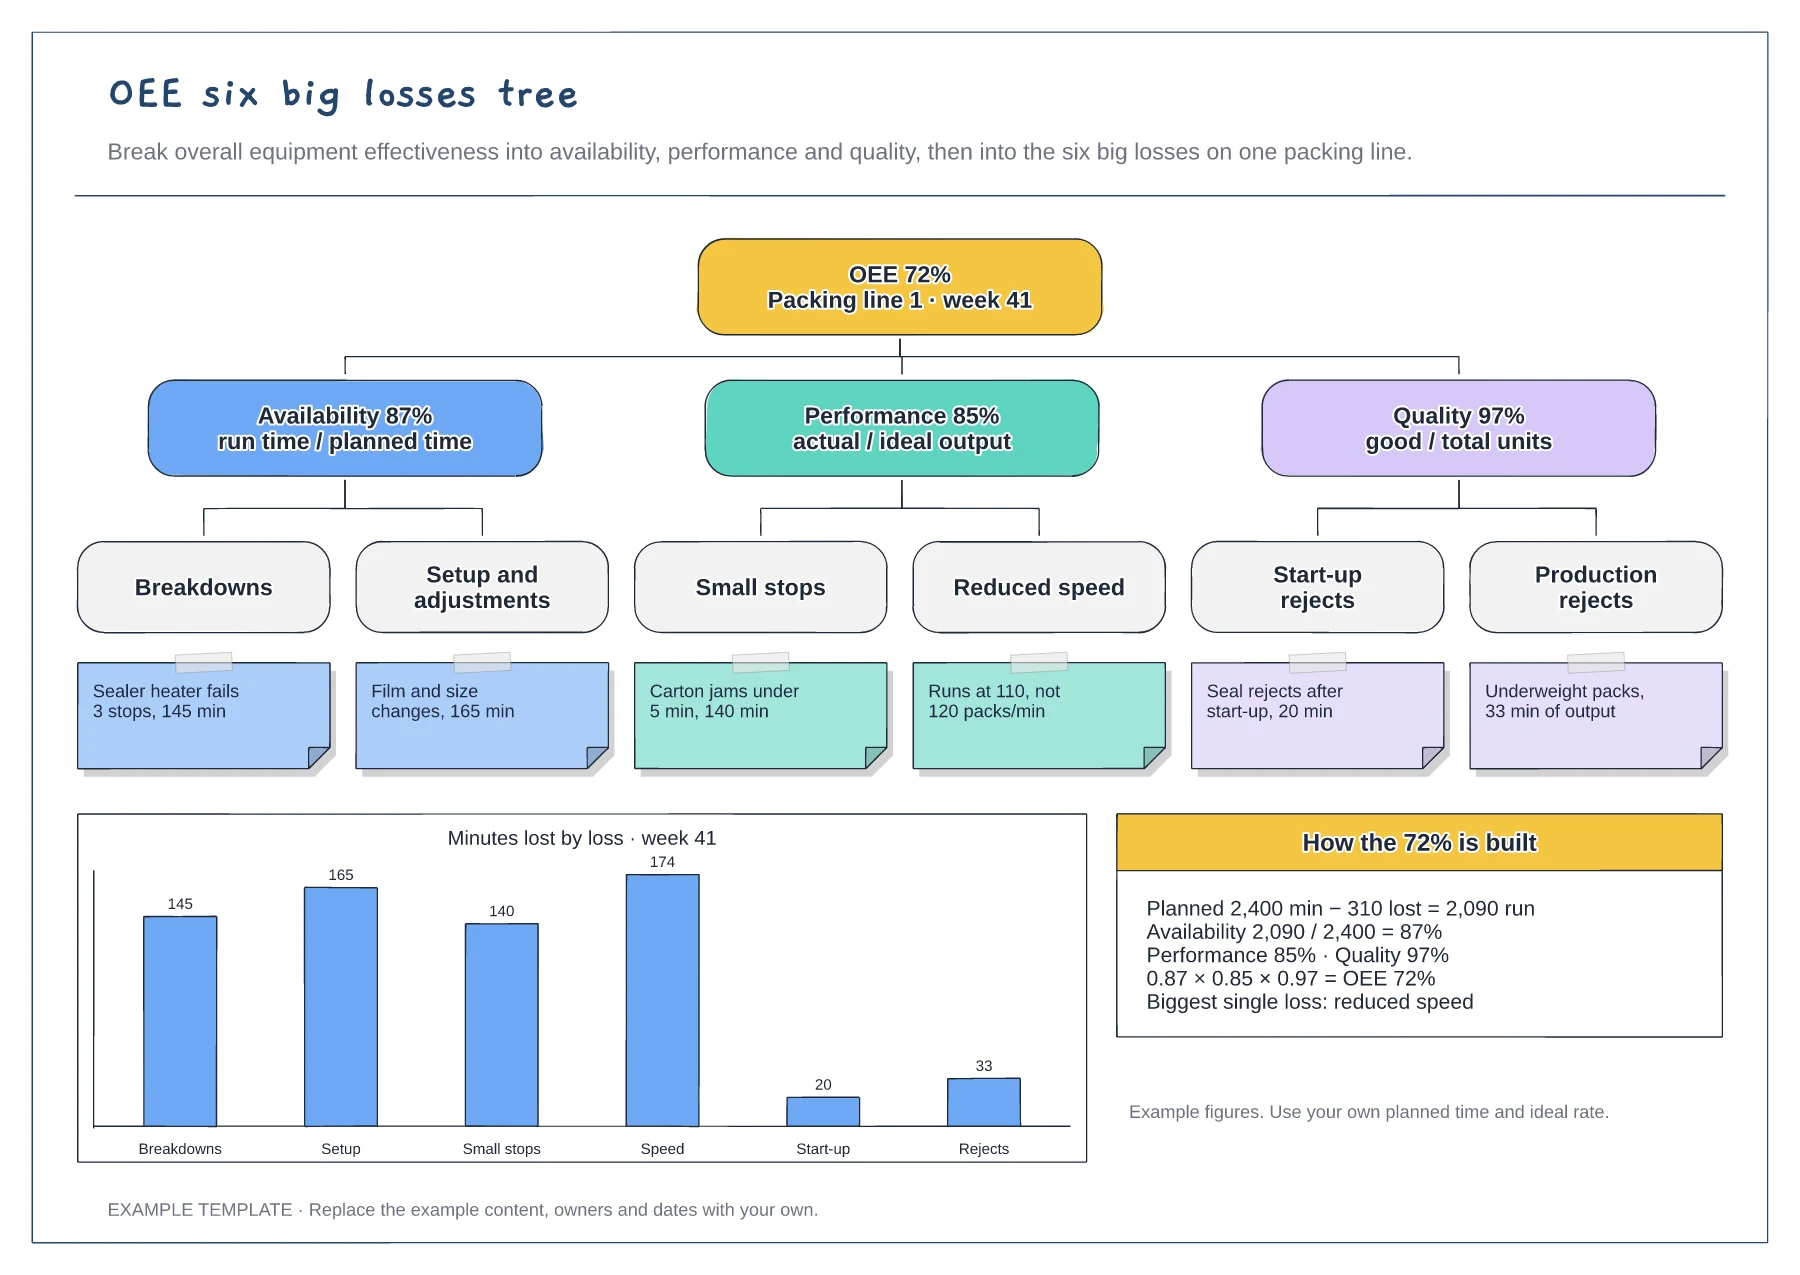
Tree from OEE to the six big losses · Example cause under each loss · Minutes-lost chart and the OEE calculation
Preview and use template →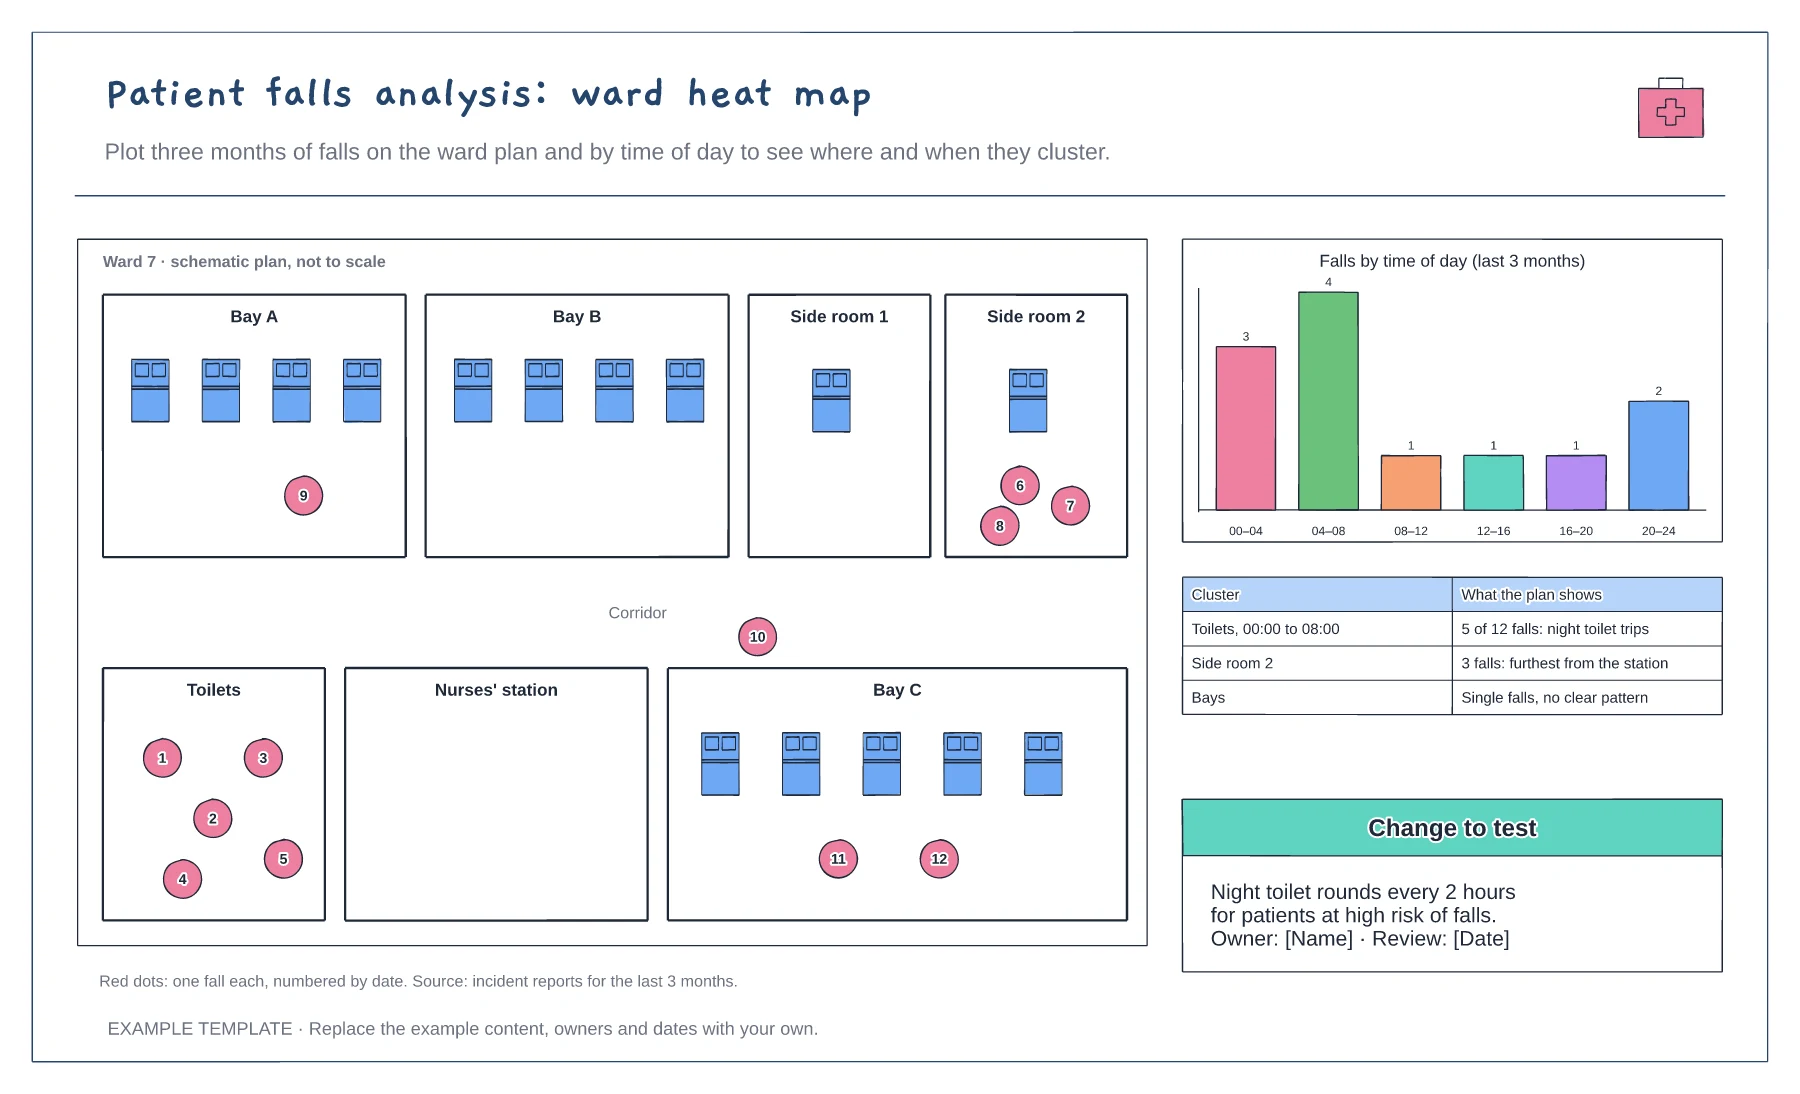
Ward plan with each fall plotted · Falls by time of day chart · Clusters and a change to test
Preview and use template →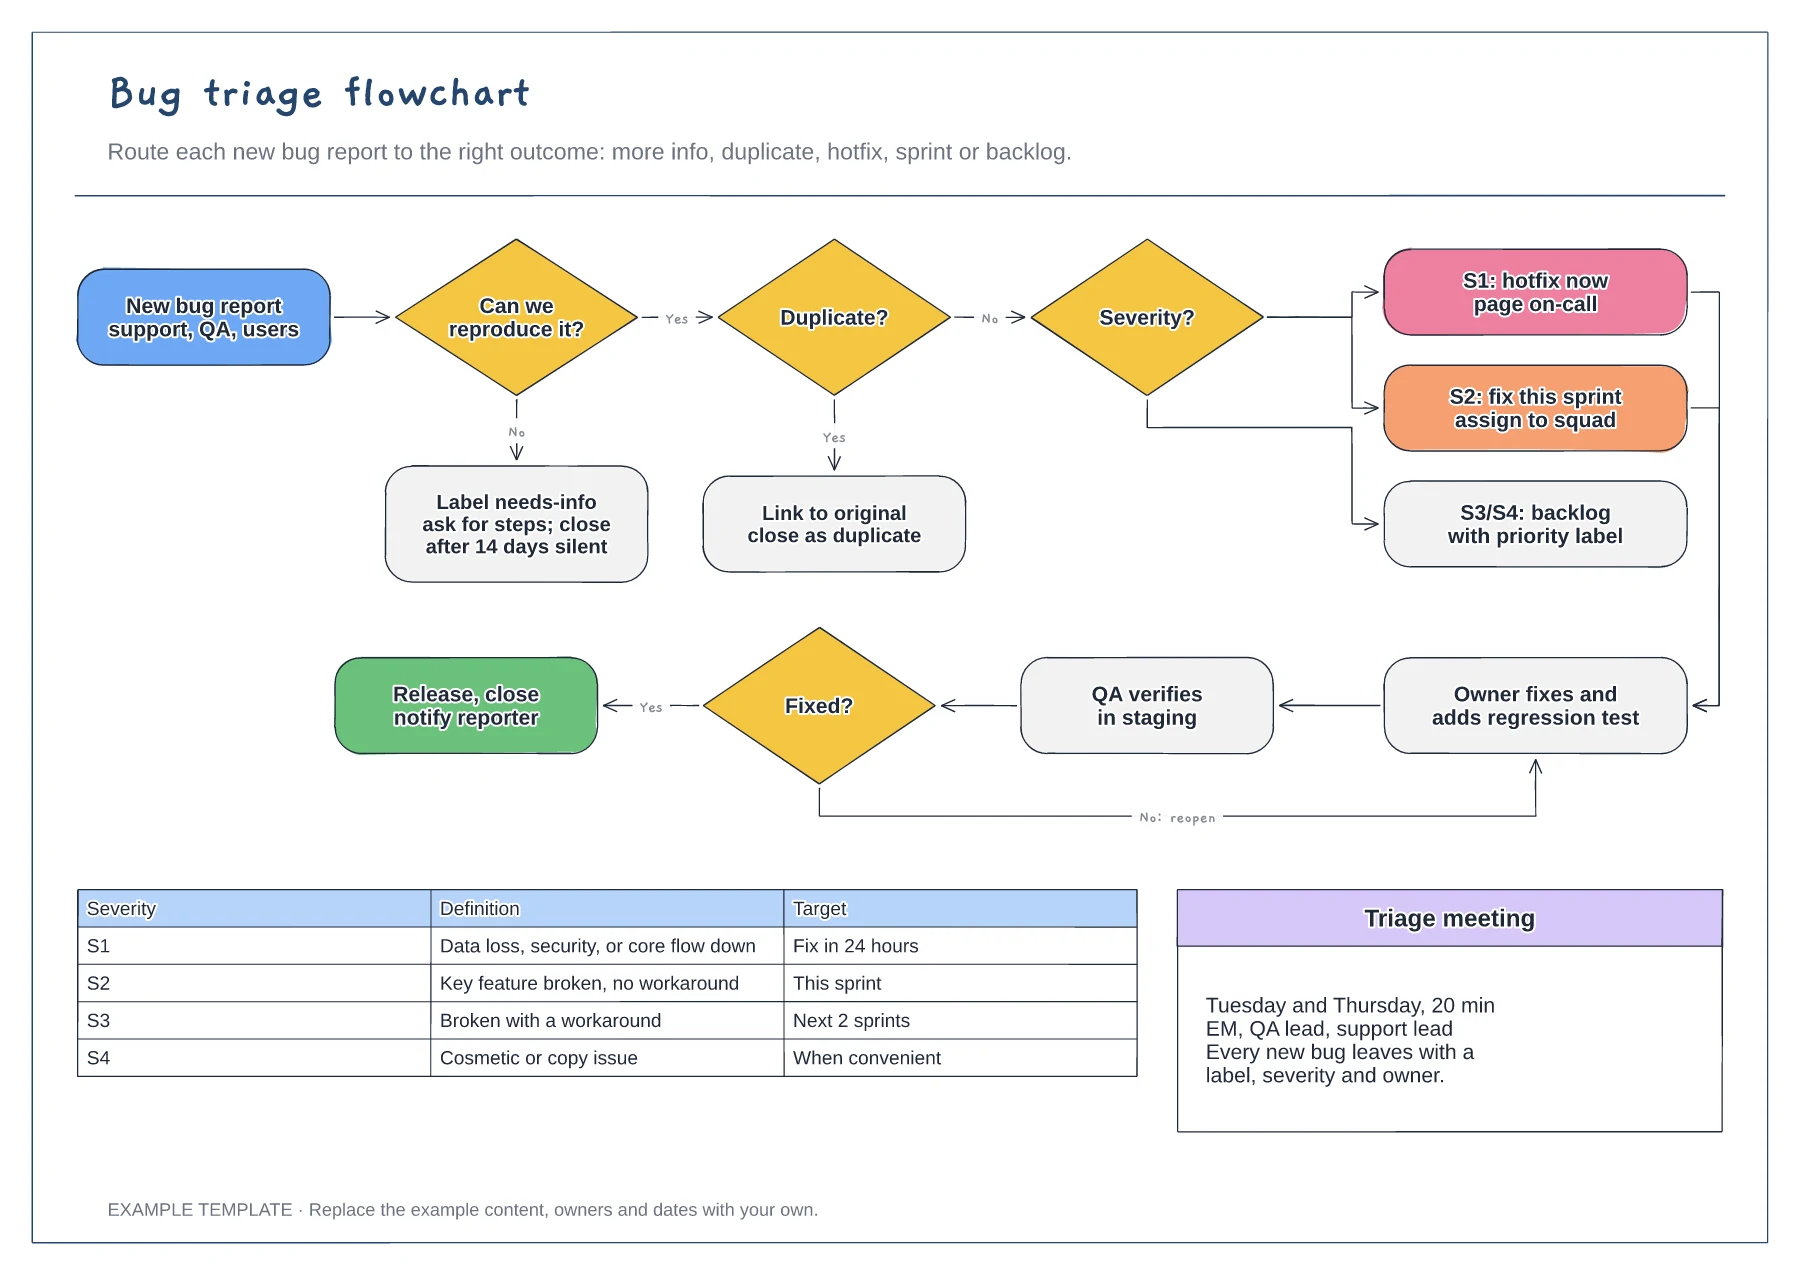
Reproduce and duplicate checks · Severity routing from S1 to S4 · Fix, verify and reopen loop with a severity table
Preview and use template →