A fishbone diagram helps a team list everything that might be causing a problem before anyone settles on a favourite explanation. You write the problem at the head of the fish, draw a bone for each category of cause, and hang the possible causes off the bones. It's also called a cause and effect diagram or an Ishikawa diagram.
A finished fishbone can look like an answer when it's still a list of guesses. This guide covers building one and then the step that often gets skipped: marking every cause as not checked, confirmed or ruled out, and writing down the evidence. The editable fishbone diagram template on this page has the same structure, ready for your own problem.
What a fishbone diagram shows
The Institute for Healthcare Improvement describes the cause and effect diagram as a tool for exploring and displaying the possible causes of an effect. The diagram has three parts, and each one has a job:
| Part | What goes there | What it does for the team |
|---|---|---|
| Head | The problem, also called the effect | Points every cause at the same thing |
| Bones | Categories of cause | Sends the team to look in places it would otherwise skip |
| Smaller branches | Possible causes, and the causes behind them | Holds each idea where the team can question it |
Both sources used in this guide call the entries on the diagram possible causes. The diagram collects candidates, and it has no way to test them. The evidence worksheet in the last section does that work.
If you are collecting ideas for a plan and have no single problem to explain, create a mind map around one question and give each idea a status.
Write a specific problem statement
To keep this concrete, the guide follows Calder Trade Supplies, a fictional distributor of plumbing parts that promises next-day delivery. The company, its people and its numbers are invented. You're the operations manager, and customer service has told you deliveries keep arriving late. Calder's customers have a simpler task than yours: they ordered a part for tomorrow's job and need it to turn up.
"Deliveries keep arriving late" won't work at the head of the fish, because nobody can check a cause against it. Late by how much, on which orders, since when? The US Centers for Medicare and Medicaid Services publishes a guide to the fishbone tool that says to be as clear and specific about the problem as you can. It also warns against defining the problem as a solution. "We need another driver" is a solution, and at the head of the fish it would shut down every bone except one.
So pull the count before the meeting. In October, Calder sent 410 next-day orders and 62 arrived a day or more late. The head of the fish reads "62 of 410 next-day orders arrived late in October". That says what happened, how often and when. It also gives you a list of 62 orders, and every later check will use that list.
Choose useful categories
The categories are prompts for the team. The CMS guide says major categories often include equipment or supplies, environment, rules and procedures, and people. IHI's classic version uses materials, methods, equipment, environment and people, and it describes a second type of diagram that uses the steps of a process as its bones. You can rename the categories to fit your problem.
Calder's problem statement is about orders moving through a warehouse and onto a van, so the bones use words the warehouse team uses: Stock, Process, Equipment and People. Carrier replaces environment, because the part of the journey Calder doesn't control is the courier's network.
Keep a category if the team can name at least one cause under it that would be missed without it. The CMS guide notes that teams won't always find a problem under every category, so a short bone is fine.
Add causes as a group
The people who do the work know causes that a manager can't see from a report, and the CMS guide says to include team members with personal knowledge of the process. Calder's session has the warehouse lead, a picker from the late shift, the transport coordinator and someone from customer service. The guide suggests going round the group with sticky notes, one cause per person per turn, until the ideas run out. That stops the first confident voice from filling the diagram.
For each cause, the guide's question is "Why does this happen?", and the answer goes on as a smaller branch. At Calder, the picker says orders that arrive after 3pm aren't released to the warehouse until the next morning. Why are customers ordering after 3pm and expecting the part tomorrow? Customer service has the answer: the checkout page promises next-day delivery on orders placed before 5pm. That goes on the diagram under the first cause, because fixing it means changing a web page, and the release time may not need to move at all.
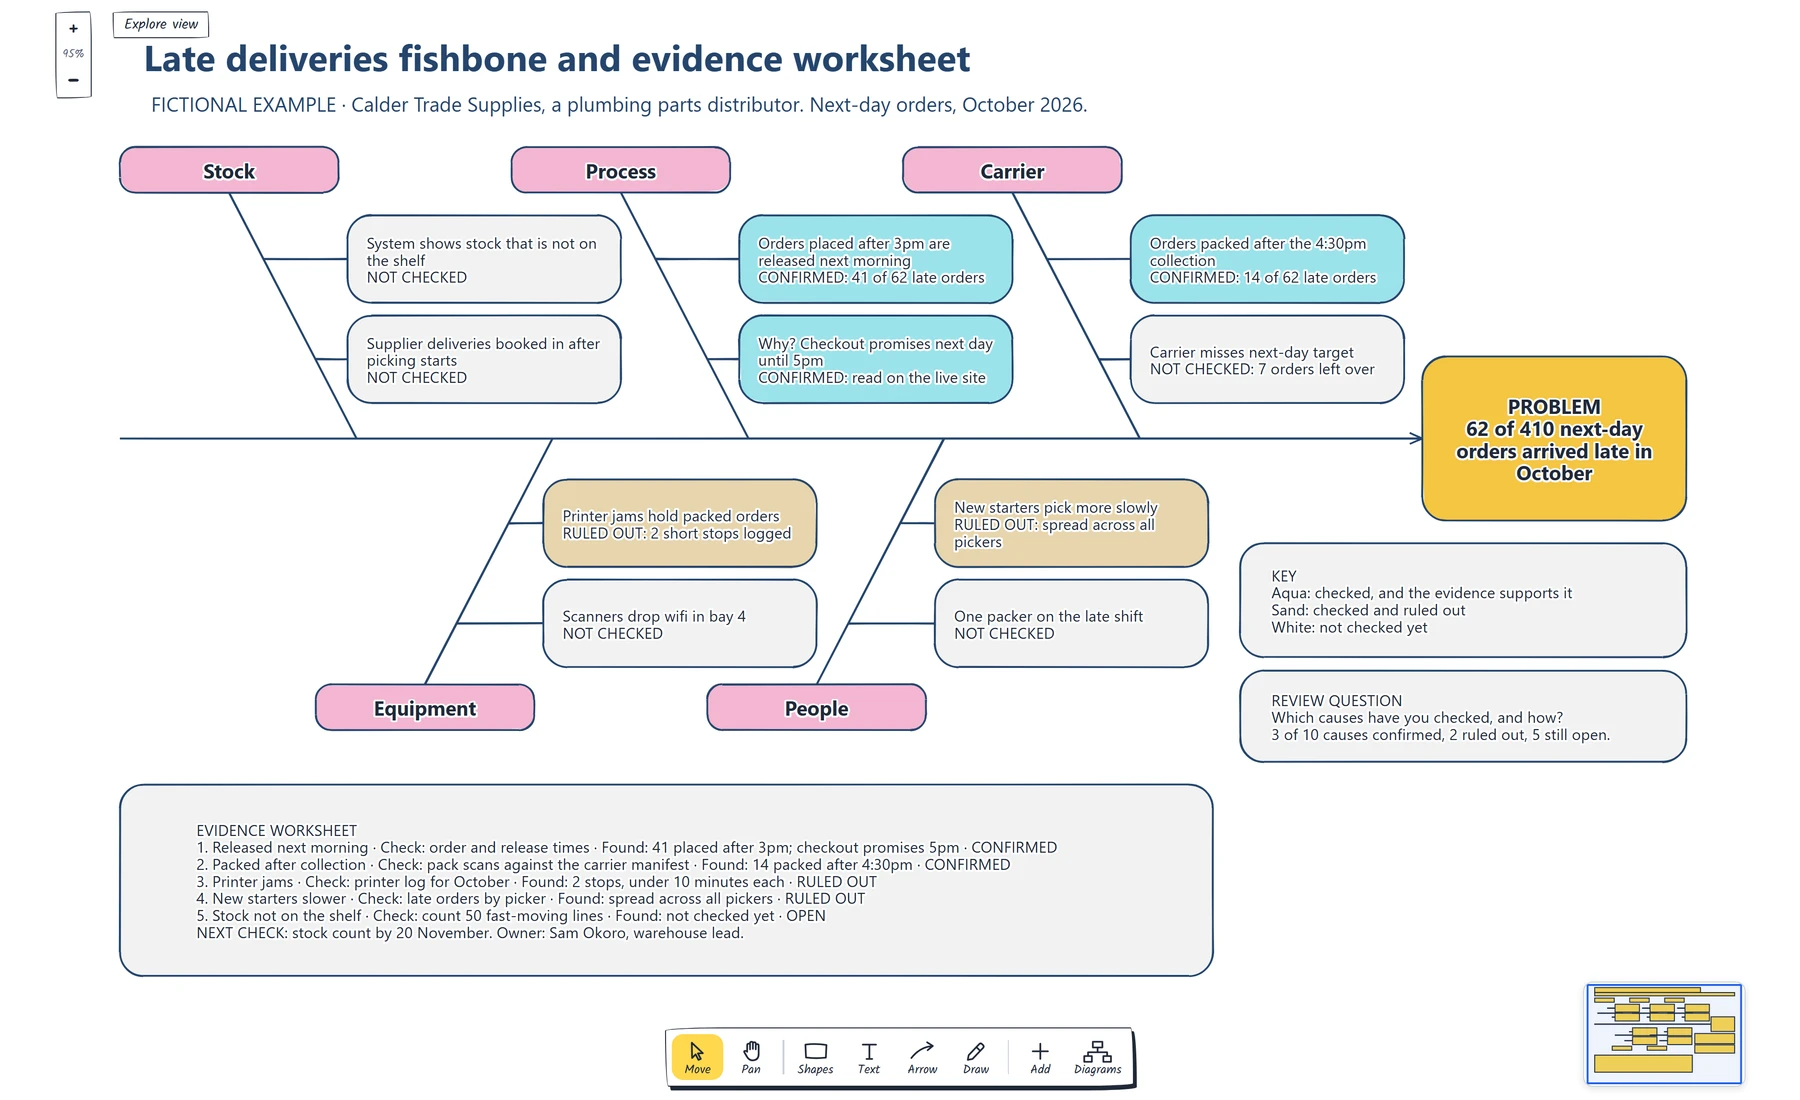
Read the status line at the bottom of each cause box. Three are confirmed with a count, two are ruled out, and five are white because nobody has looked yet.
When the session ends, every box is white: ten possible causes and no evidence. The CMS guide suggests a vote at this point, with each person marking the causes they believe are root causes. A vote is a good way to choose where to look first. Whether a cause is real is a question for the records.
Mark what to check next
For each cause, name a record or an observation that would show whether it happens and how often. Calder had data for five of its ten causes, so those came first:
- Order and release times for the 62 late orders showed that 41 were placed after 3pm. A look at the live checkout page showed the 5pm promise. Both causes are confirmed.
- Of the other 21 late orders, pack scans showed 14 were packed after the carrier's 4:30pm collection. Confirmed.
- The printer log for October showed two stoppages of under ten minutes each. Ruled out.
- Late orders were spread across all pickers, including the experienced ones. New starters are ruled out.
Each result changes the box on the diagram. A confirmed cause turns aqua, a ruled-out cause turns sand, and an unchecked cause stays white. The status is also written in the box, so the diagram still works when it's printed in black and white. Keep the ruled-out causes on the diagram. The next person who suspects the label printer can see it was checked, and how.
The worksheet under the fish holds the detail for each check: what was looked at, what was found and the status.

Check that every row with a status also has a check and a finding. A row that only says "confirmed" is still a guess.
Two confirmed causes cover 55 of Calder's 62 late orders, and they share a root: the checkout promise, the release time and the carrier collection don't agree with each other. Calder hasn't fixed anything yet. It does know where to start, that seven late orders are unexplained, and that five causes are still white. The worksheet's last line names the next check, a stock count of 50 fast-moving lines, with an owner and a date.
If your confirmed causes sit in different stages of an order's journey, the late delivery delay waterfall template breaks a late order into the hours each stage added, which helps you decide what to change first.
You can open the editable starter near the top of this page to build your own. It adds a new page and leaves your existing drawings alone. Double-click a box to change its text. When a check comes back, select the cause and choose a new Fill colour.
If a confirmed cause sits in a process nobody has drawn, make a flowchart of the main route so the team can see where each cut-off falls.
Review checklist
Copy this worksheet before you share the diagram:
Problem statement (what, how often, when):
Is it written as a problem, with no solution in it:
Where the count came from:
Categories, renamed to fit this problem:
Who was in the session, and who does the work day to day:
Causes with a "why" branch underneath:
Causes confirmed, with the check and what it found:
Causes ruled out, with the check and what it found:
Causes not checked yet:
Share of the problem the confirmed causes cover:
Next check, owner and date:
Before sharing, read every cause box and ask the question on the board: which causes have you checked, and how?
When a confirmed cause leads to a change the team wants to try, use the retrospective action guide to give that change an owner and a date to check whether it helped.
Optional: create the example with an AI assistant
If you use an AI assistant that supports remote MCP with OAuth sign-in, you can ask it to build this fishbone diagram example in your EpicDraw workspace. MCP is the connection that lets the assistant use EpicDraw's diagram tools.
This route needs a free EpicDraw account and cloud sync. Open More, choose Connect AI assistant and add https://epicdraw.app/mcp in your assistant. When EpicDraw asks you to approve the connection, allow it to create and edit diagrams. The MCP connection guide walks through each step.
Paste this prompt into the connected assistant:
Using the connected EpicDraw MCP server, create a new editable page named "Late deliveries fishbone and evidence worksheet". Leave existing pages unchanged.

Build a fictional fishbone diagram for Calder Trade Supplies, a plumbing parts distributor. Put the problem "62 of 410 next-day orders arrived late in October" in a box at the right-hand end of a horizontal spine. Add five category boxes joined to the spine by diagonal lines: Stock, Process and Carrier above it, Equipment and People below it. Give each category two possible causes in boxes, each ending with its status: NOT CHECKED, CONFIRMED with the count found, or RULED OUT with what the check showed. Under Process use "Orders placed after 3pm are released next morning" (confirmed, 41 of 62 late orders) and "Why? Checkout promises next day until 5pm" (confirmed). Under Carrier use "Orders packed after the 4:30pm collection" (confirmed, 14 of 62 late orders). Fill confirmed causes aqua, ruled-out causes sand and unchecked causes white, and add a key. Add an evidence worksheet card that lists each checked cause with the check, what was found and its status, then the next check with an owner and a date. Add the review question "Which causes have you checked, and how?".

Use editable shapes, text and lines. Label the example as fictional and mark unknowns as not checked. This is a visual planning draft. Check for overlapping objects and overflowing labels, then return a PNG preview and the private editor link. Leave the result as a draft for me to review.
Open the returned private editor link while signed in. The assistant's layout may differ from the screenshot, and it can't check anything about your operation. Replace the fictional causes and counts with your own, and leave every cause marked as not checked until someone has looked at the records.
Takeaways
- Put a counted, dated problem at the head of the fish, and keep solutions out of it.
- Rename the categories so they prompt the people who do the work.
- Ask why each cause happens and add the answer as its own branch.
- Mark every cause as not checked, confirmed or ruled out, and record the check behind each status.
- Keep ruled-out causes visible, and end with one next check that has an owner and a date.
Keep your next draft close
Create a free account to save your pages in the cloud and use them across devices.
Create a free accountYou can keep drawing without an account.