Healthcare
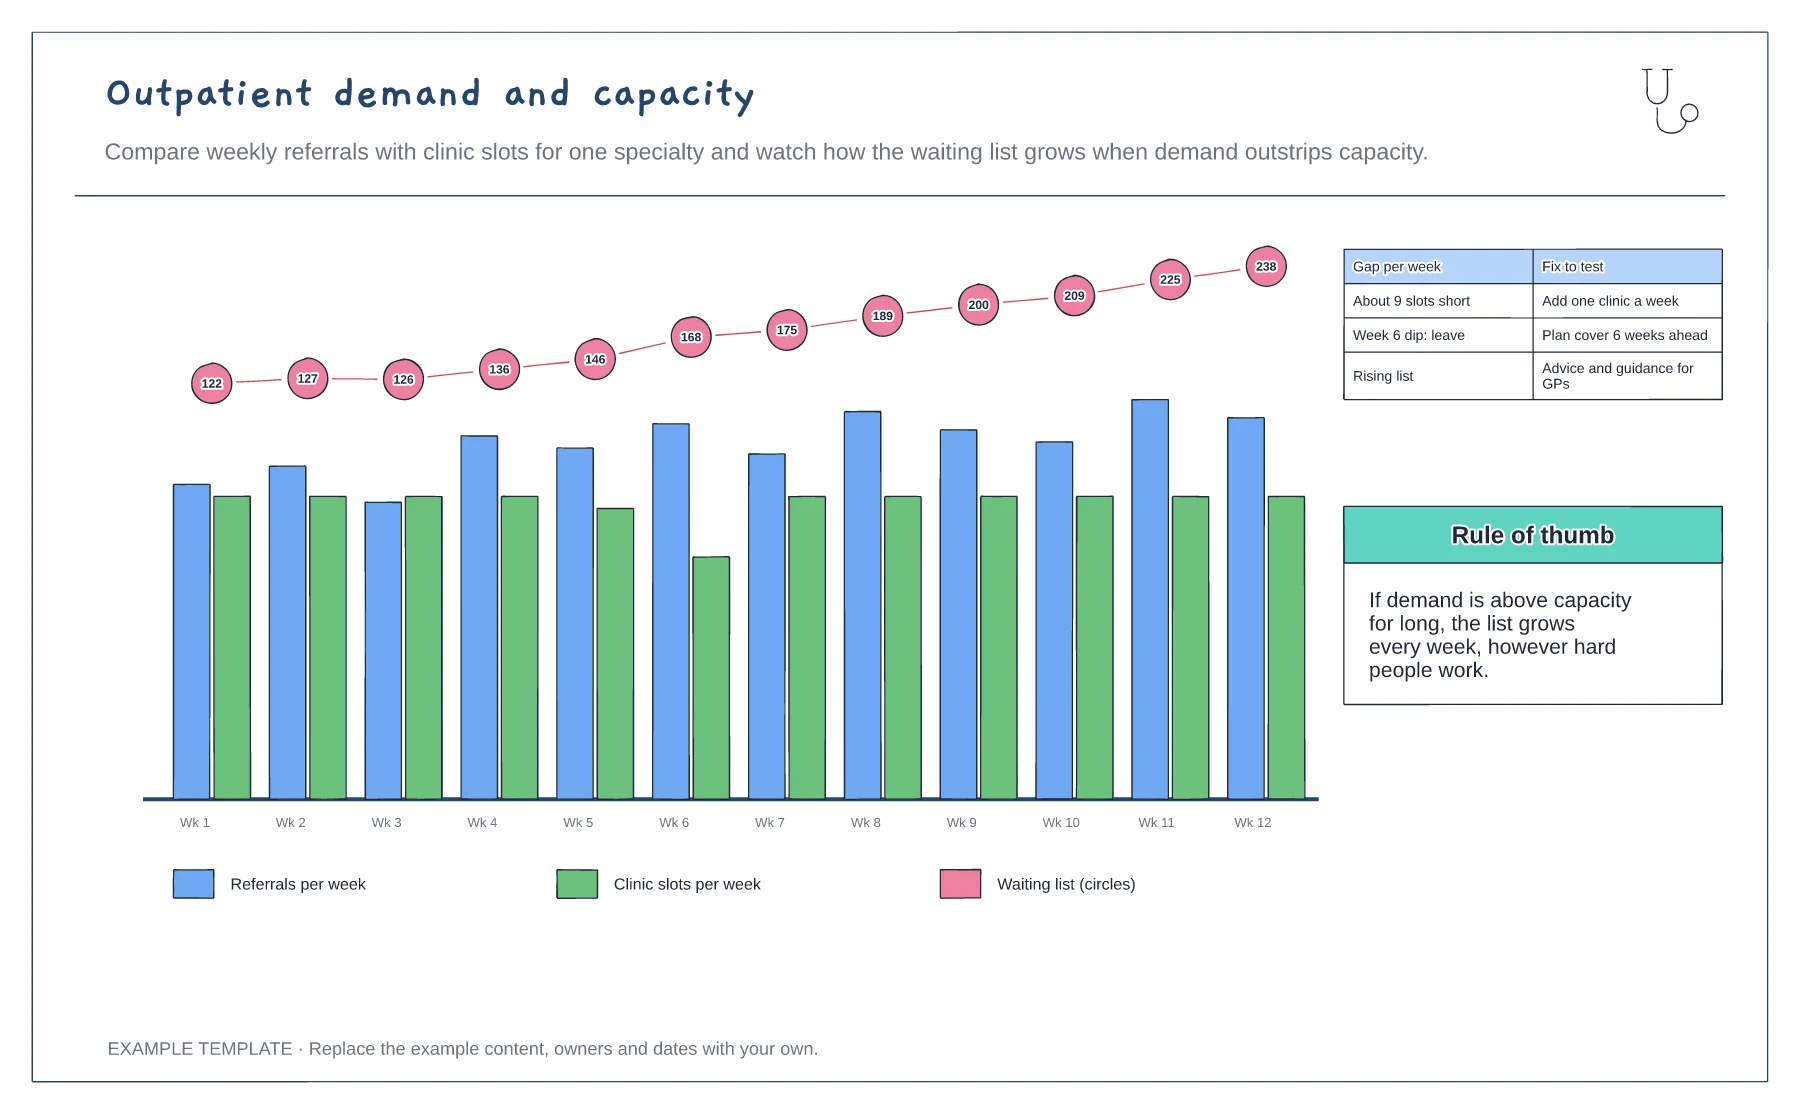
Outpatient demand and capacity template
Weekly referrals and clinic slots · Waiting list growth · Gap and fixes to test
Preview and use template →A pathway timeline shows how long a patient spends waiting compared with receiving care. This example follows one elective pathway from GP referral through triage, first appointment, scan and decision to surgery on a weeks axis, highlights the waits between steps, marks the 18-week referral-to-treatment standard and records what the patient said at each wait.
This is a planning example for process improvement, not clinical guidance. Follow your organisation's policies and clinical protocols.
No account needed · Opens as your own editable page
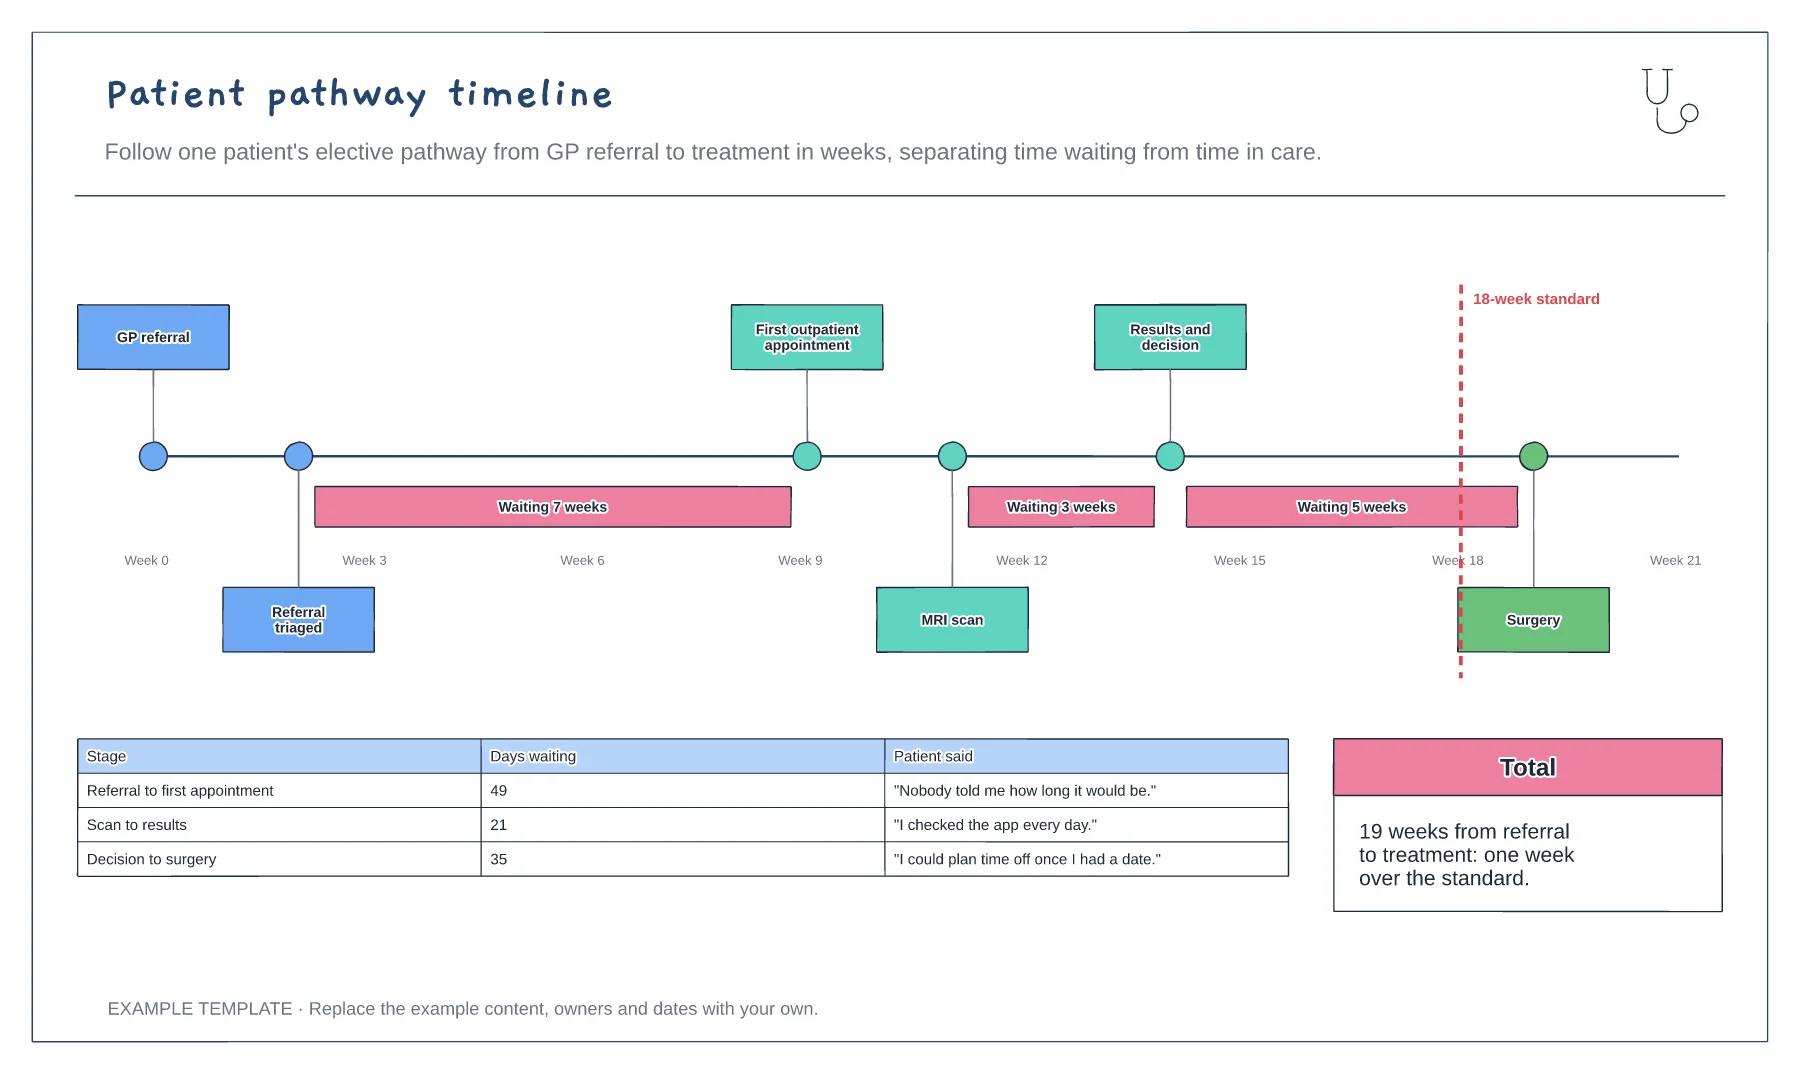
Choose a common pathway in your specialty and use real dates from a recent patient, with their consent, or typical median waits.
Mark each care step and highlight the gaps between them. The gaps are usually where most of the time goes.
Record what patients said about each wait. Use the longest and most frustrating wait as the first target.
Move each step along the weeks axis to the week it happened and resize the waits between them. Swap the 18-week line for your own target if you work to a different standard.
No. Open the template and edit it in your browser. Your work saves on this device. An account is optional if you want to sync your workspace.
Yes. Use Export in the editor to save a PNG, SVG or PDF, or download an editable .epicdraw backup.
Weekly referrals and clinic slots · Waiting list growth · Gap and fixes to test
Preview and use template →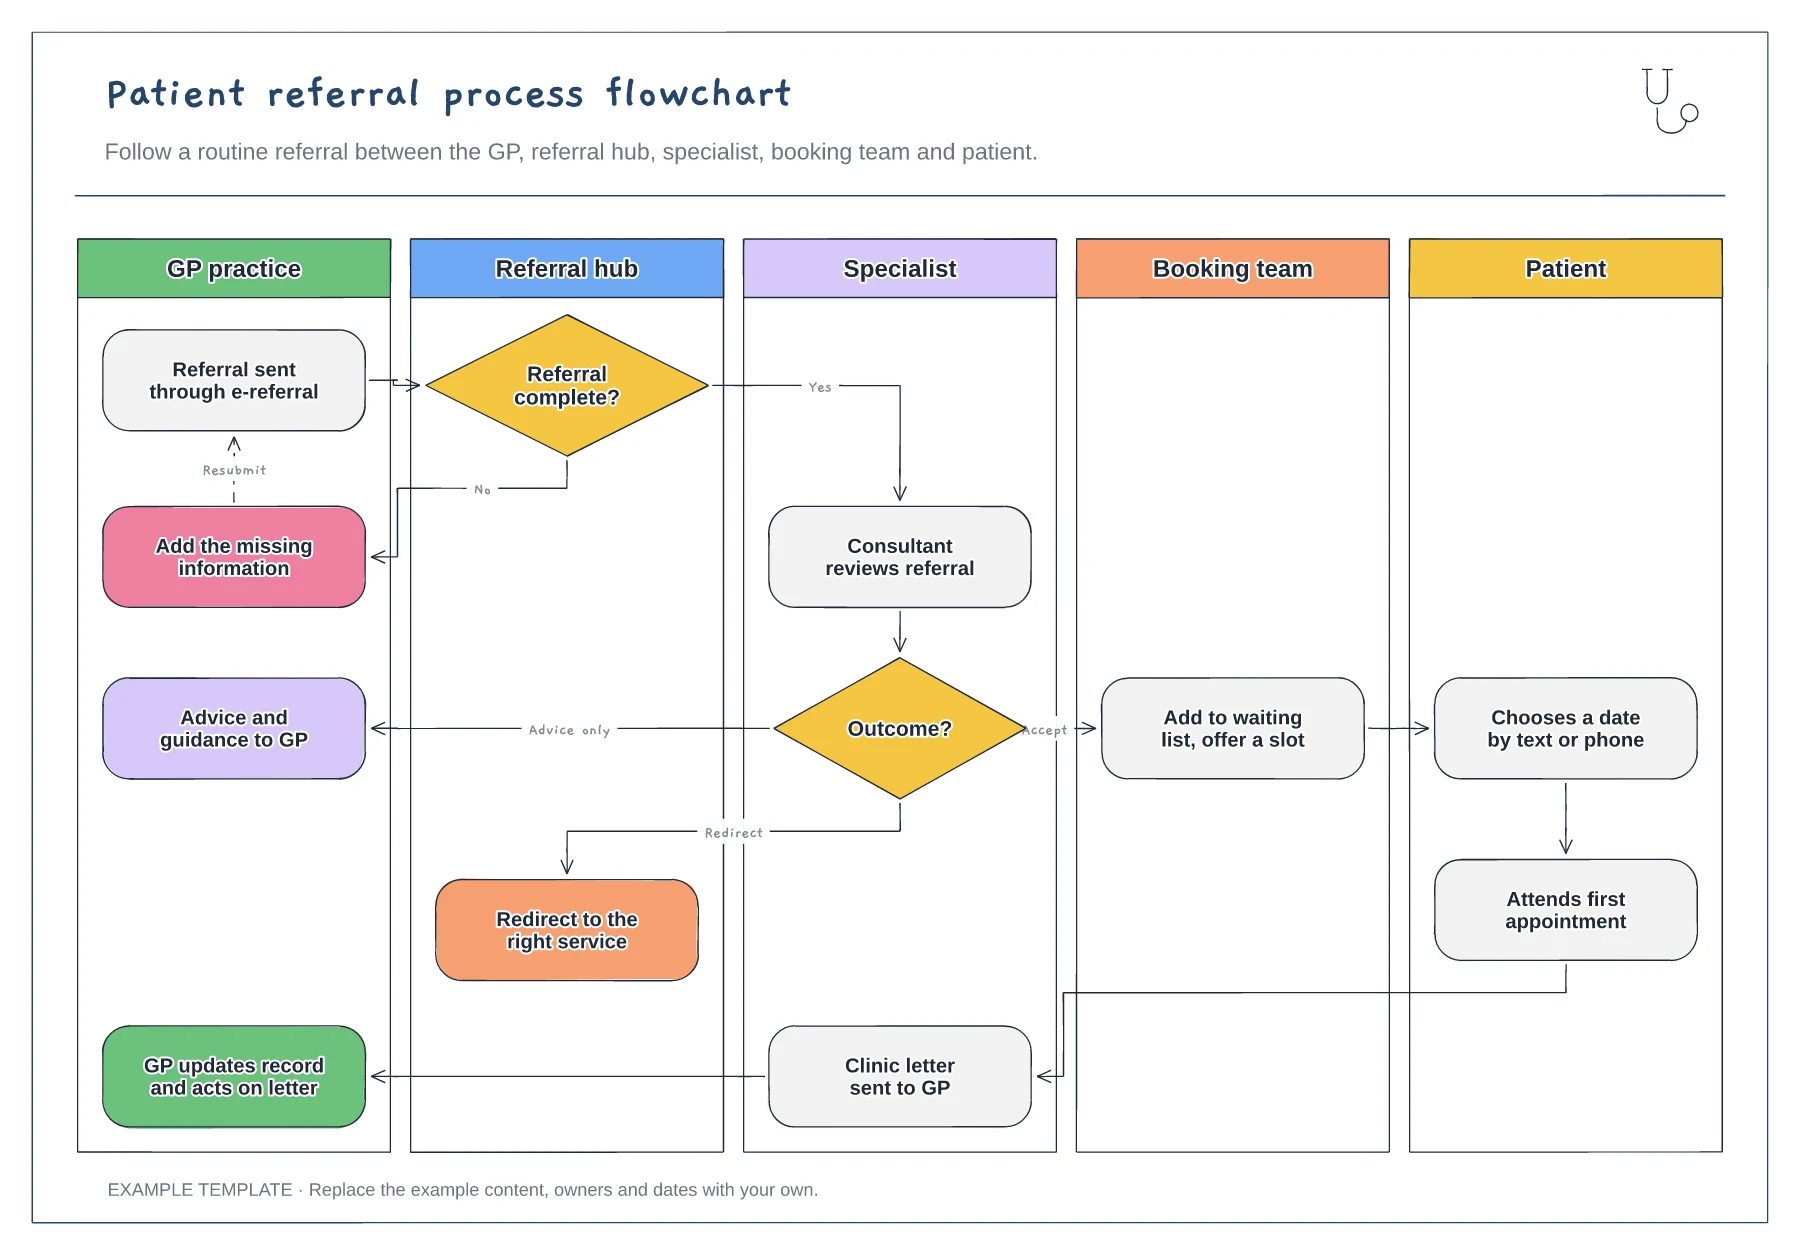
Five vertical swimlanes · Completeness check with resubmit loop · Accept, advice-only and redirect outcomes
Preview and use template →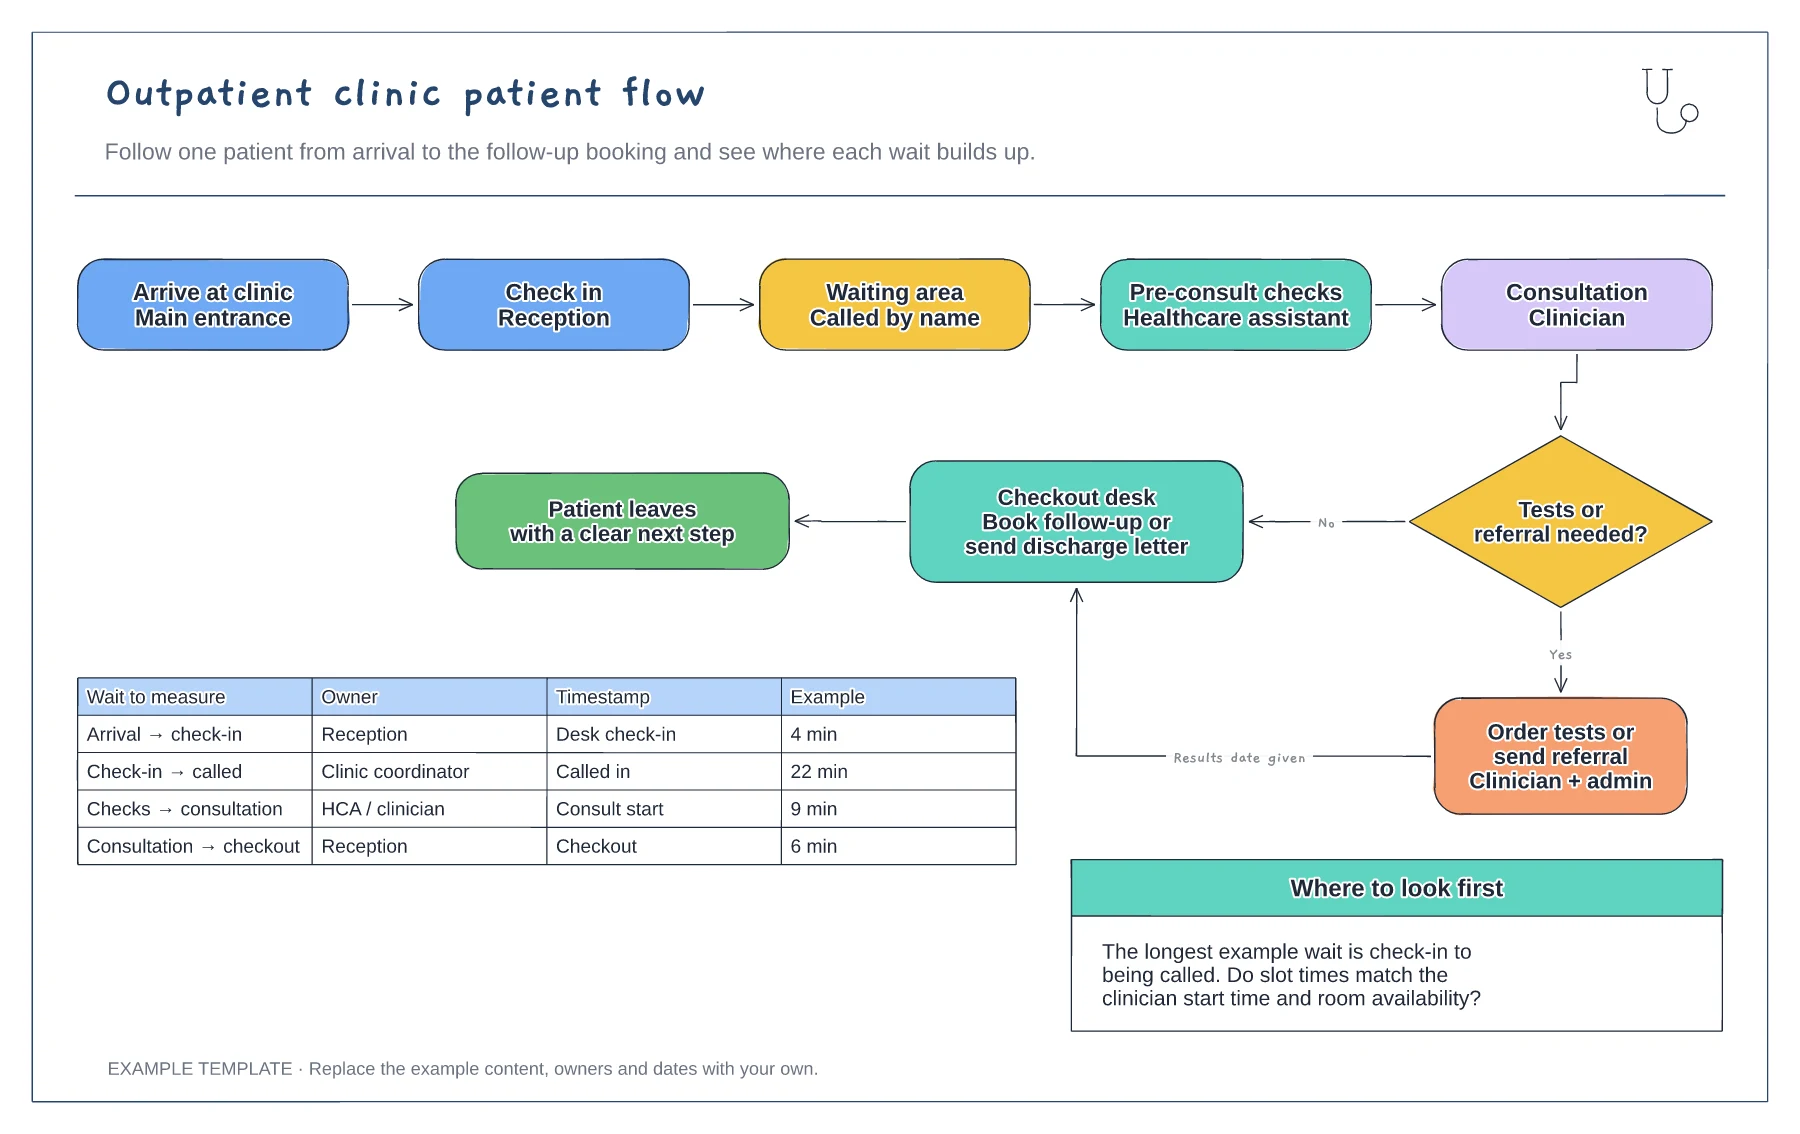
Five steps from arrival to consultation · Tests or referral decision with checkout · Wait-time table with owners and timestamps
Preview and use template →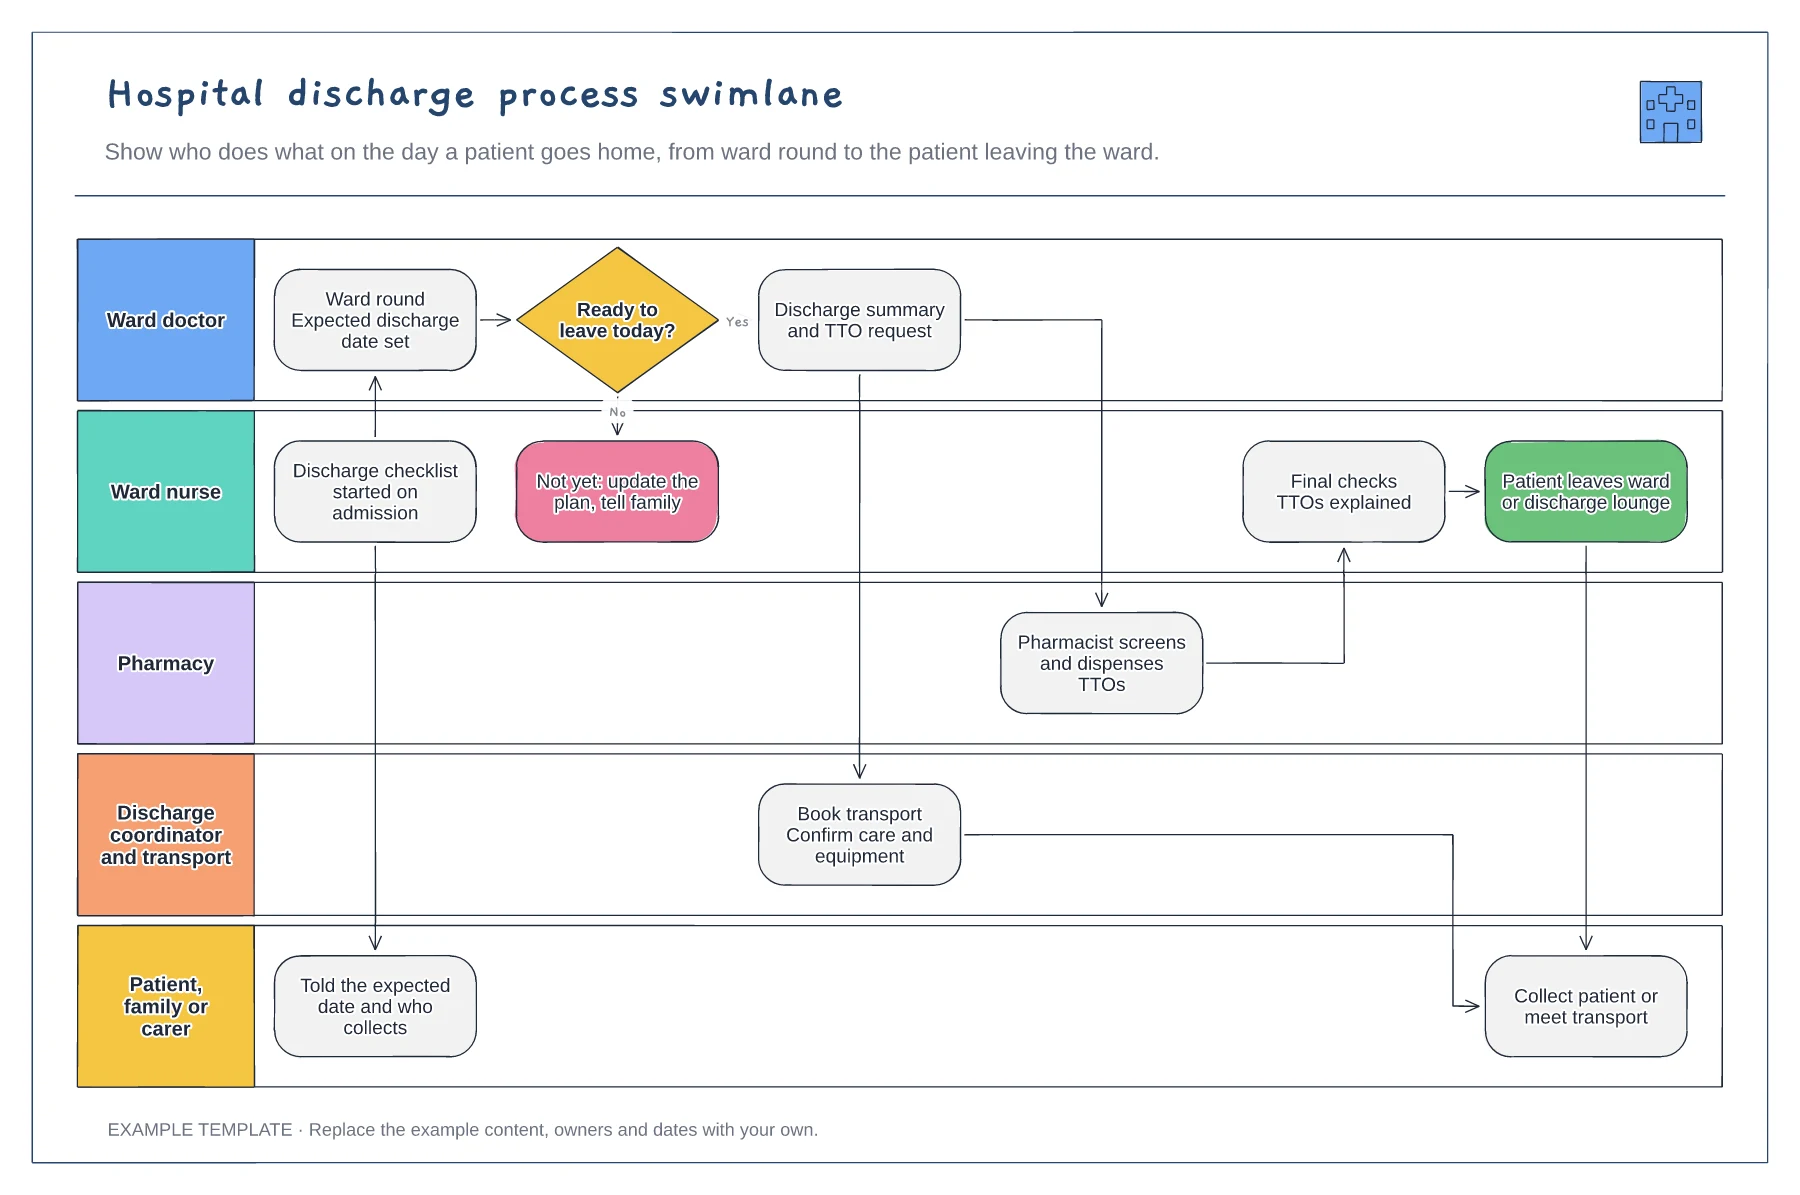
Five lanes from ward doctor to family · Ready-to-leave decision with a not-yet path · TTO, transport and final-check handovers
Preview and use template →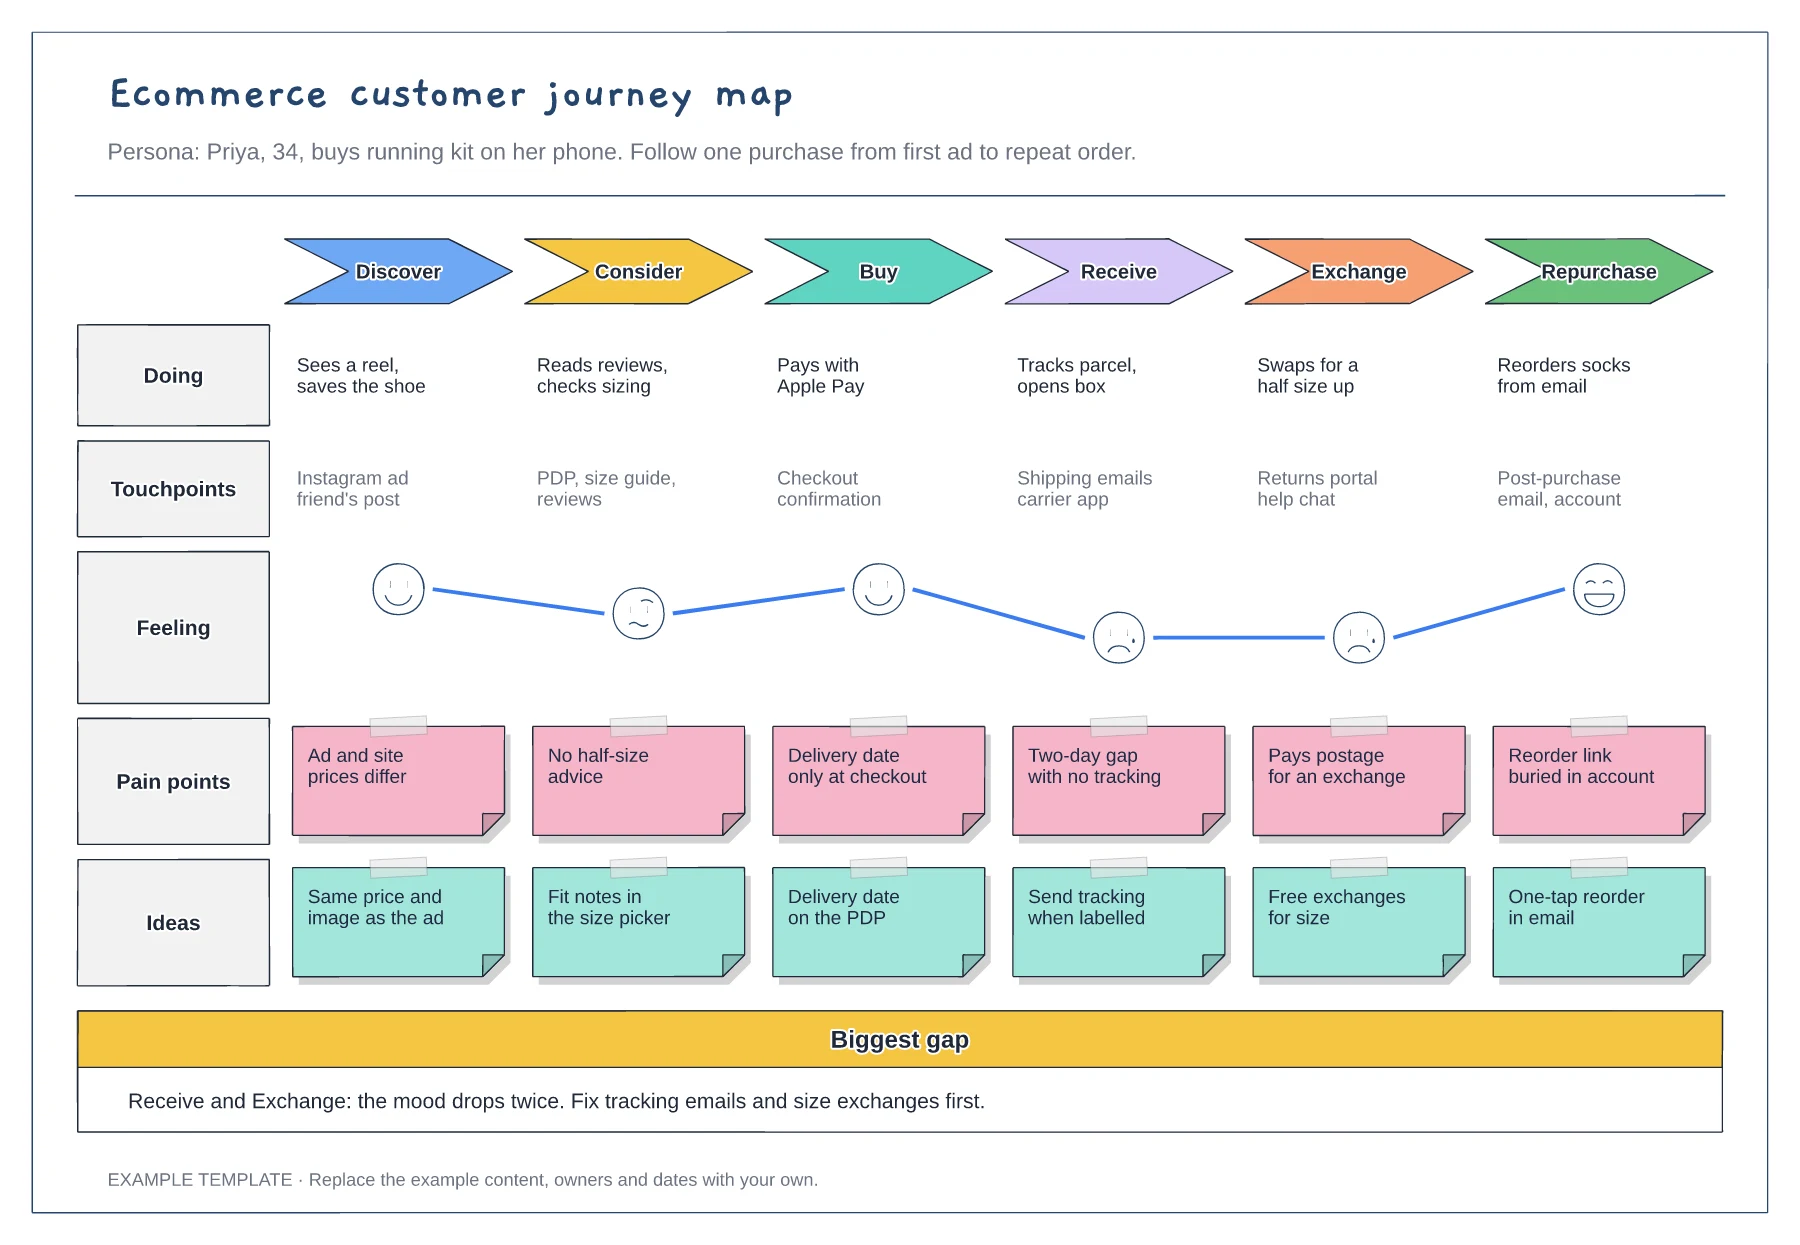
Six stages from discover to repurchase · Touchpoints and an emotion curve · Pain points paired with ideas
Preview and use template →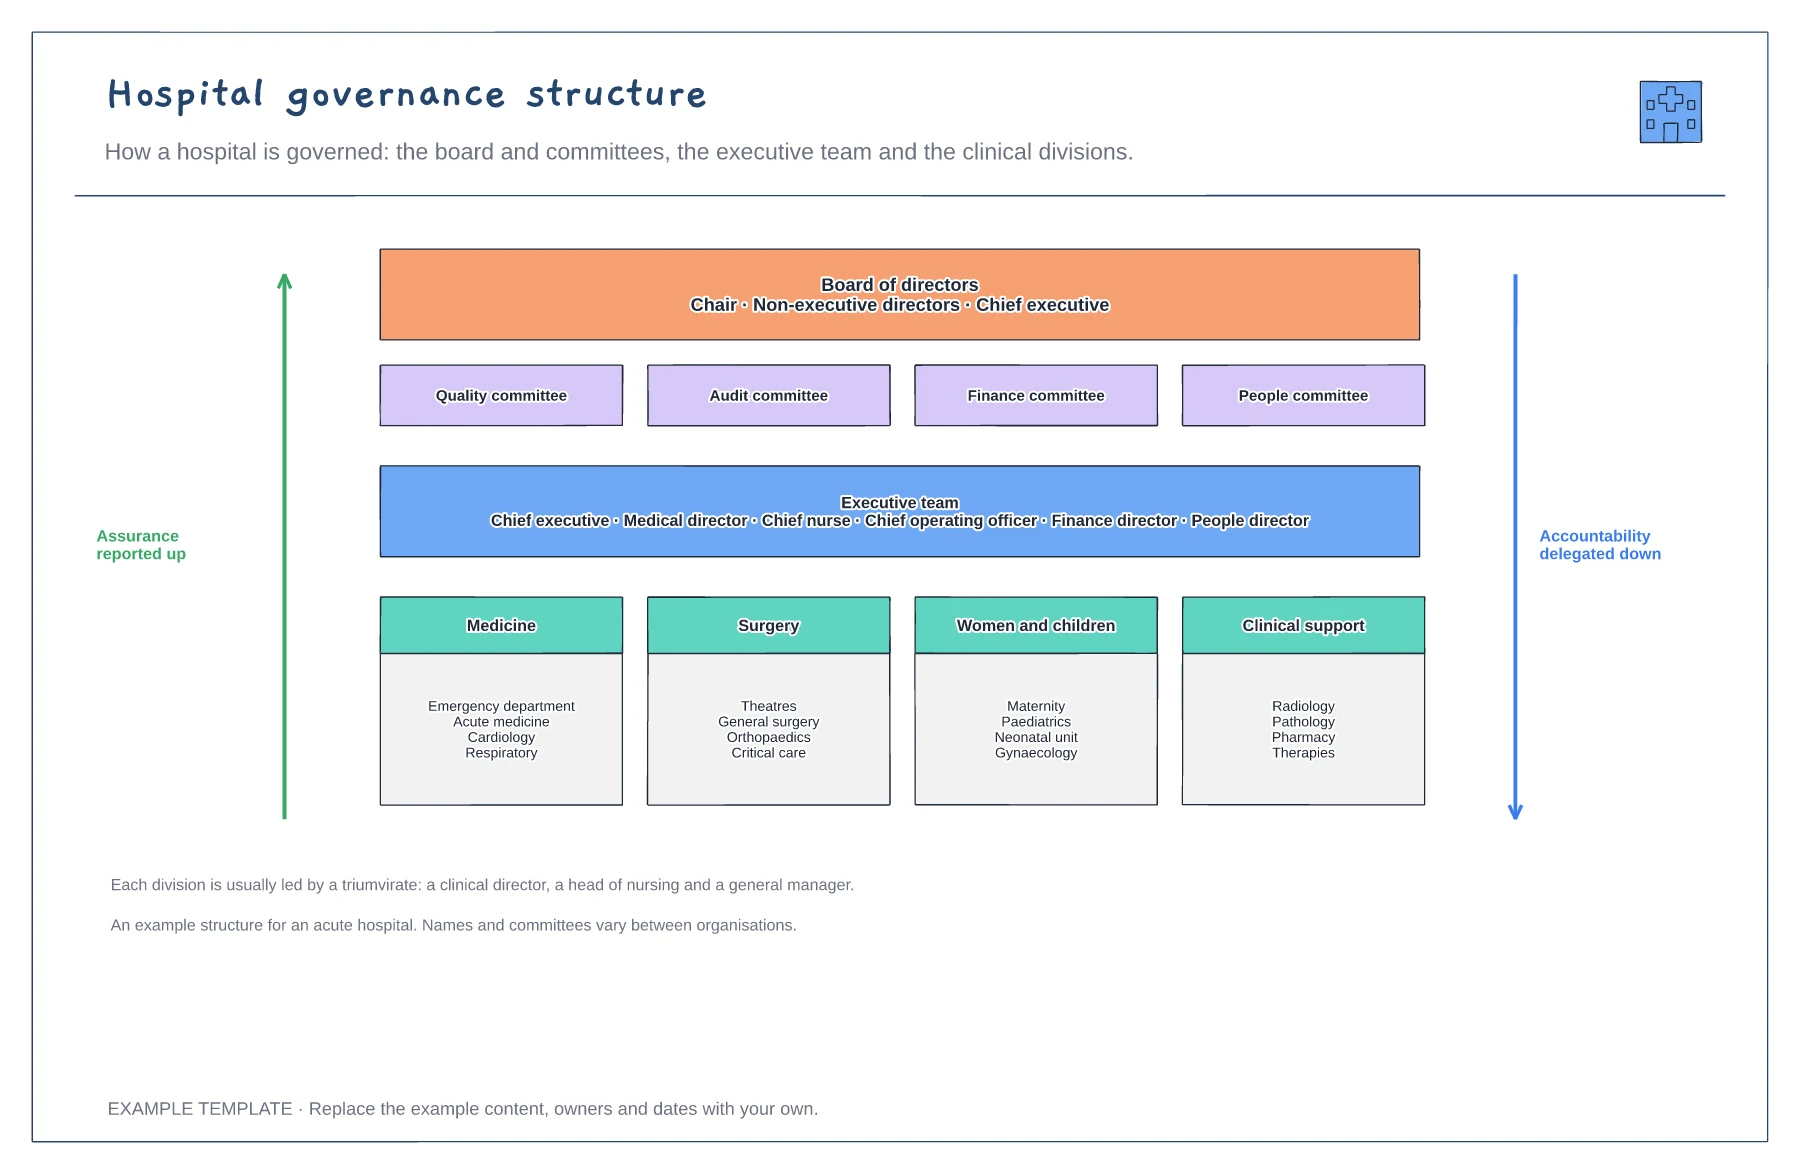
Board and four committees · Executive team · Clinical divisions and their services
Preview and use template →