Healthcare
Patient pathway timeline template
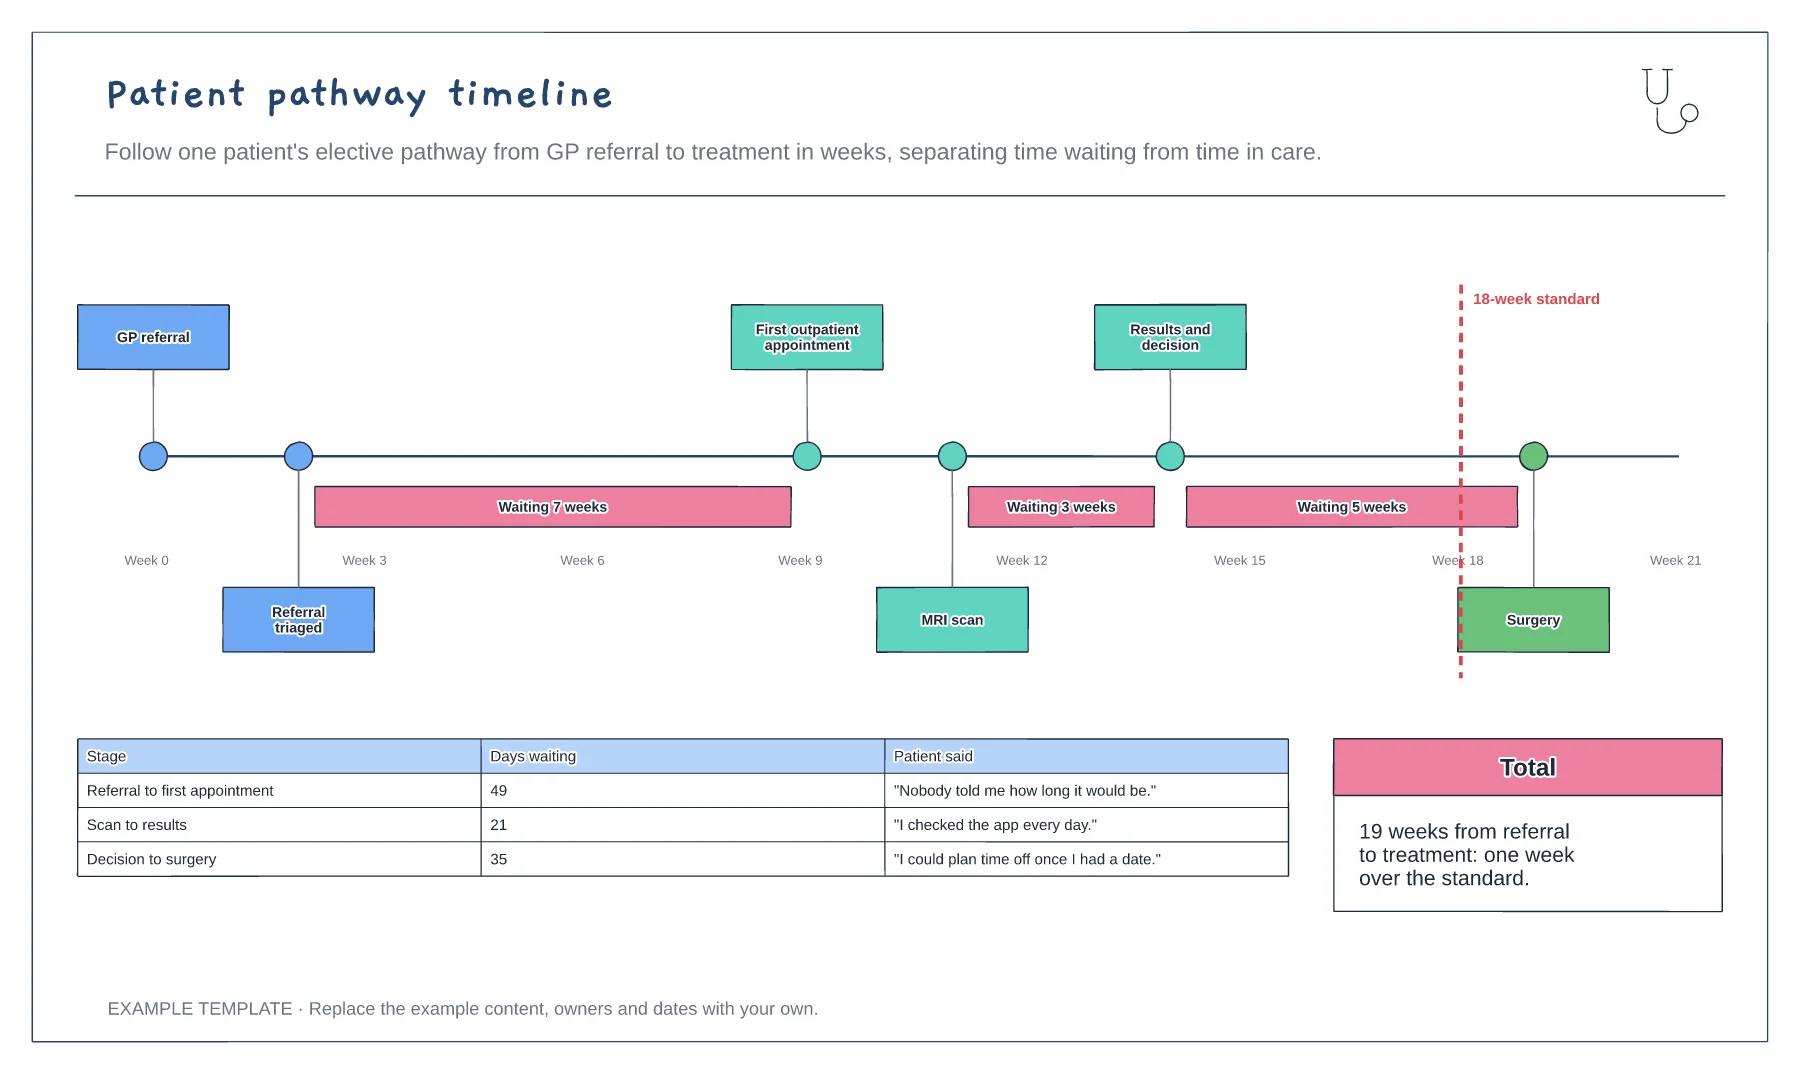
Pathway steps on a weeks axis · Waits highlighted between steps · 18-week standard and patient comments
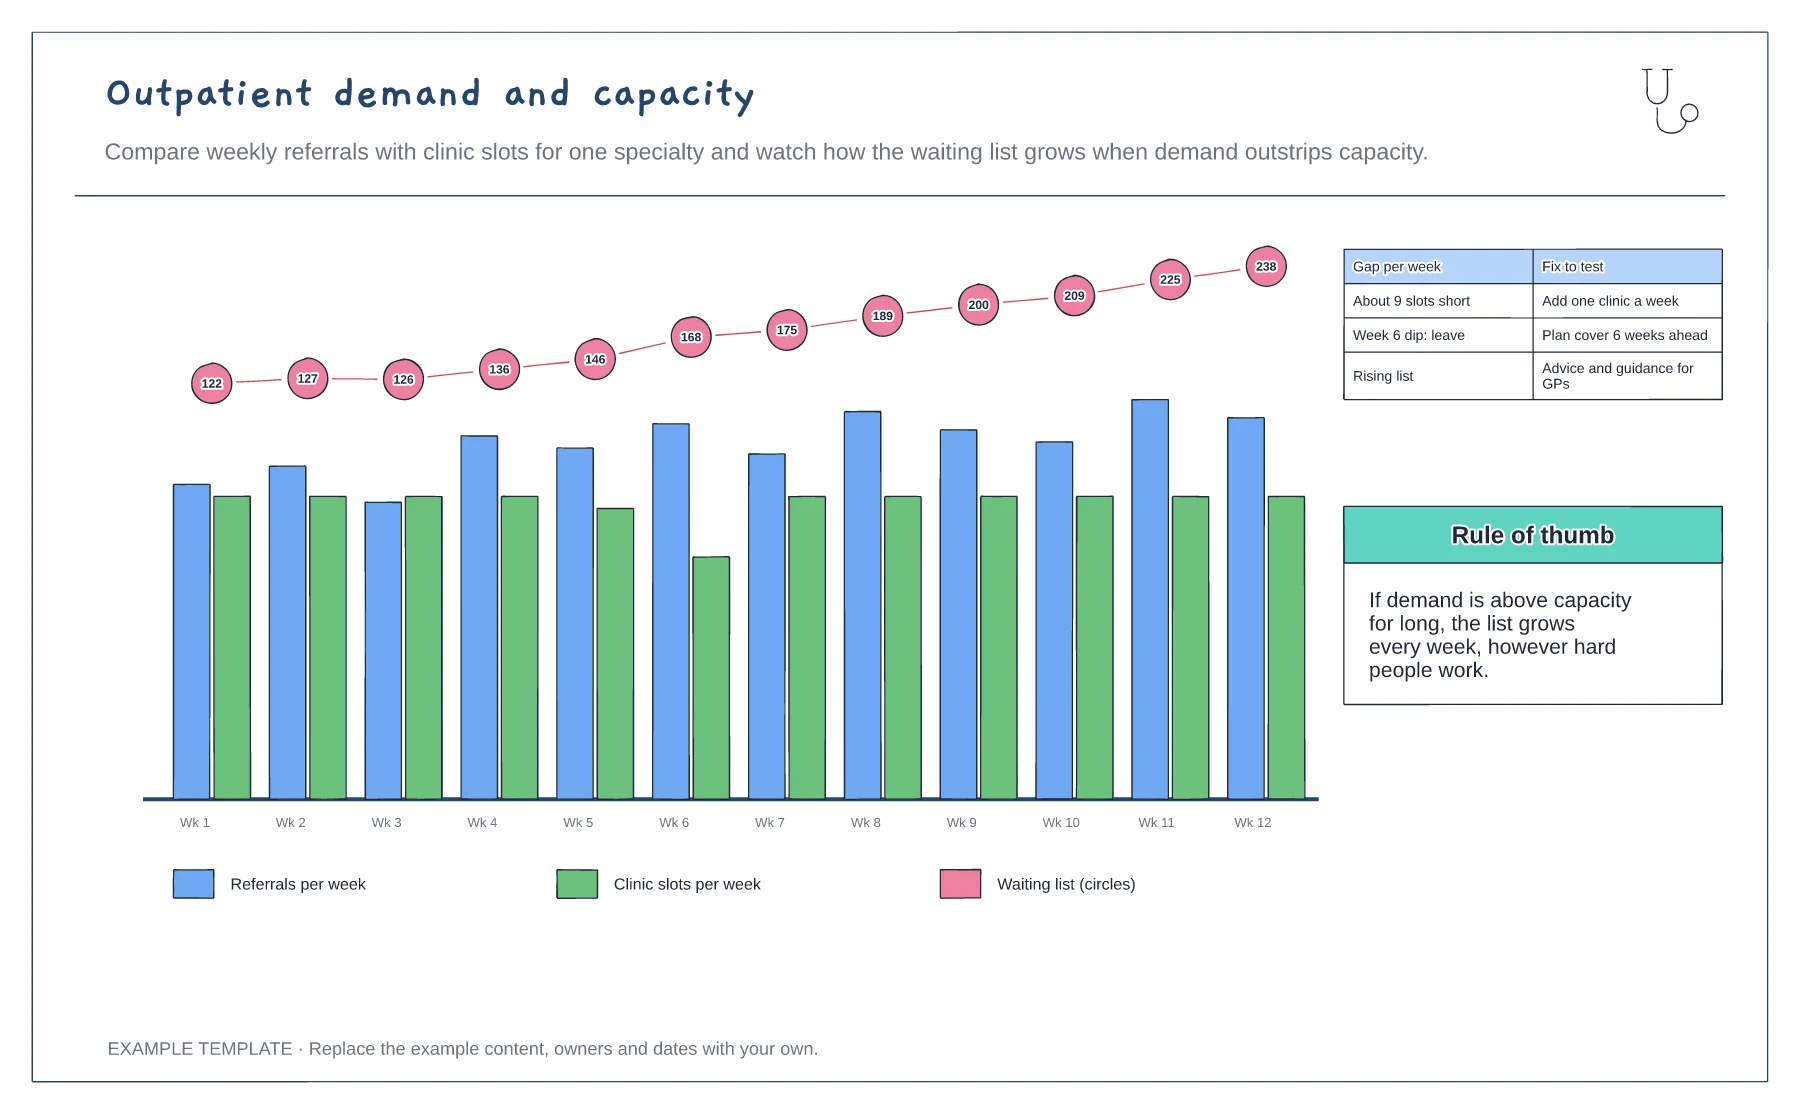
Preview and use template →When demand is above capacity, a waiting list grows every week however hard the team works. This chart compares weekly referrals with clinic slots for one specialty over twelve weeks, shows the waiting list rising as a line of counts, and lists the gap and the fixes to test, from an extra clinic to advice and guidance for GPs.
This is a planning example for process improvement, not clinical guidance. Follow your organisation's policies and clinical protocols.
No account needed · Opens as your own editable page
Pull weekly referrals and the clinic slots actually delivered, not those planned, for the last few months.
Put demand and capacity side by side for each week and track the waiting list. The gap explains the trend.
Test ways to add capacity or reduce demand, such as an extra clinic, a nurse-led clinic or advice and guidance.
Yes. Rename the specialty and replace the weekly referrals and clinic slots with your own figures; the waiting list line then shows whether the gap grows or closes.
No. Open the template and edit it in your browser. Your work saves on this device. An account is optional if you want to sync your workspace.
Yes. Use Export in the editor to save a PNG, SVG or PDF, or download an editable .epicdraw backup.
Pathway steps on a weeks axis · Waits highlighted between steps · 18-week standard and patient comments
Preview and use template →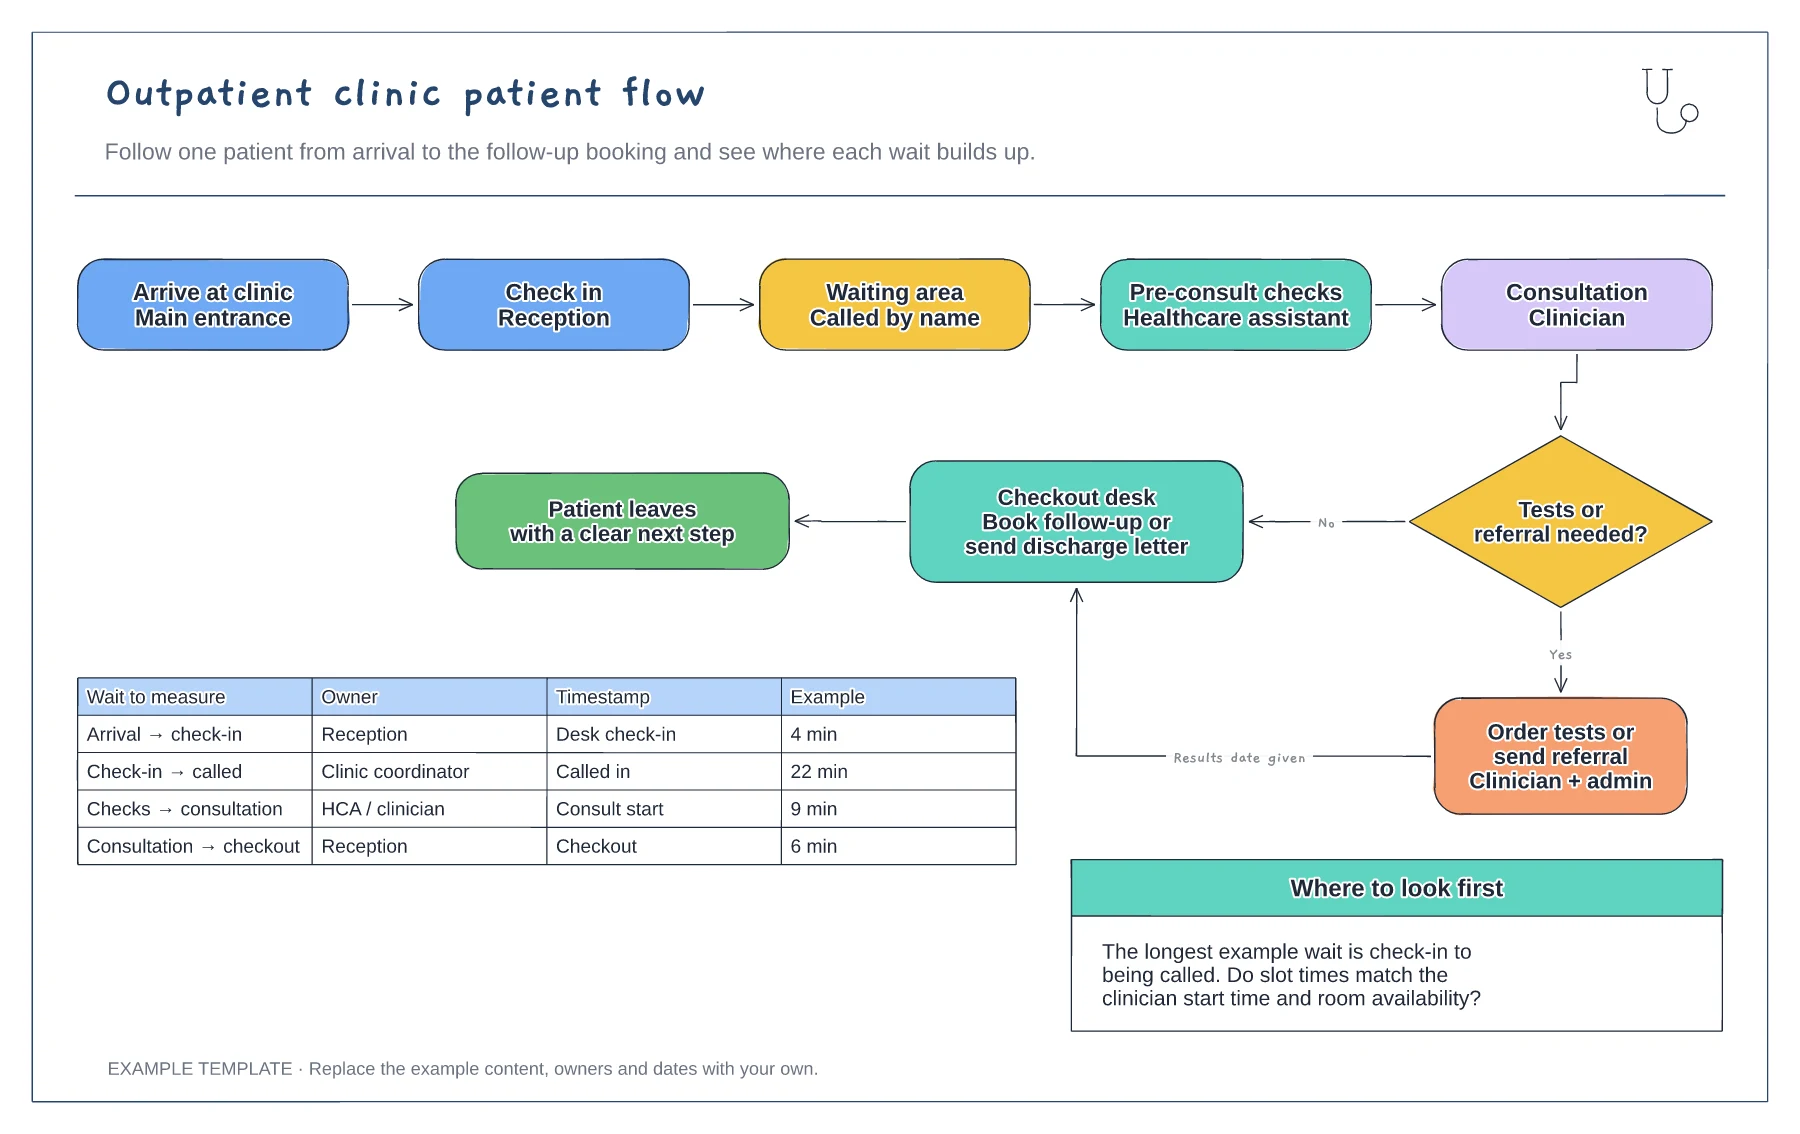
Five steps from arrival to consultation · Tests or referral decision with checkout · Wait-time table with owners and timestamps
Preview and use template →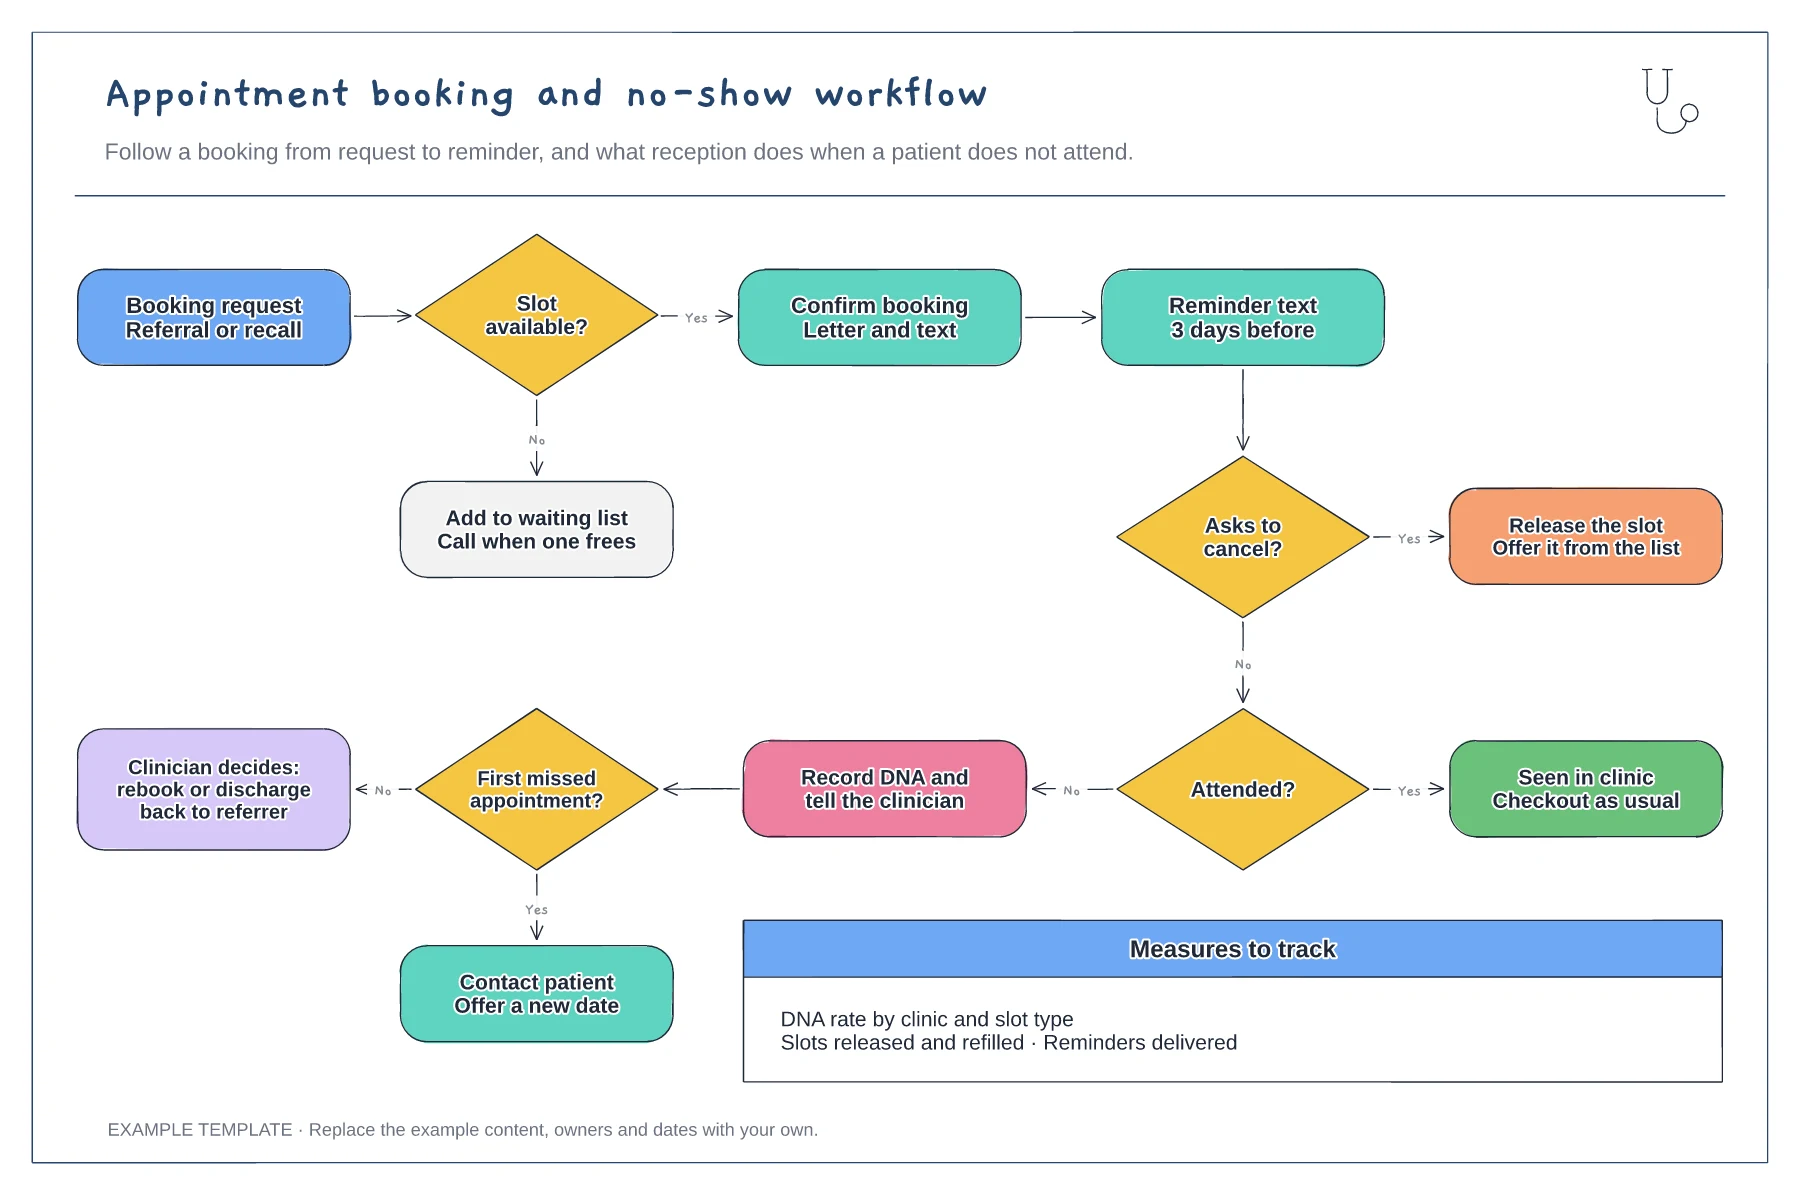
Booking, confirmation and reminder steps · Cancellation route that refills the slot · DNA route with rebook or discharge
Preview and use template →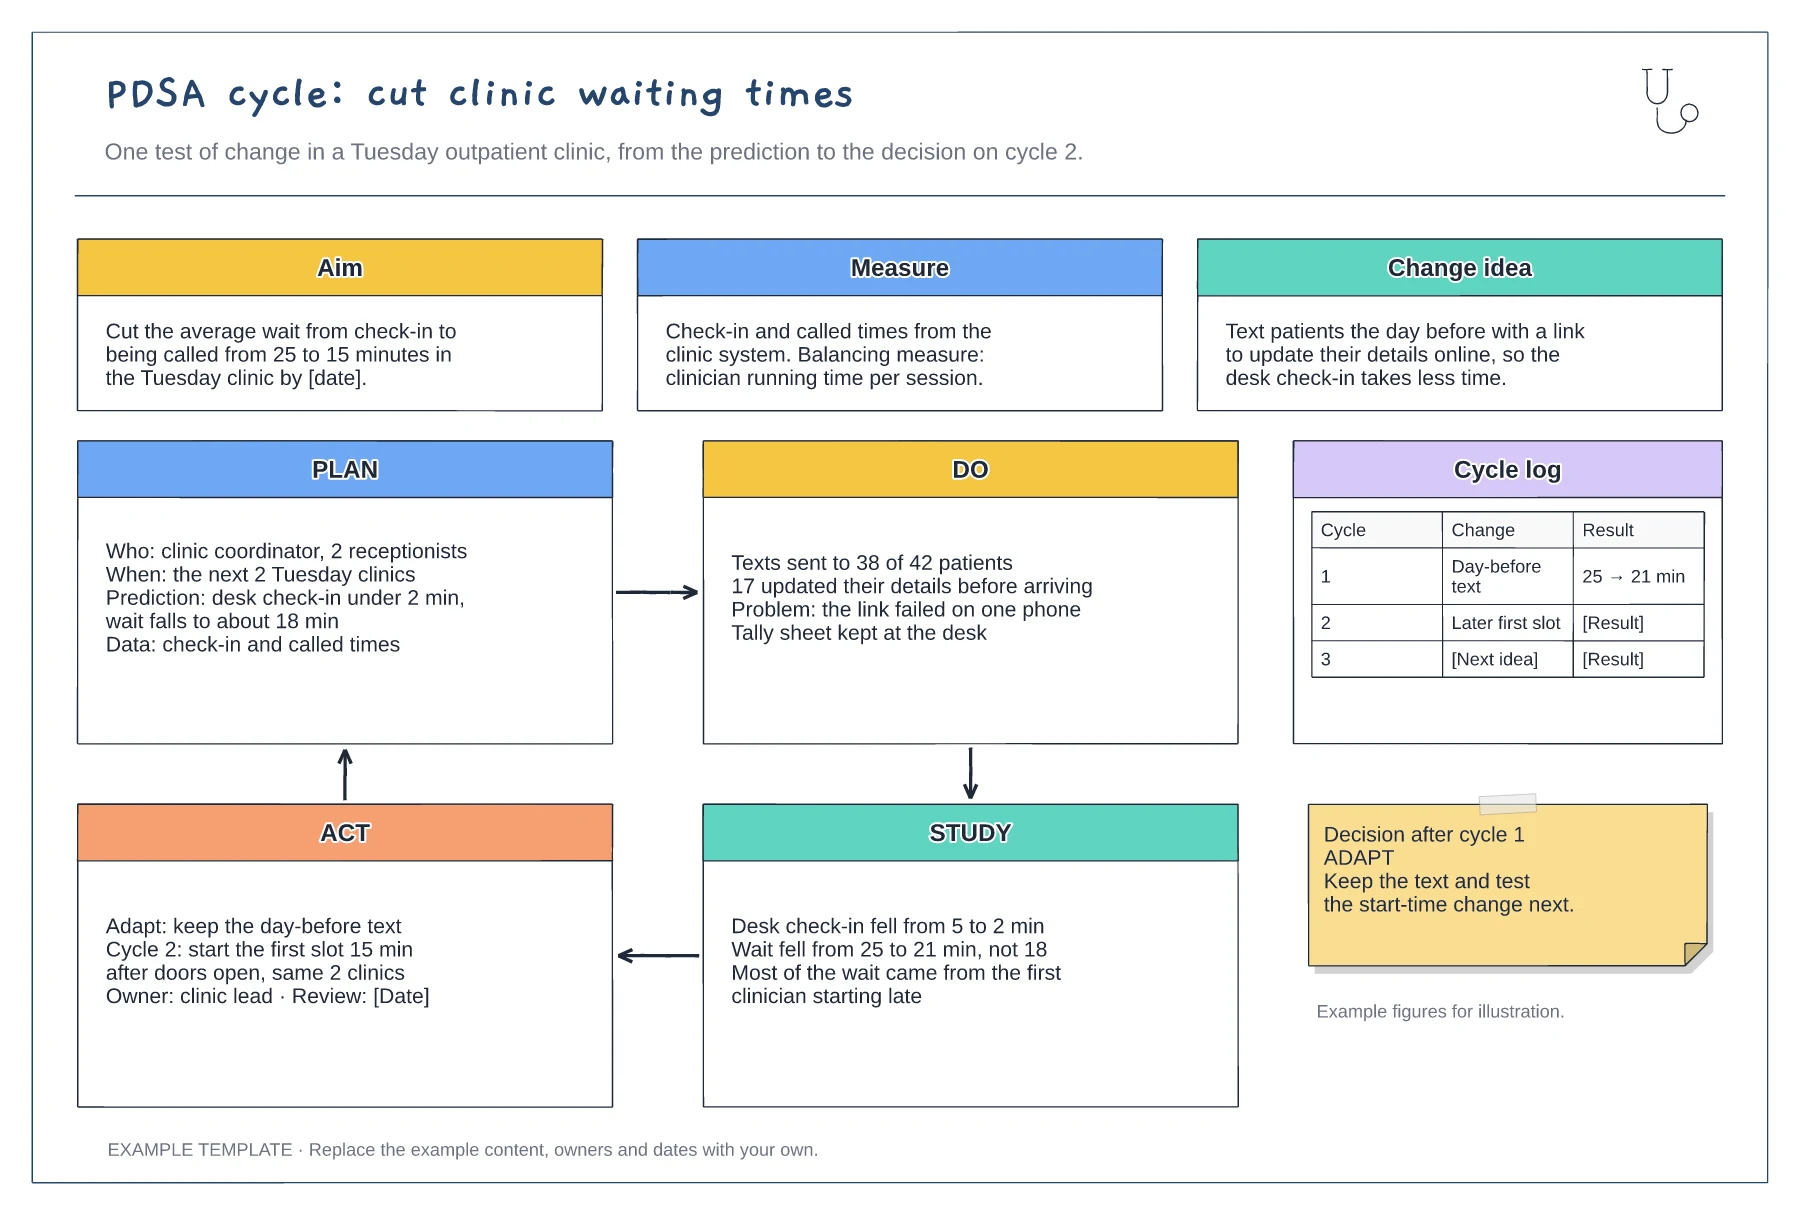
Aim, measure and change idea · Filled-in Plan, Do, Study and Act panels · Cycle log and decision note
Preview and use template →
Supplier, process and customer flow · Inventory queues and process data · Information flow and timing line
Preview and use template →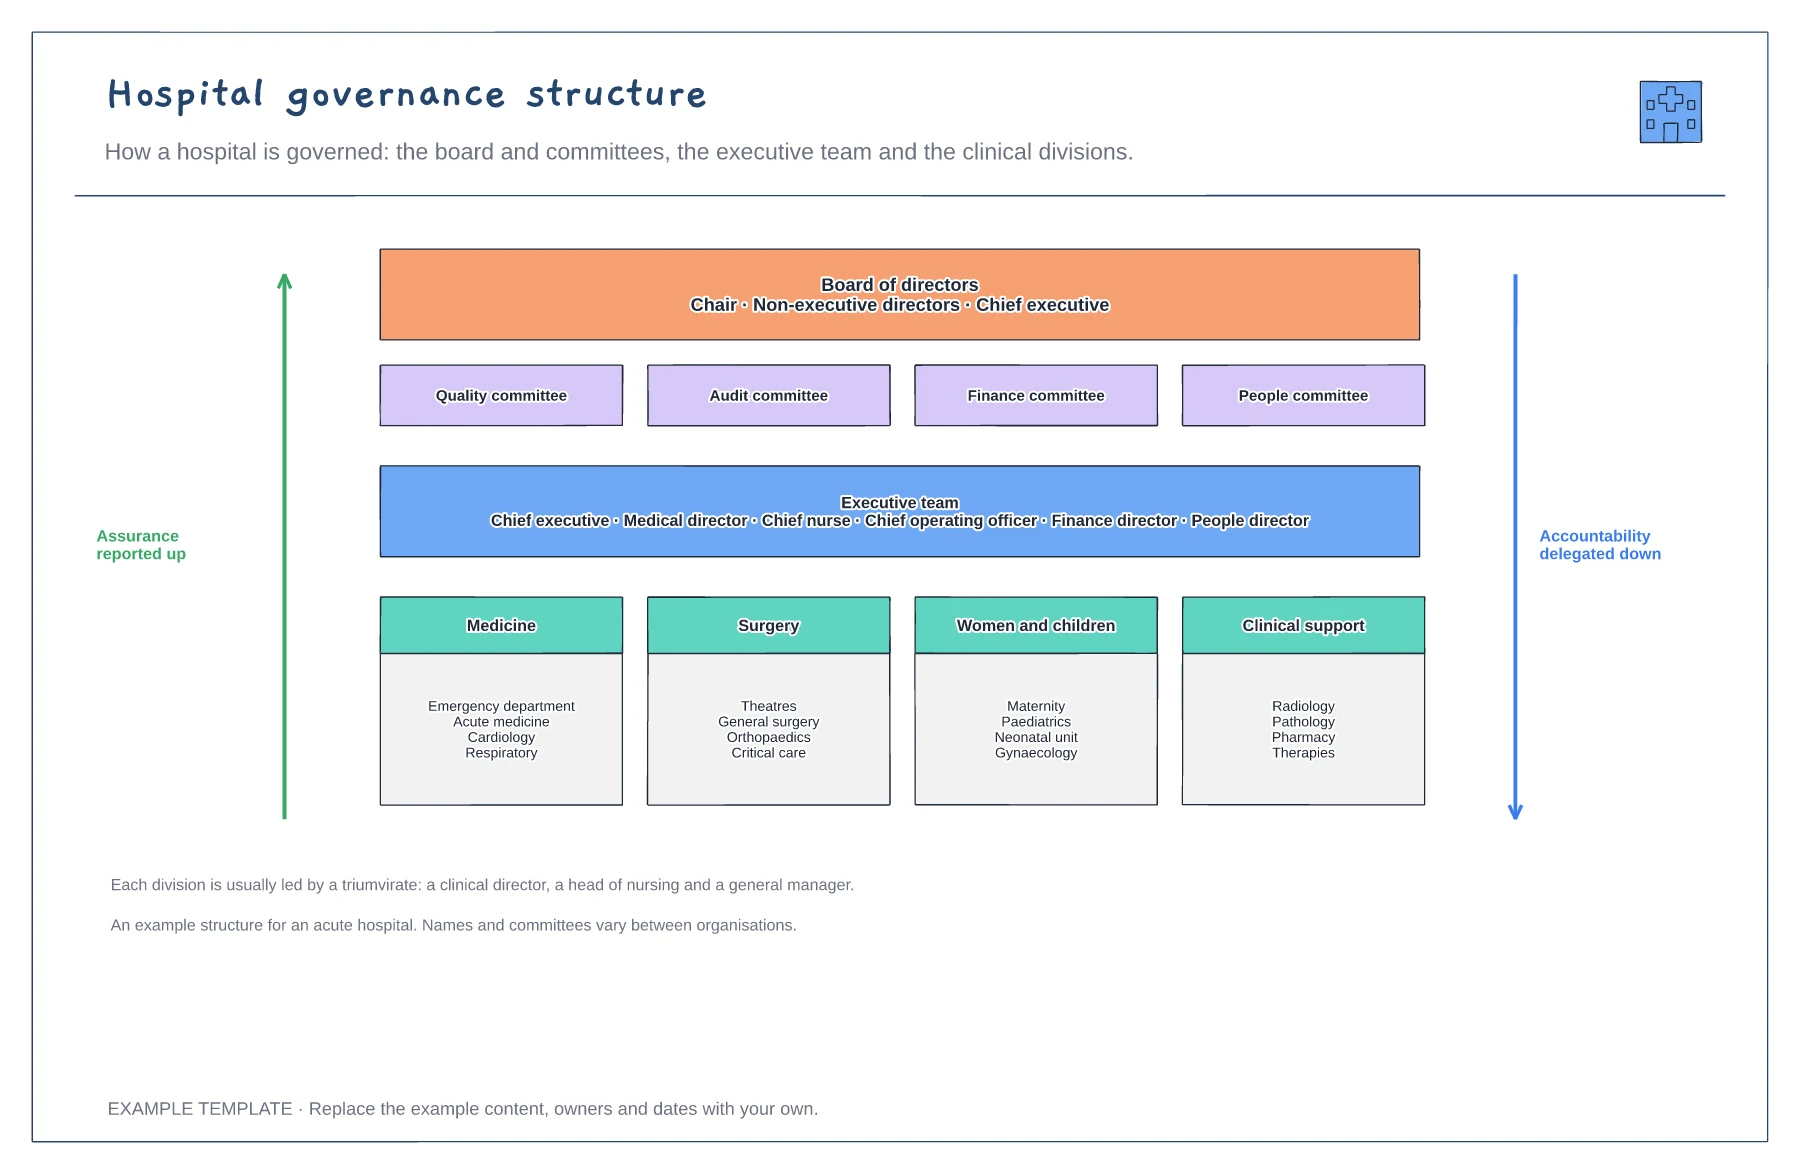
Board and four committees · Executive team · Clinical divisions and their services
Preview and use template →