IT and security
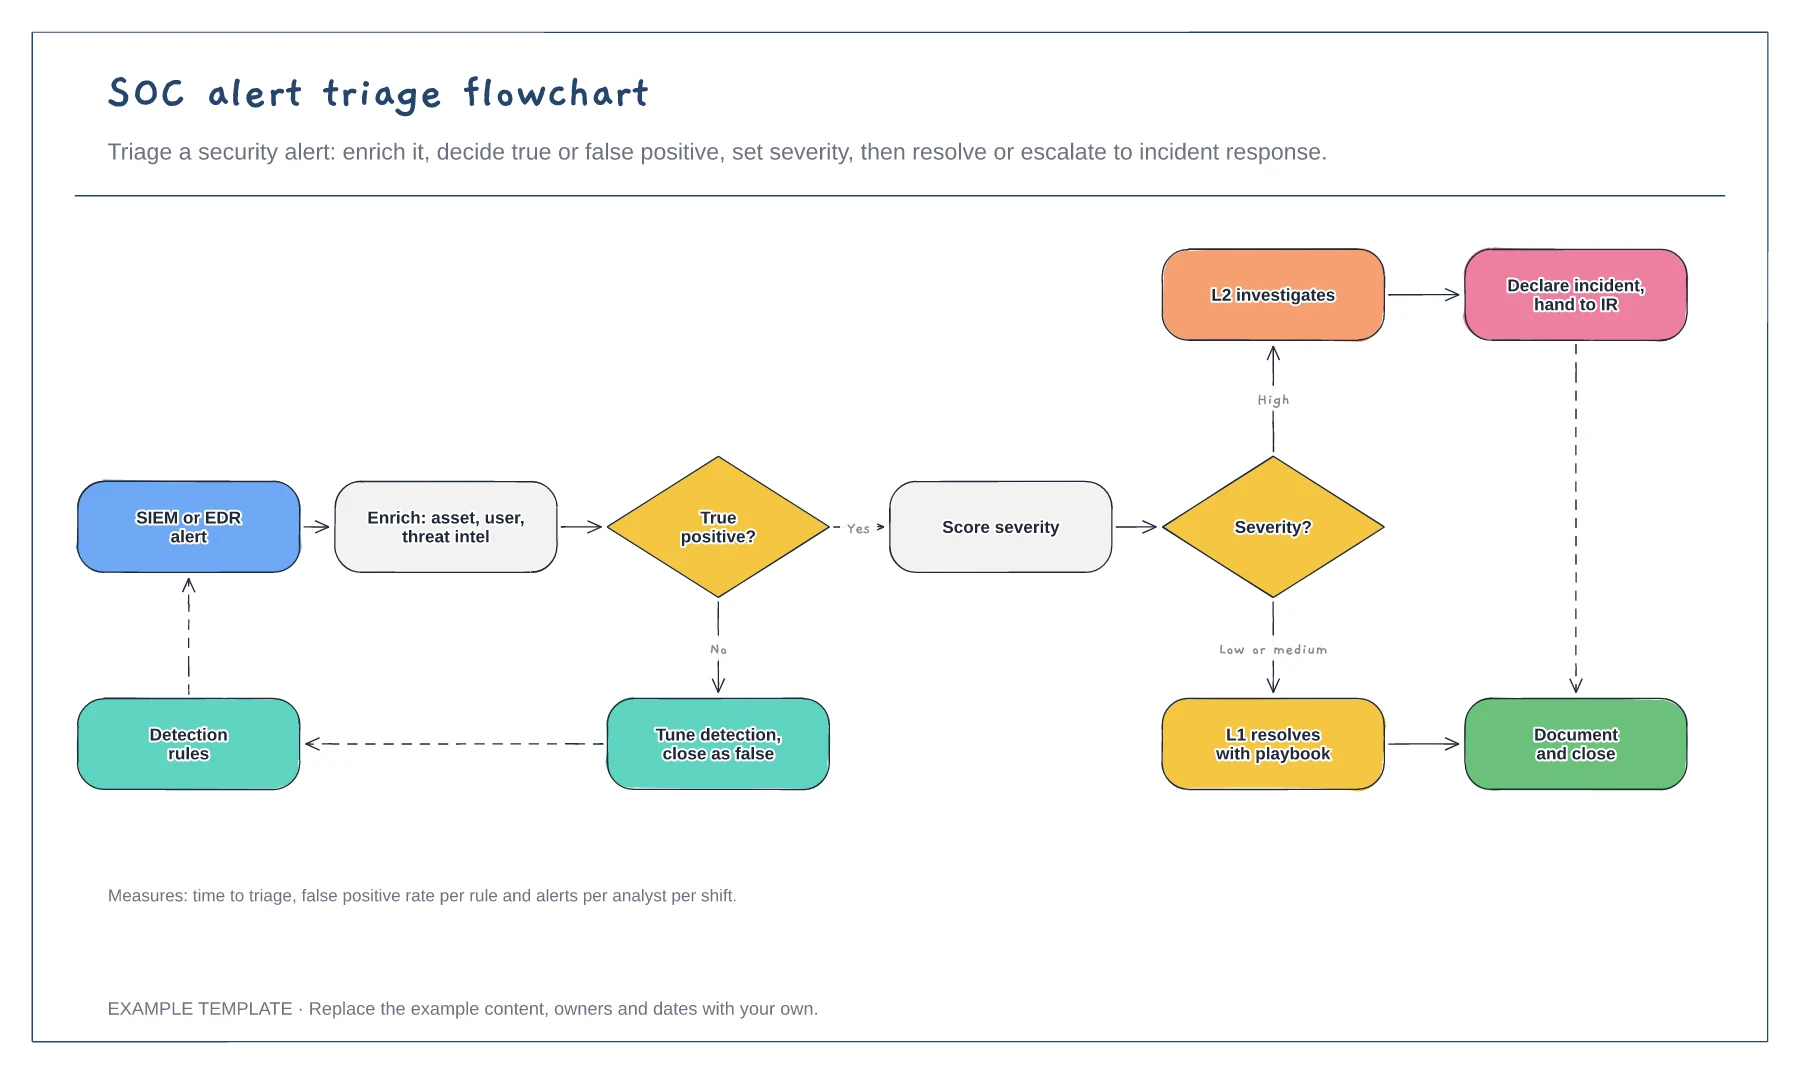
SOC alert triage flowchart template
Enrichment and true or false positive decision · Detection tuning feedback loop · Severity routes and escalation
Preview and use template →An ATT&CK coverage map shows where your detections are strong and where attackers could act unseen. This example takes eleven tactics from initial access to impact, lists common techniques under each and colours them by whether you detect them fully, partly or not at all, with the tool that does the detecting and a summary of the gaps.
No account needed · Opens as your own editable page
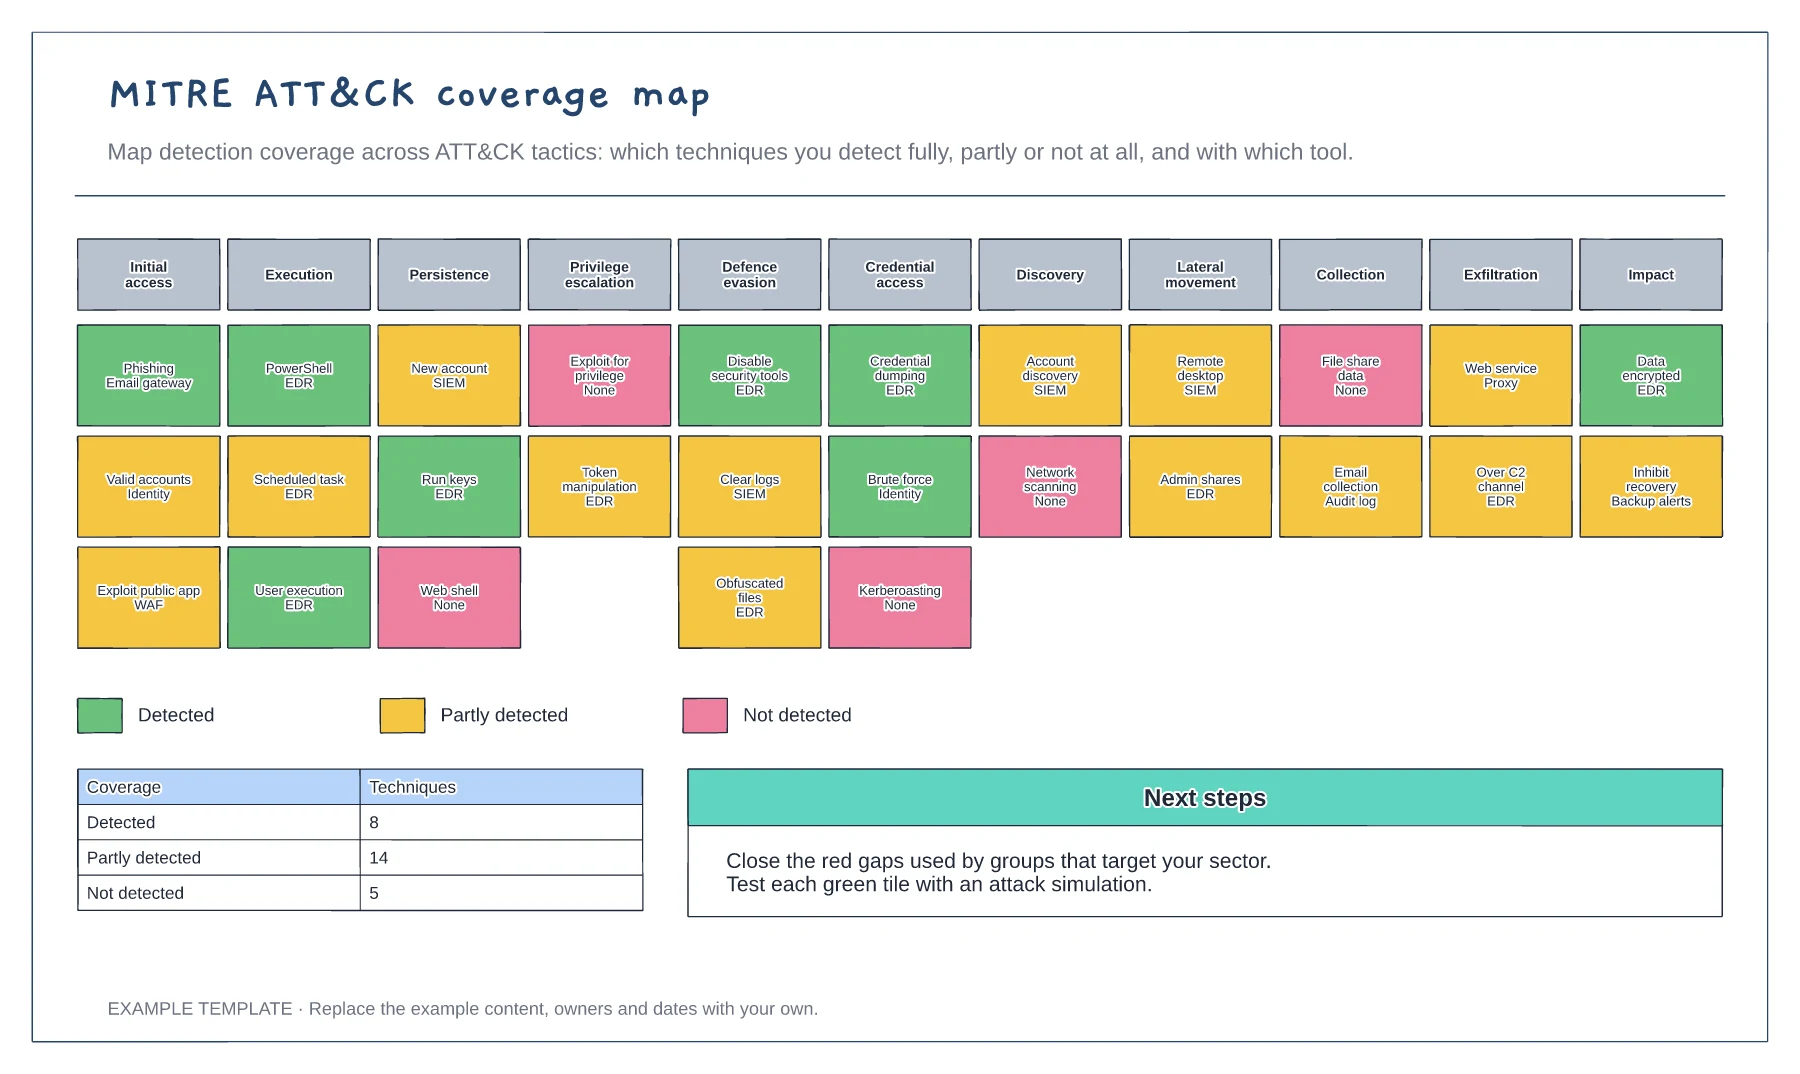
Start with techniques used by the groups that target your sector, rather than trying to cover the whole framework at once.
Mark a technique as detected only if you have tested the detection. Tools that could detect something do not count until proven.
Work on the red tiles that matter most first, then retest the green ones with attack simulations.
They show how well each technique is detected: fully, partly or not at all. The tool named on each card provides that coverage, and None marks a gap.
No. Open the template and edit it in your browser. Your work saves on this device. An account is optional if you want to sync your workspace.
Yes. Use Export in the editor to save a PNG, SVG or PDF, or download an editable .epicdraw backup.
Enrichment and true or false positive decision · Detection tuning feedback loop · Severity routes and escalation
Preview and use template →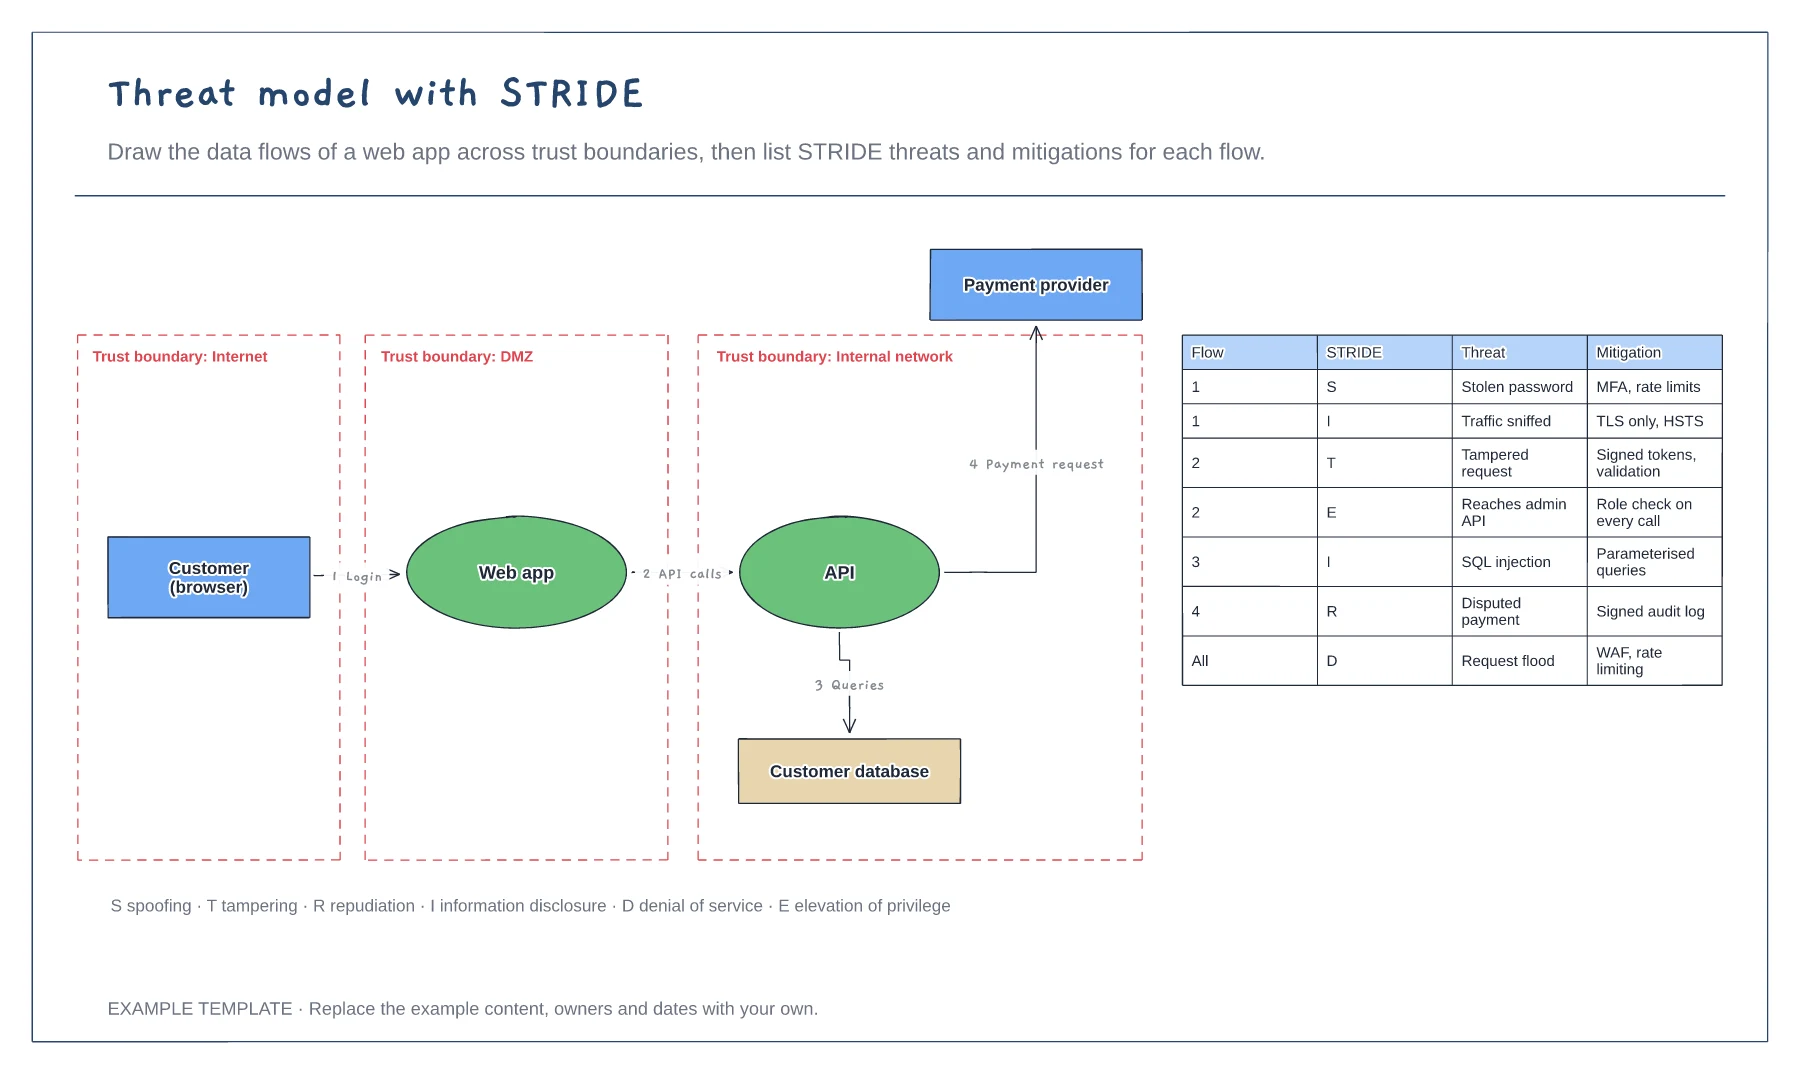
Data flow diagram with trust boundaries · Numbered flows between components · STRIDE threat and mitigation table
Preview and use template →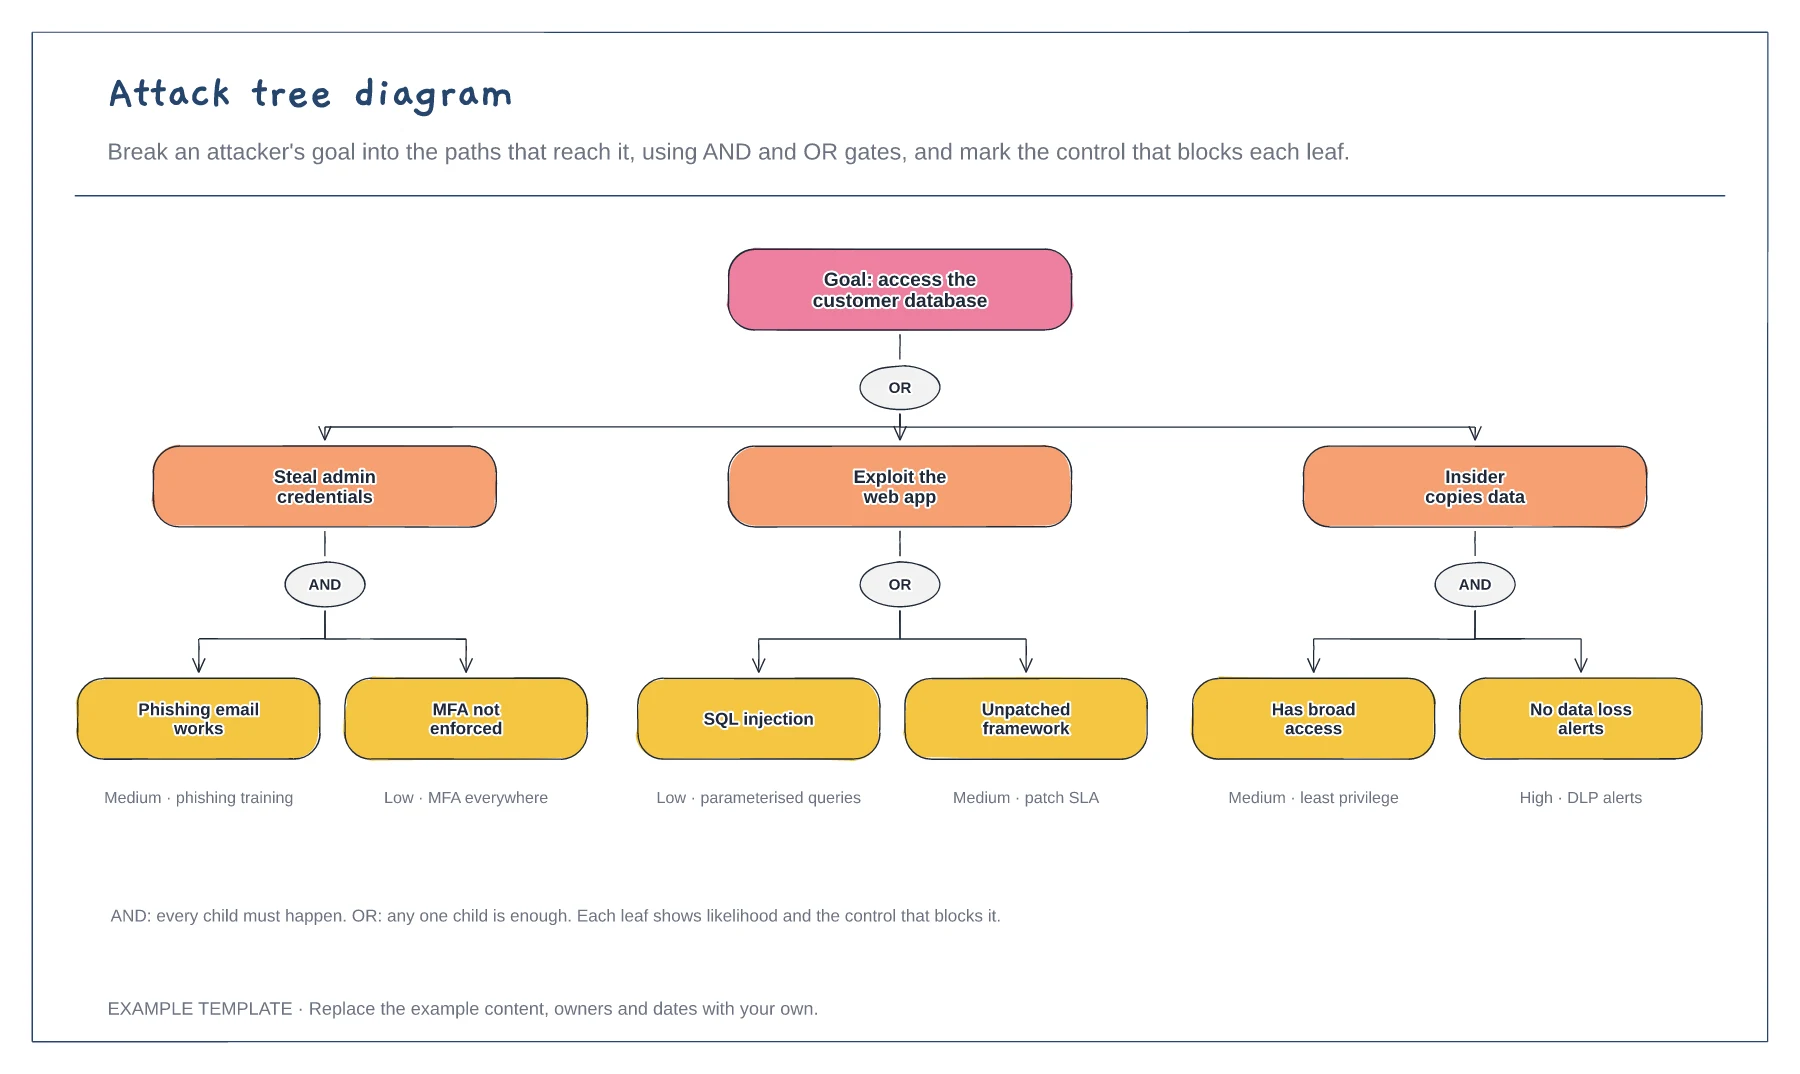
Goal broken into three attack paths · AND and OR gates · Likelihood and control on each leaf
Preview and use template →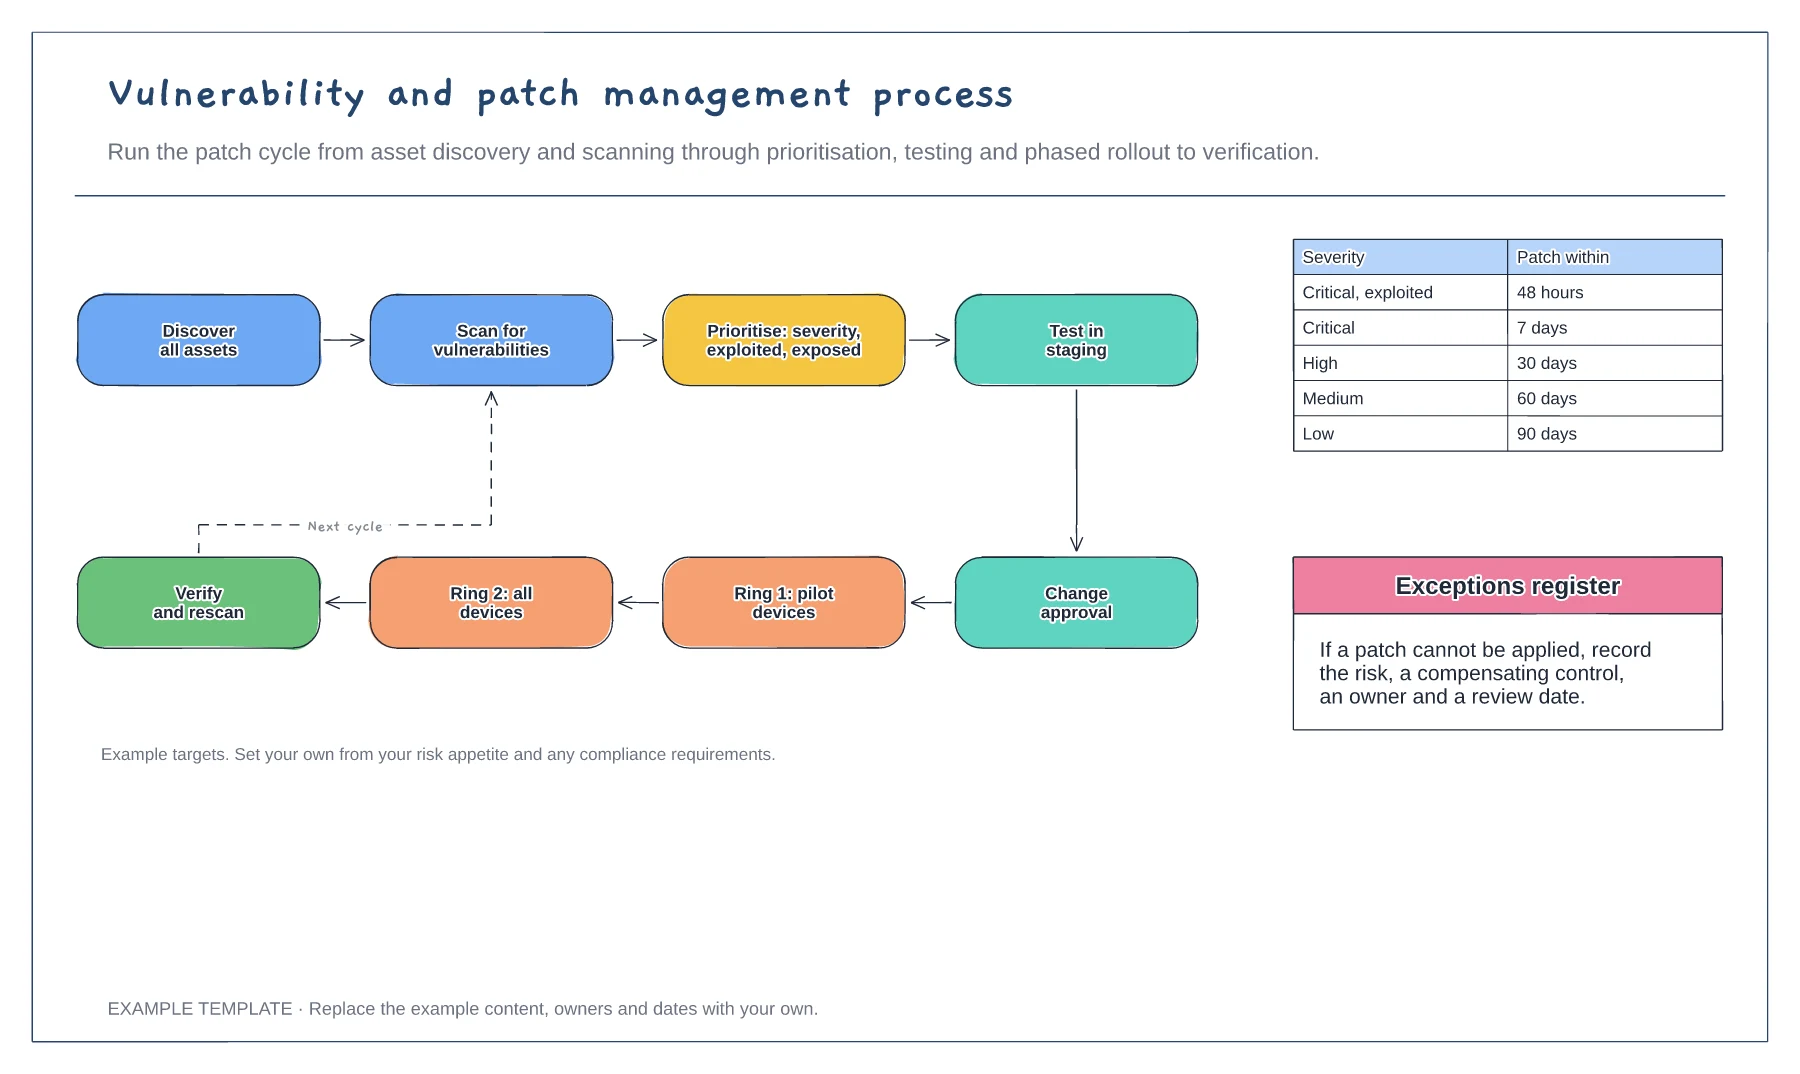
Eight-step patch cycle · Patch deadlines by severity · Exceptions register
Preview and use template →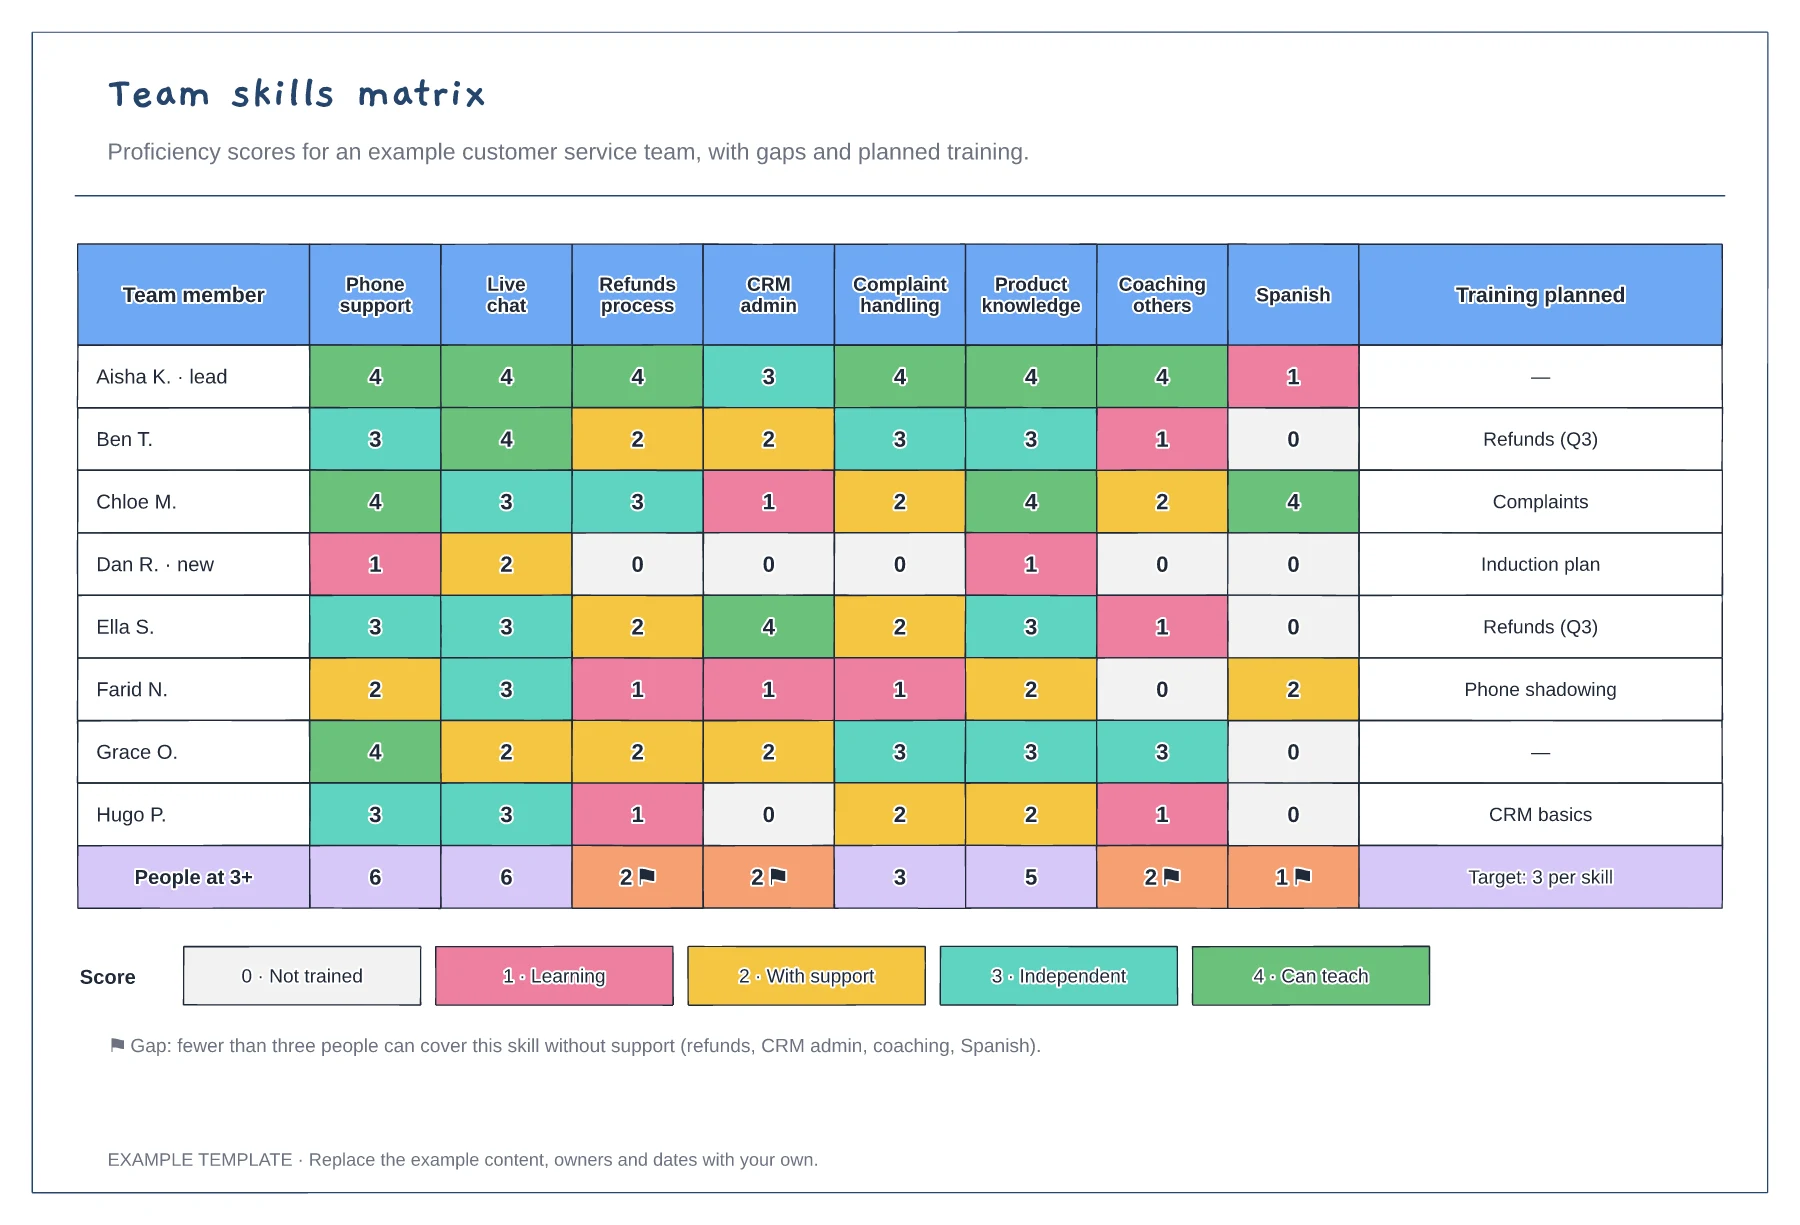
Team members scored against eight skills · Coverage totals with gap flags · Score key and planned training
Preview and use template →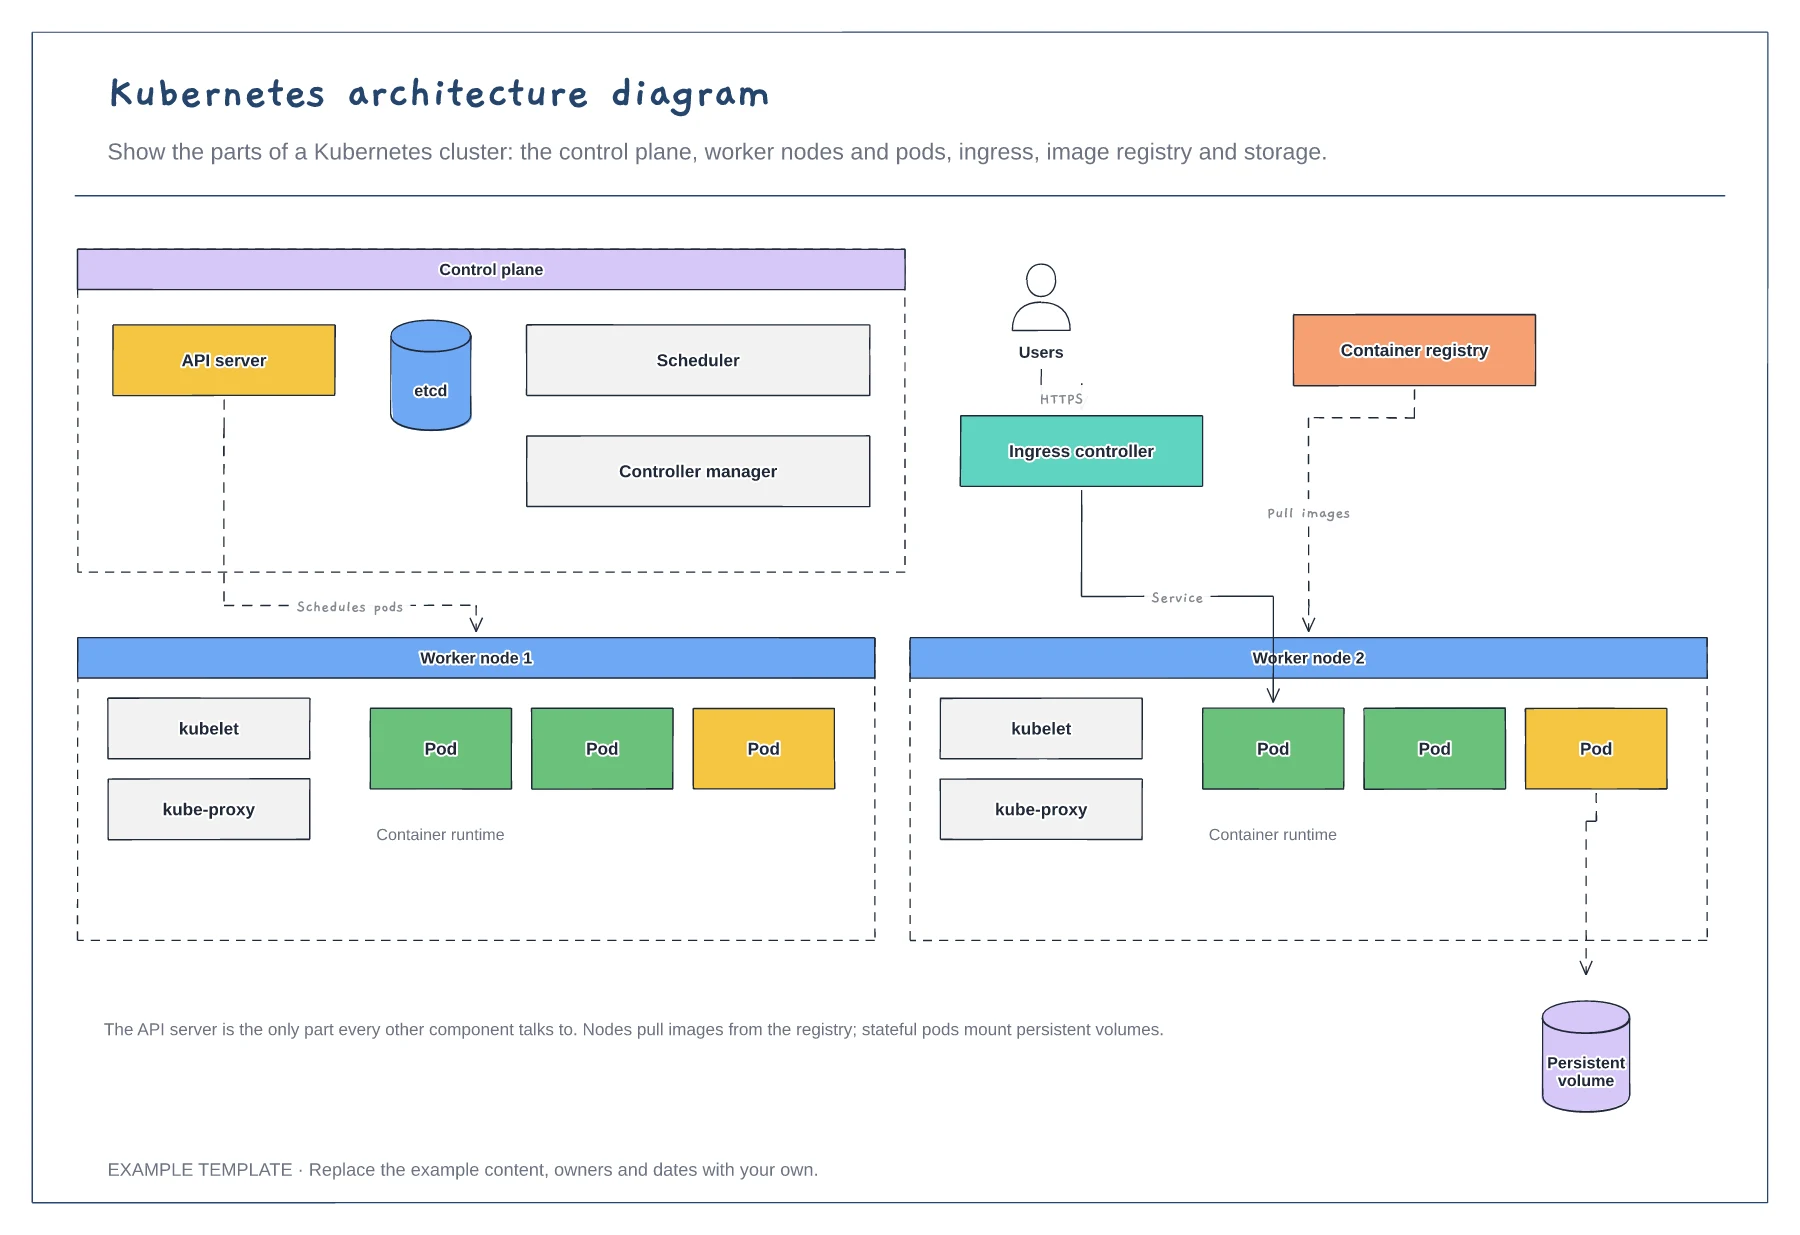
Control plane components · Worker nodes, kubelet and pods · Ingress, registry and storage
Preview and use template →