HR
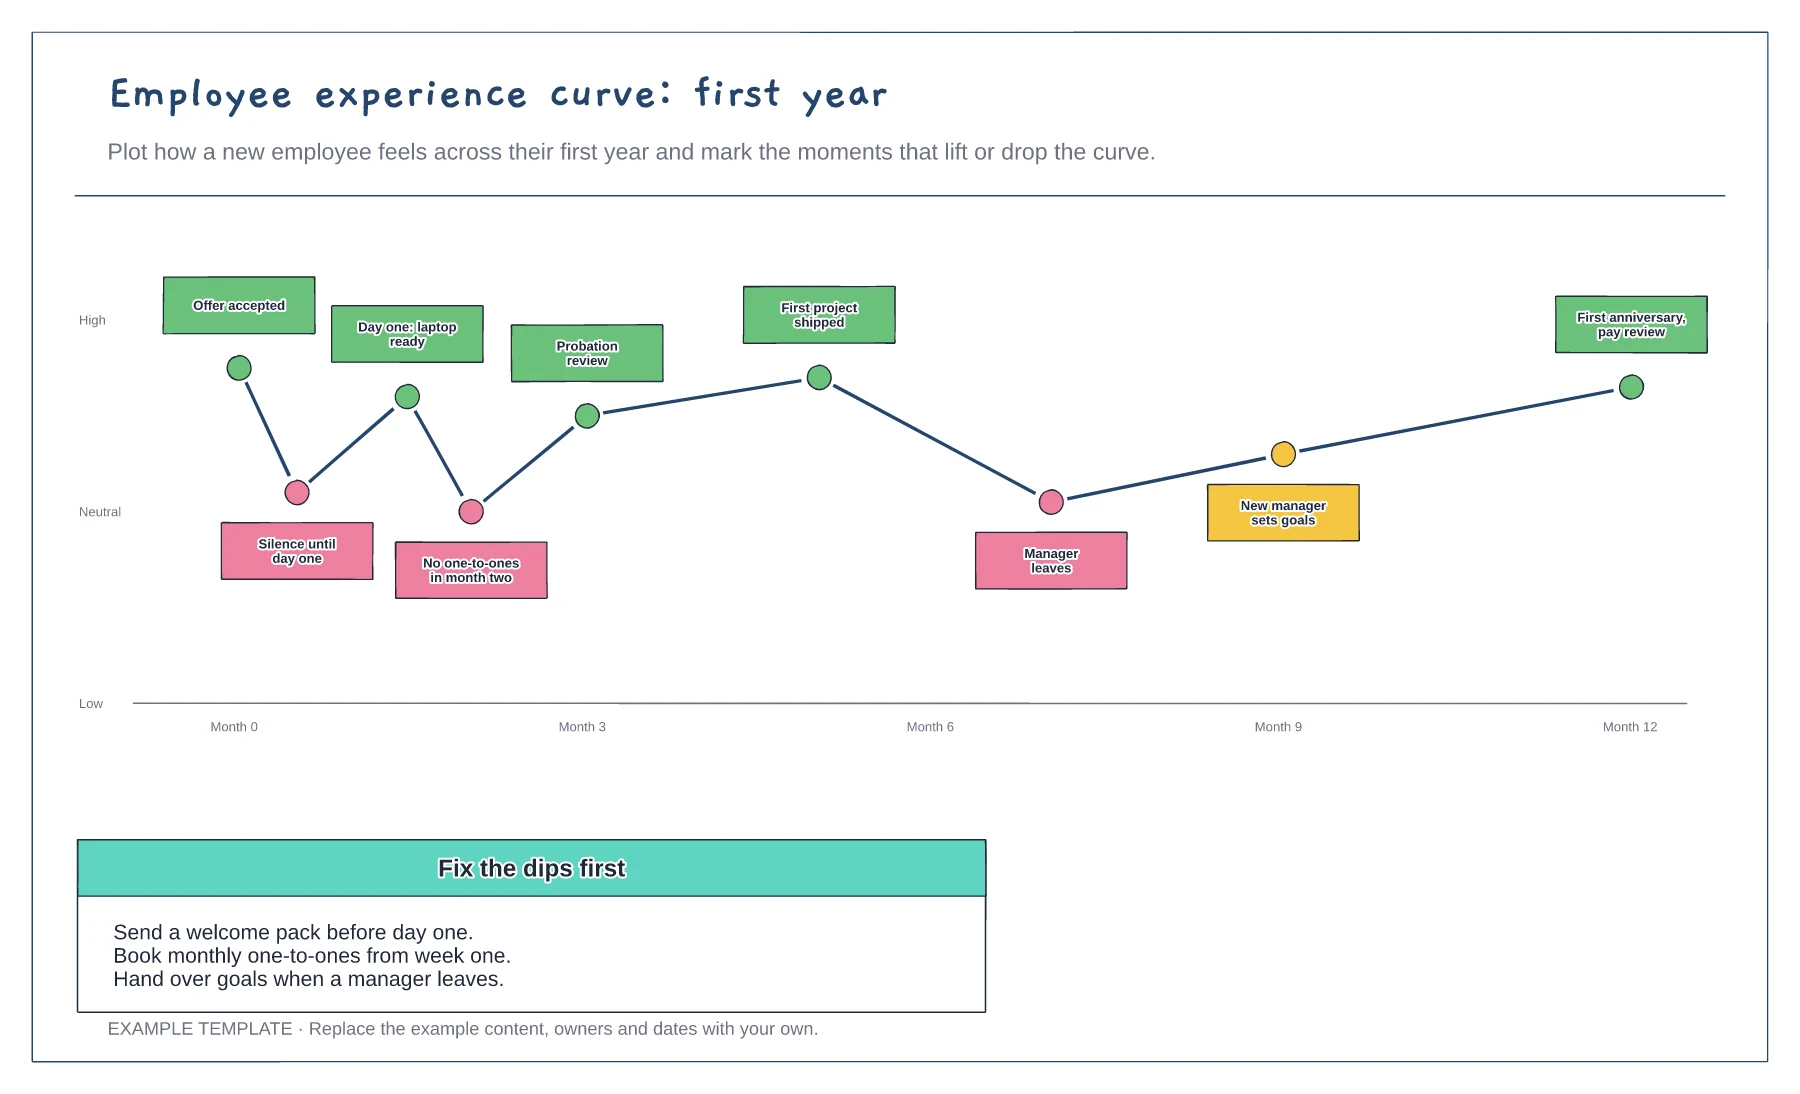
Employee experience curve: first year template
Feeling curve over the first year · Moments that lift or drop it · Fixes for the dips
Preview and use template →An employee lifecycle diagram shows the stages someone passes through with an organisation, from first hearing about a role to leaving and perhaps returning. This example arranges six stages in a cycle, Attract, Recruit, Onboard, Develop, Retain and Separate, with the HR touchpoints, owner and one measure for each.
No account needed · Opens as your own editable page
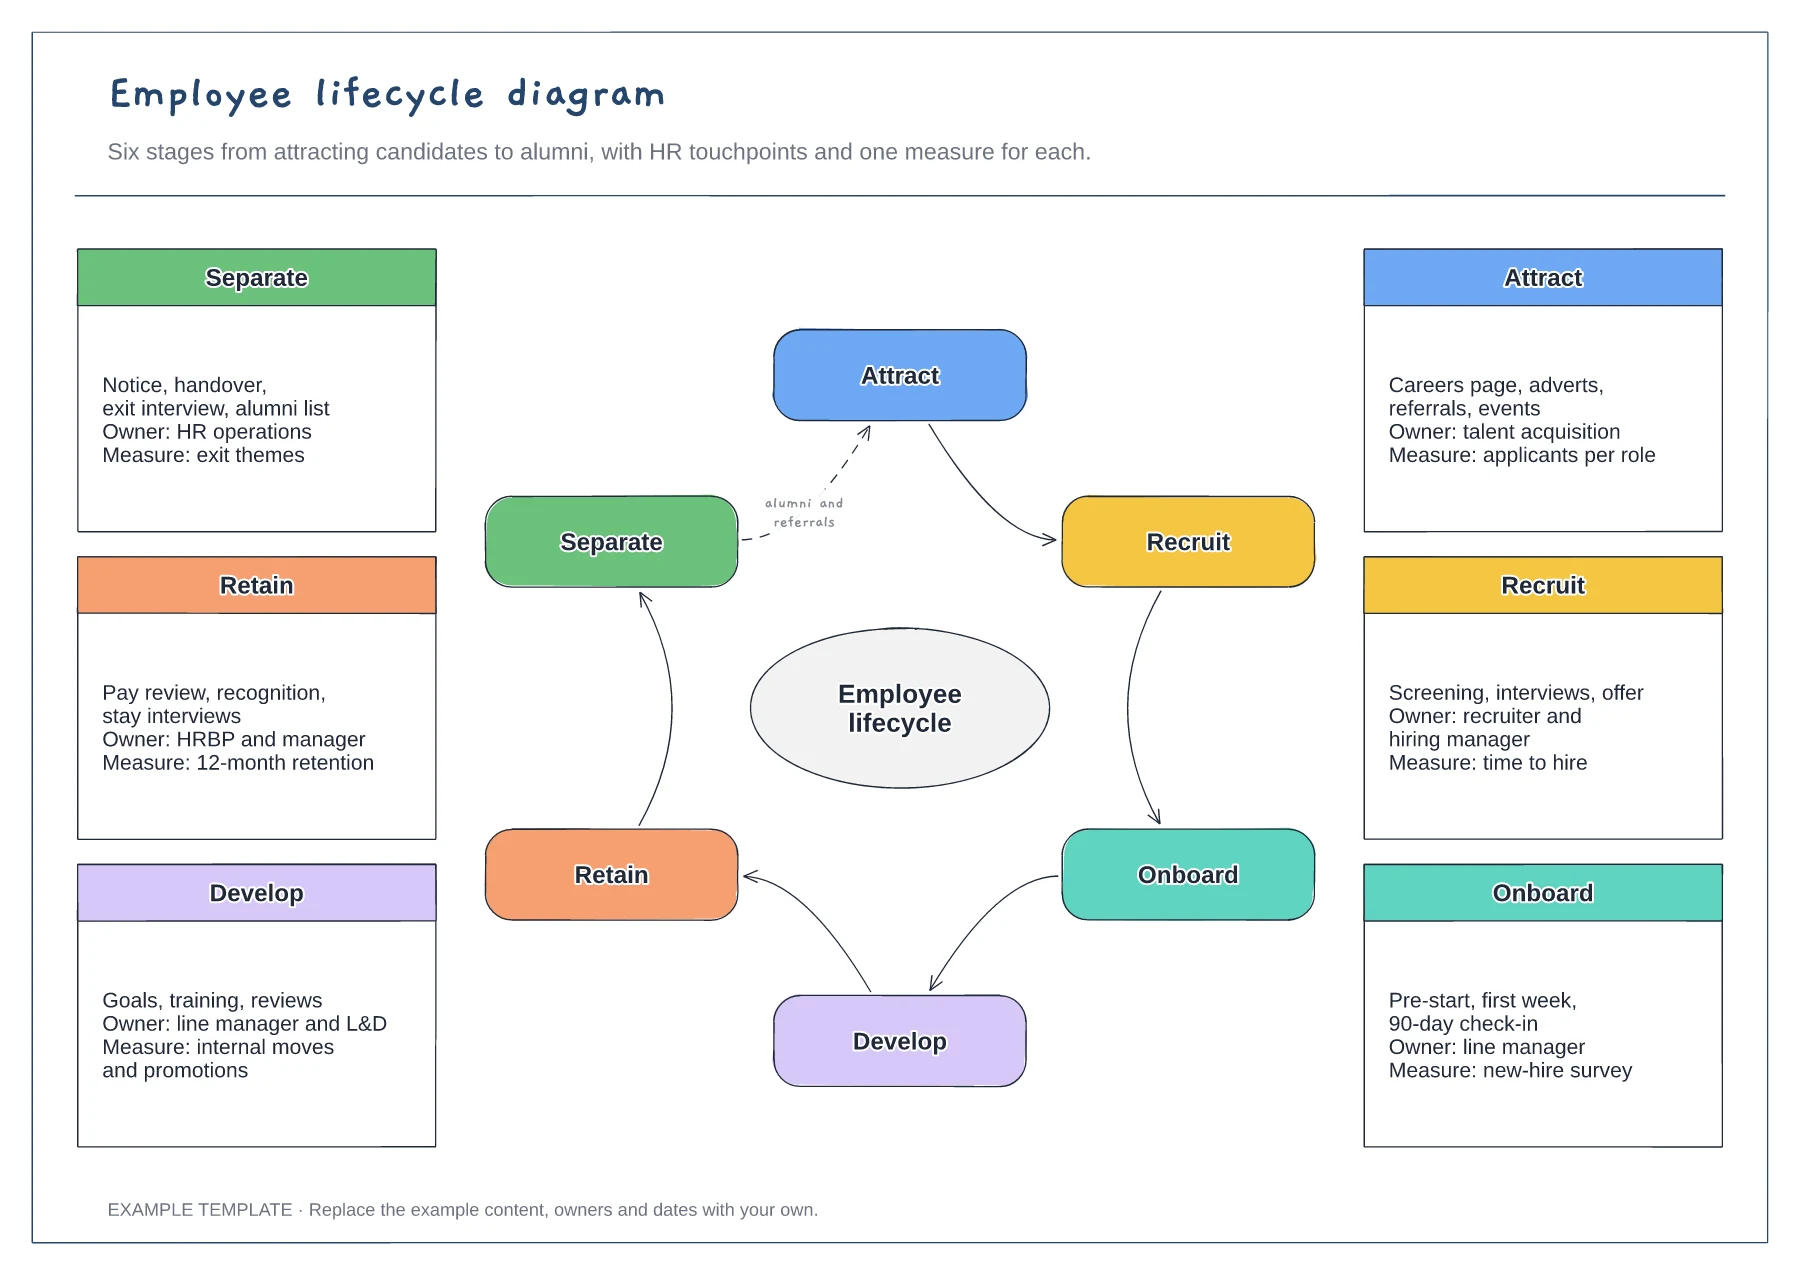
Replace the examples with the activities your organisation actually runs at each stage. Gaps become obvious, such as no planned conversation between onboarding and the first annual review.
Write who is responsible for the experience at each stage. Shared ownership is fine, but a stage with nobody named tends to be the one that gets neglected.
Choose a measure you can collect, such as time to hire or 12-month retention. One reliable number per stage is more useful than a dashboard nobody updates.
Yes. Insert a stage between recruit and onboard and give it its own touchpoints, owner and measure like the other stages.
No. Open the template and edit it in your browser. Your work saves on this device. An account is optional if you want to sync your workspace.
Yes. Use Export in the editor to save a PNG, SVG or PDF, or download an editable .epicdraw backup.
Feeling curve over the first year · Moments that lift or drop it · Fixes for the dips
Preview and use template →
Before-start preparation · Day-one and first-week activities · First-month review
Preview and use template →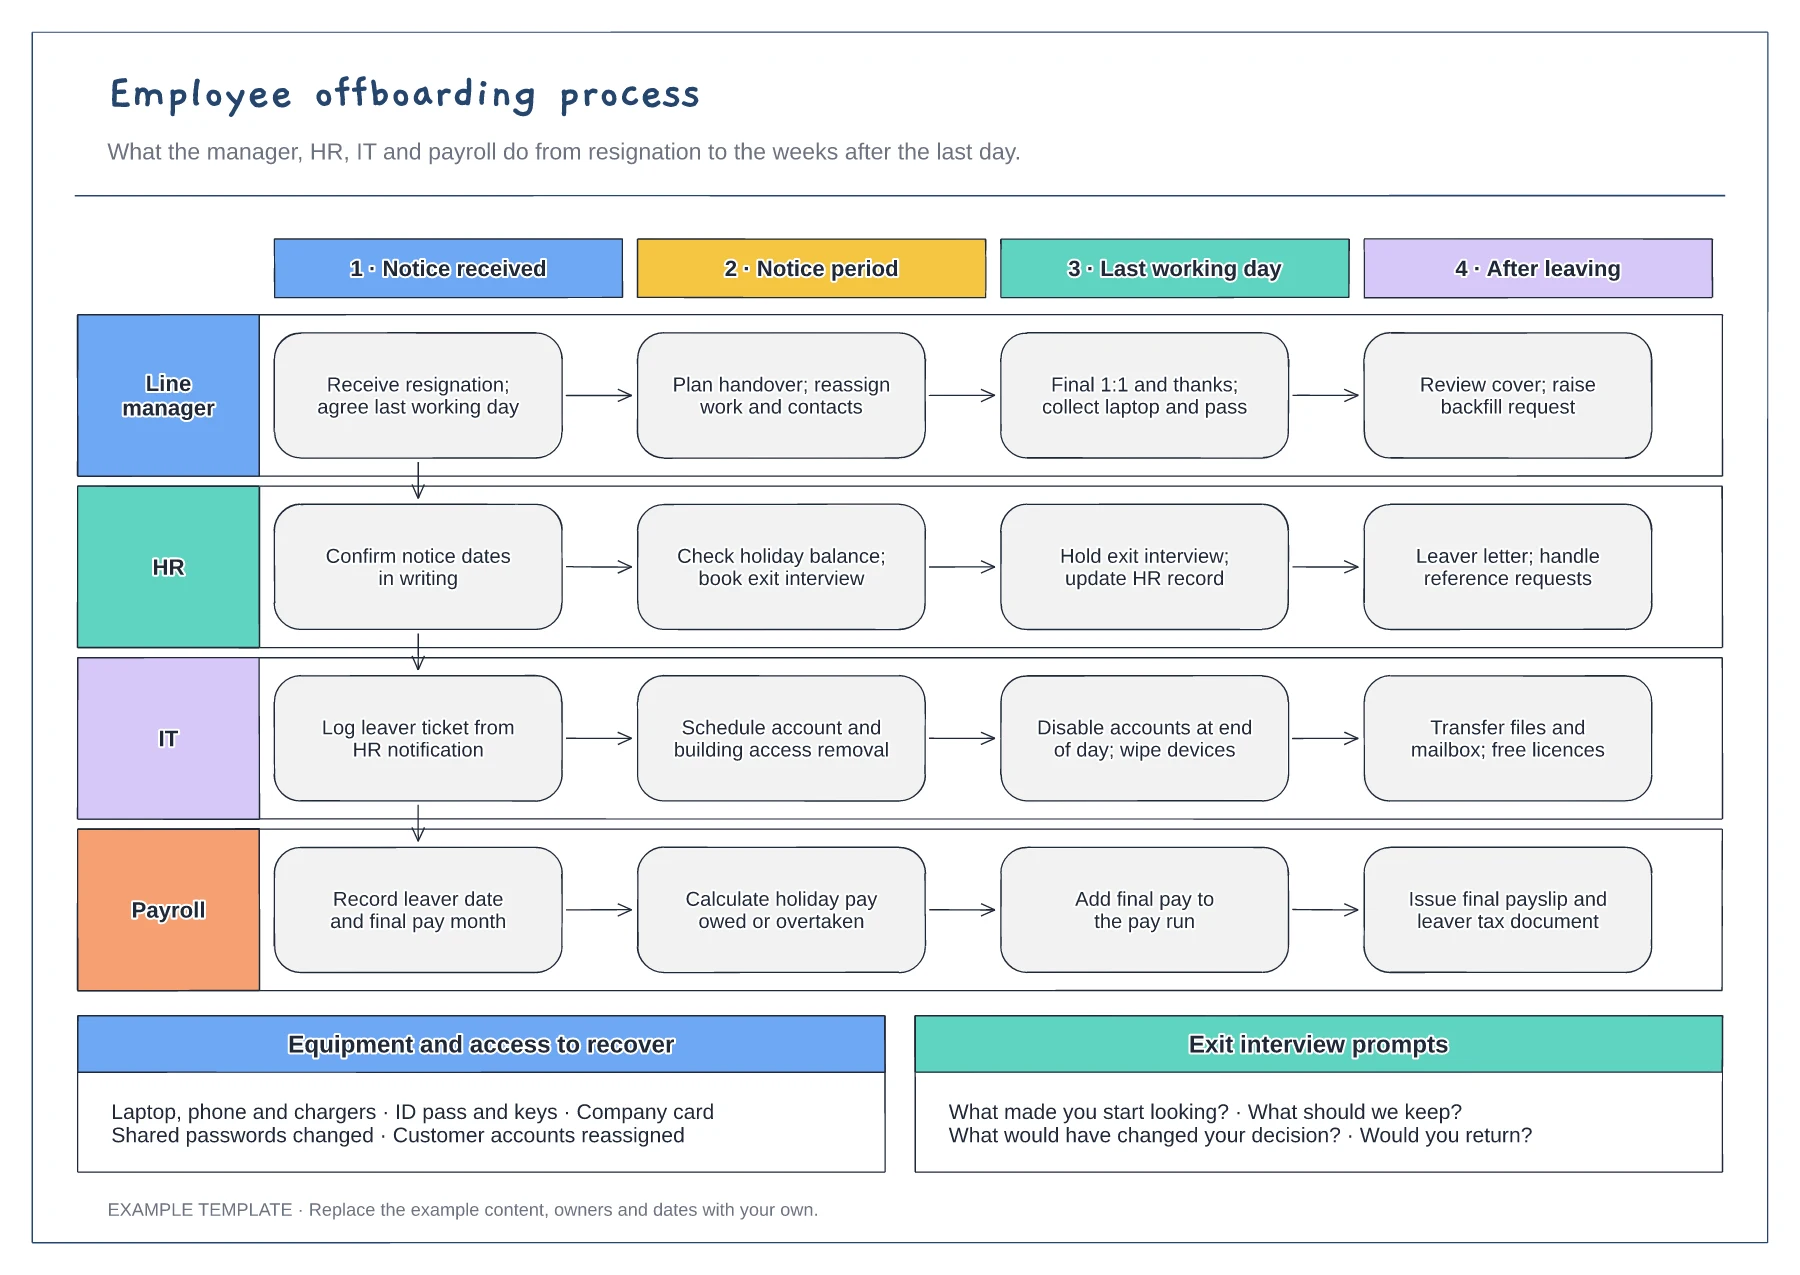
Manager, HR, IT and payroll lanes · Four stages from notice to after leaving · Equipment checklist and exit questions
Preview and use template →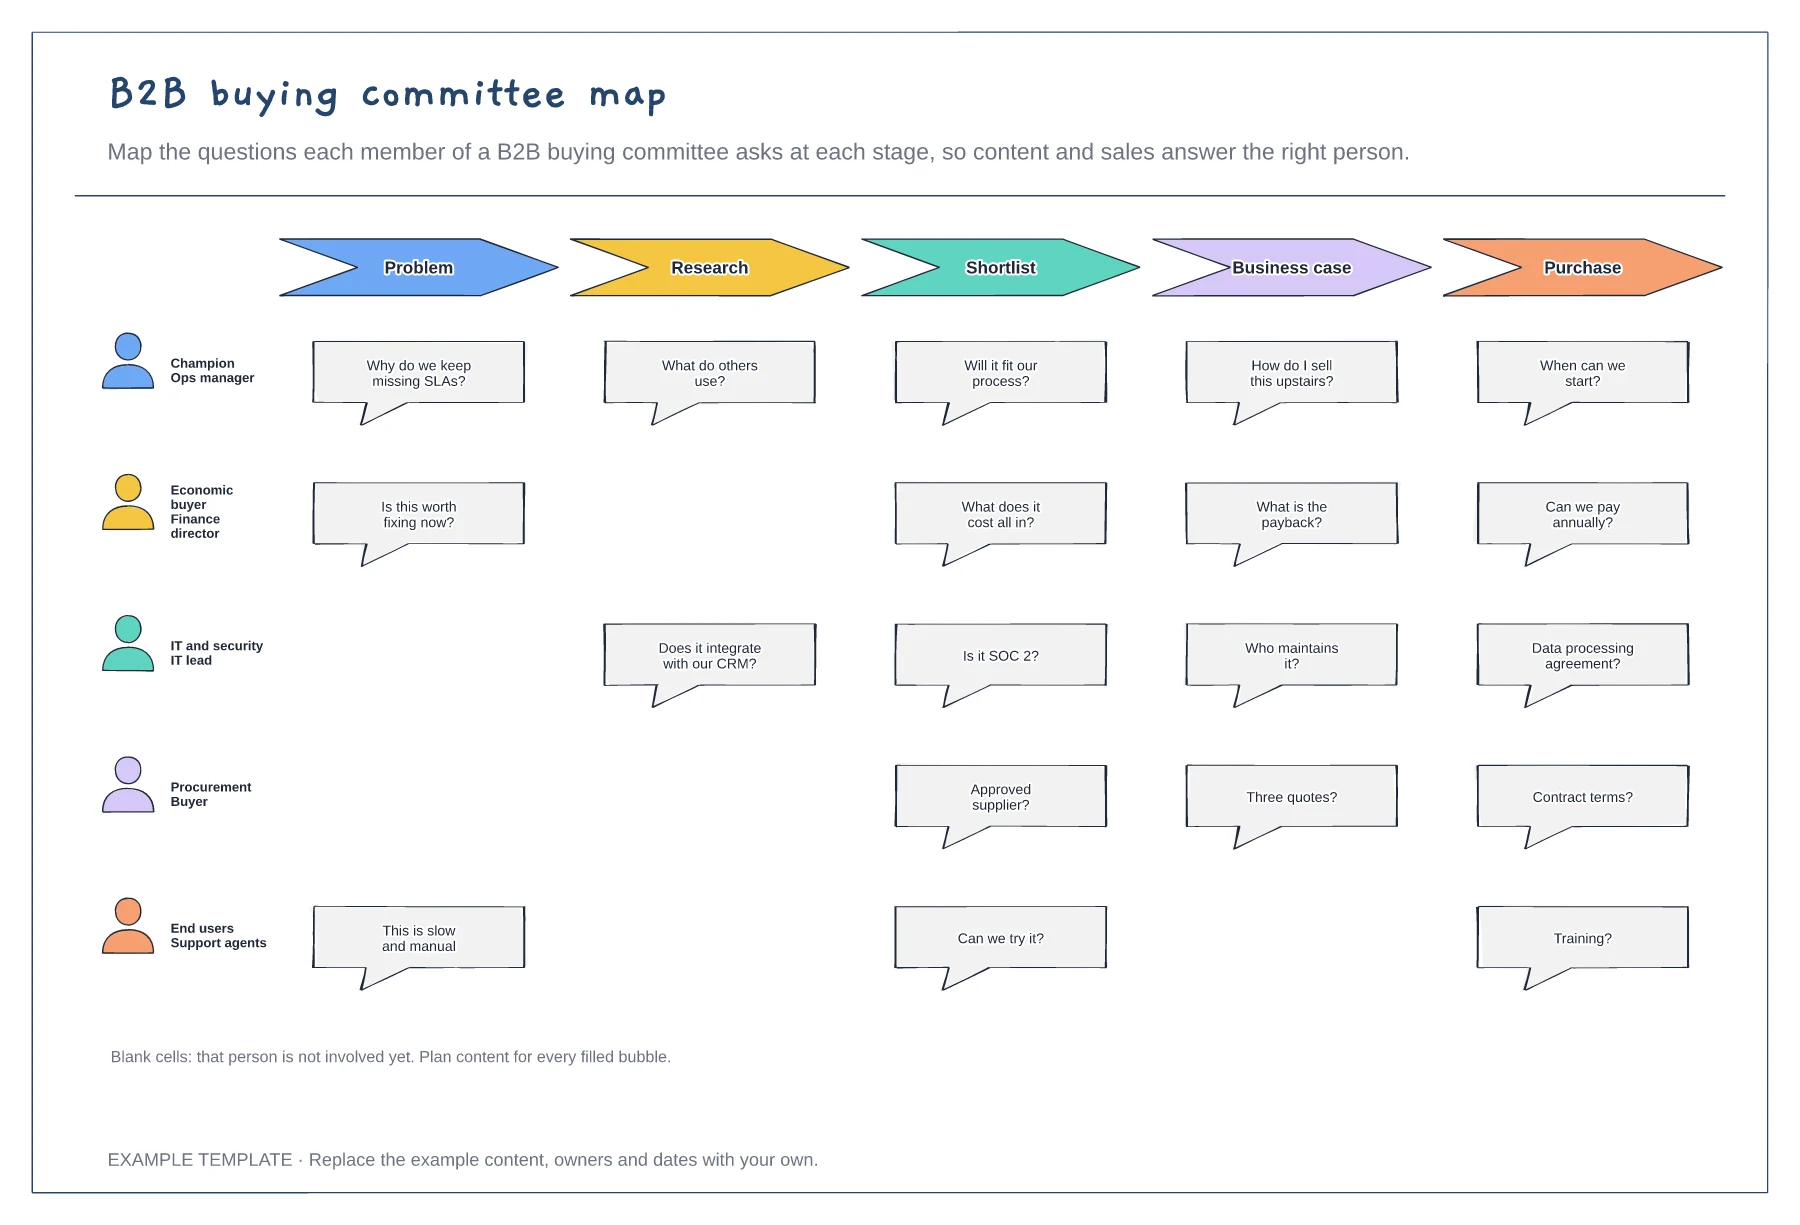
Five buying committee roles · Their questions at each stage · Gaps where a role is not yet involved
Preview and use template →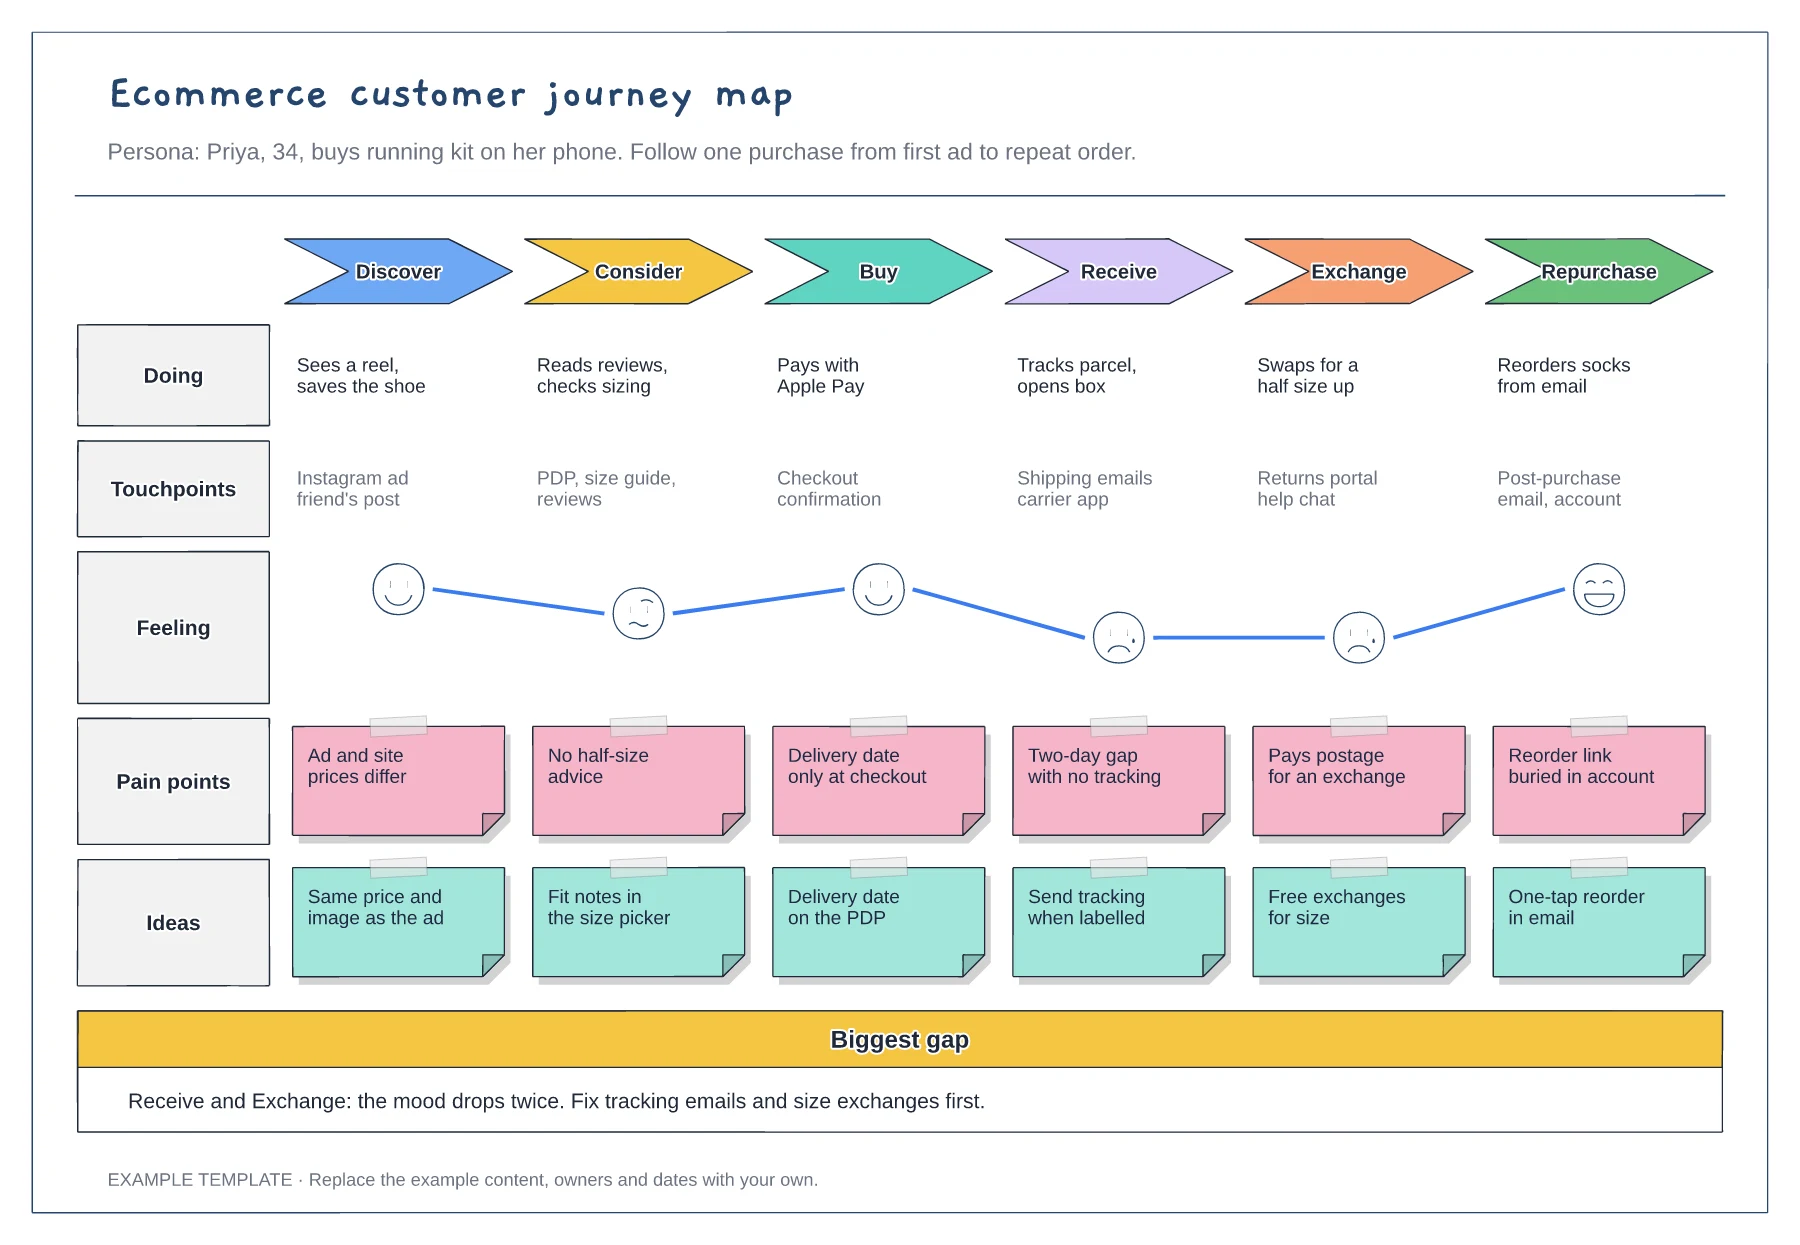
Six stages from discover to repurchase · Touchpoints and an emotion curve · Pain points paired with ideas
Preview and use template →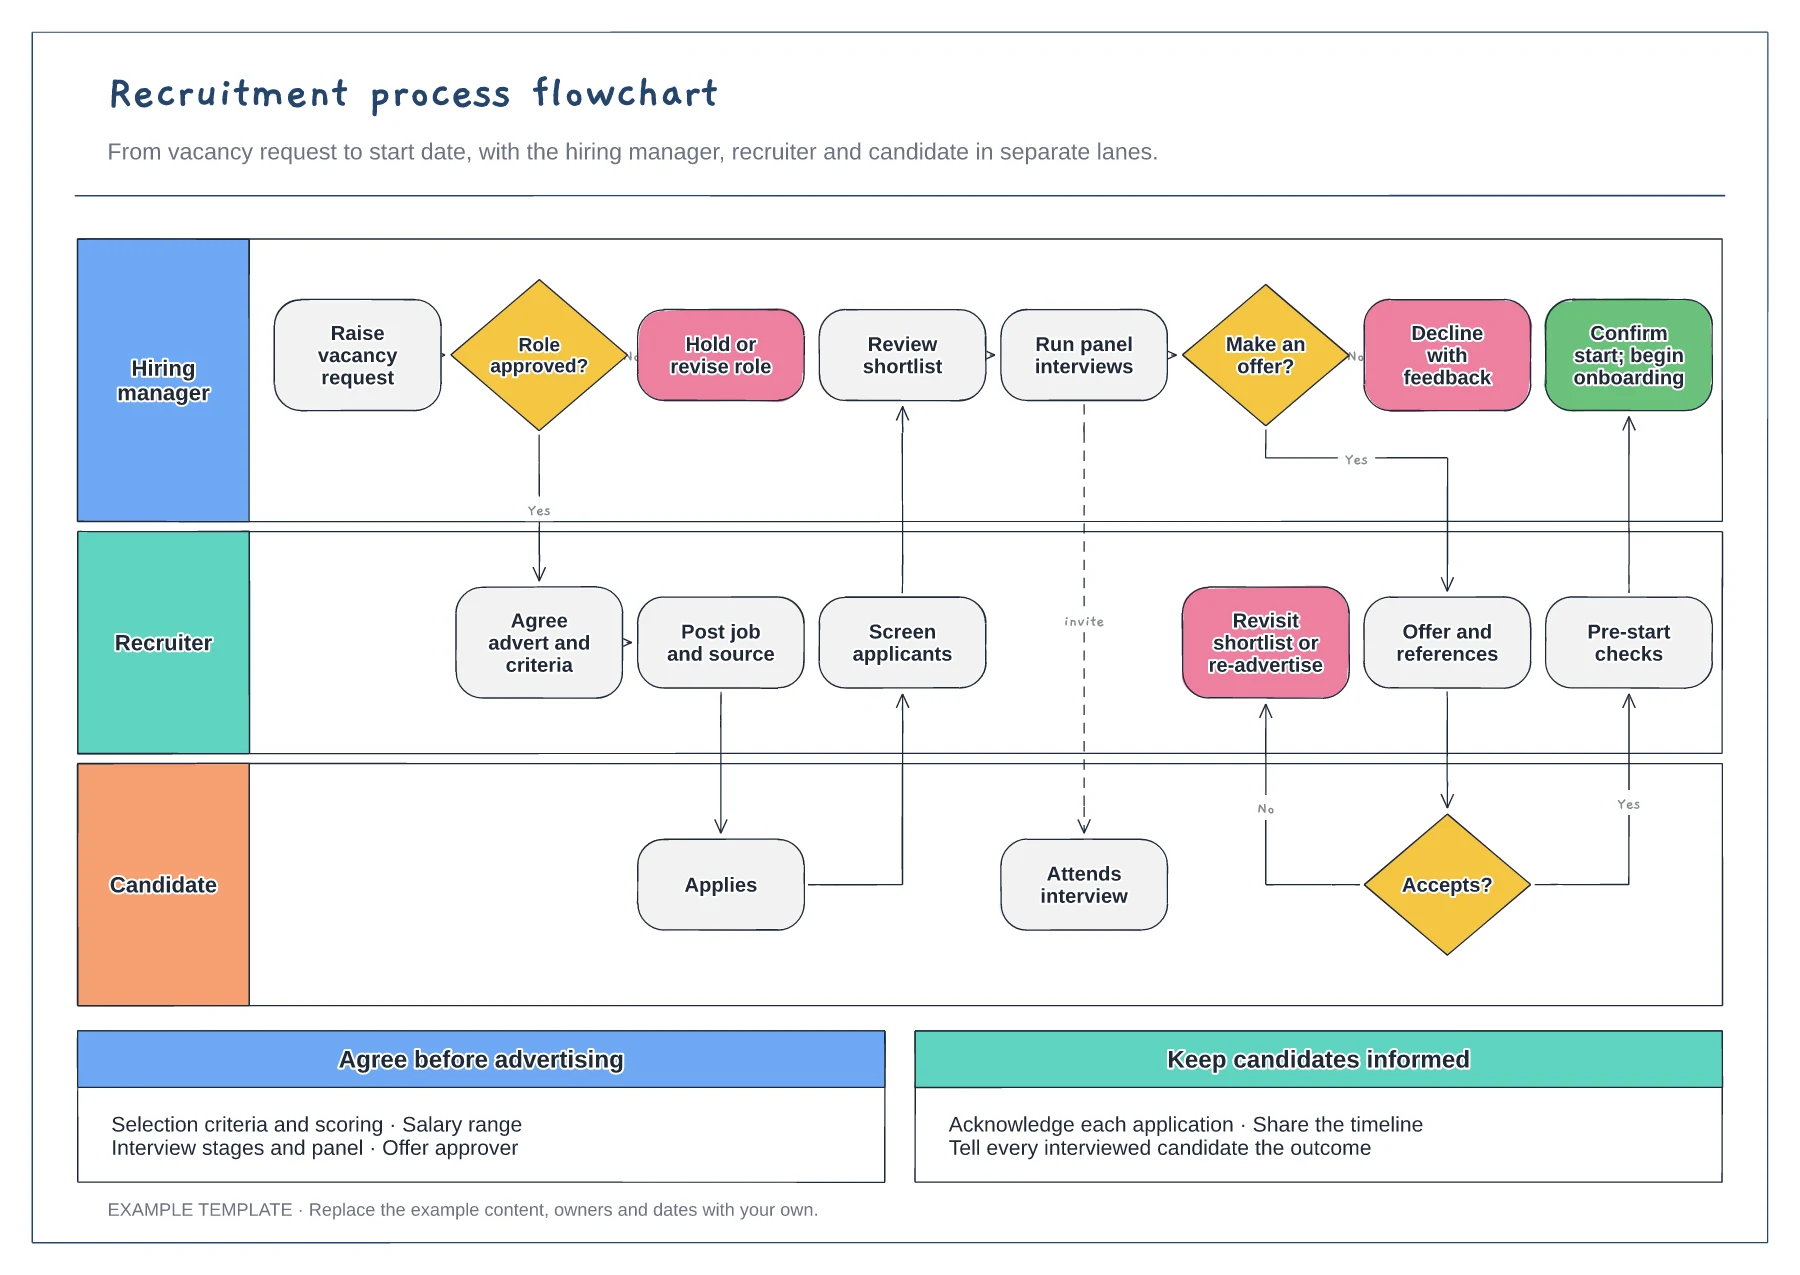
Hiring manager, recruiter and candidate lanes · Approval, offer and acceptance decisions · Notes on criteria and candidate updates
Preview and use template →