
HR
Employee onboarding checklist template
Before-start preparation · Day-one and first-week activities · First-month review
Preview and use template →An experience curve shows how a new employee feels across their first year, so you can see which moments make or break it. This example plots a curve from accepting the offer to the first anniversary, labels the highs such as a first project shipped and the lows such as silence before day one or a manager leaving, and lists the fixes for the dips.
No account needed · Opens as your own editable page
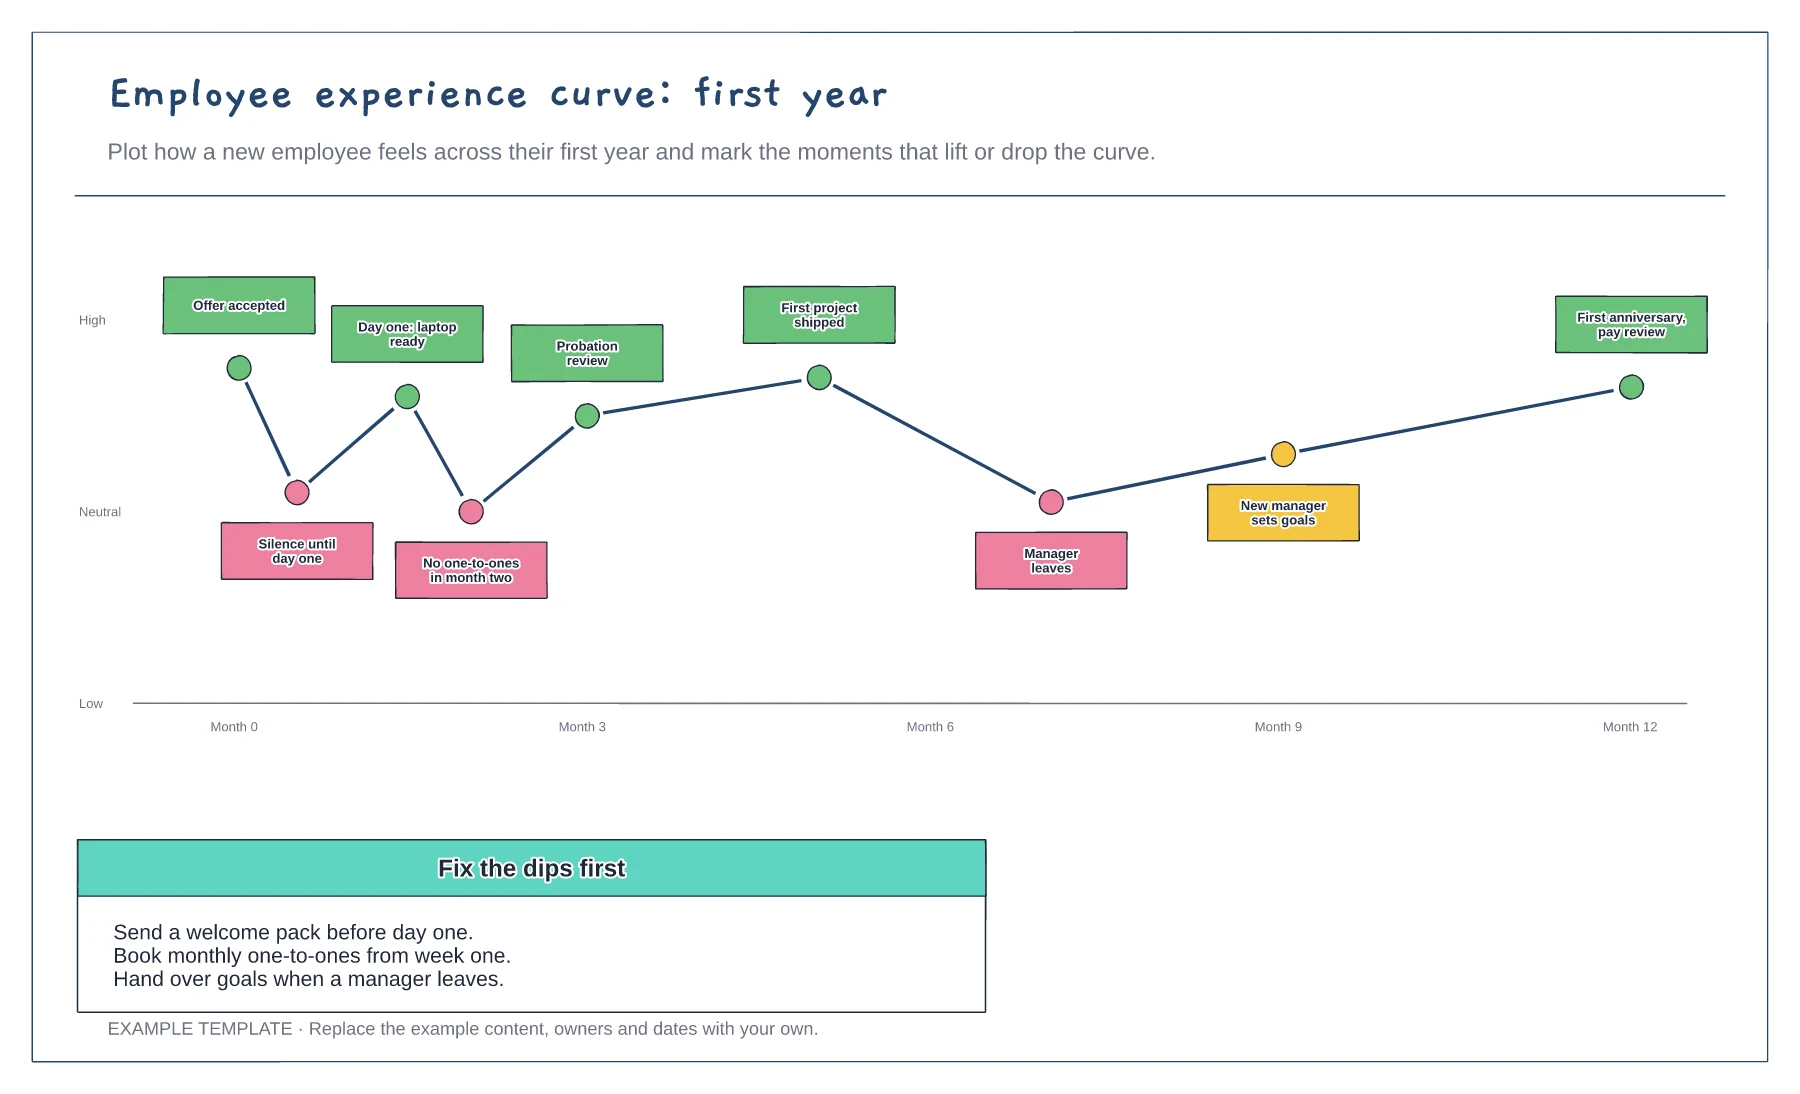
Ask recent starters and leavers about their first year: what felt good, what felt bad, and when.
Place each moment by month and how it felt, then join the points. The shape shows where people struggle.
Pick the deepest dips and agree one change for each, such as a welcome pack before day one.
Move the point for each month to match how new starters rated their experience, then update the moments that lift or drop the curve.
No. Open the template and edit it in your browser. Your work saves on this device. An account is optional if you want to sync your workspace.
Yes. Use Export in the editor to save a PNG, SVG or PDF, or download an editable .epicdraw backup.
Before-start preparation · Day-one and first-week activities · First-month review
Preview and use template →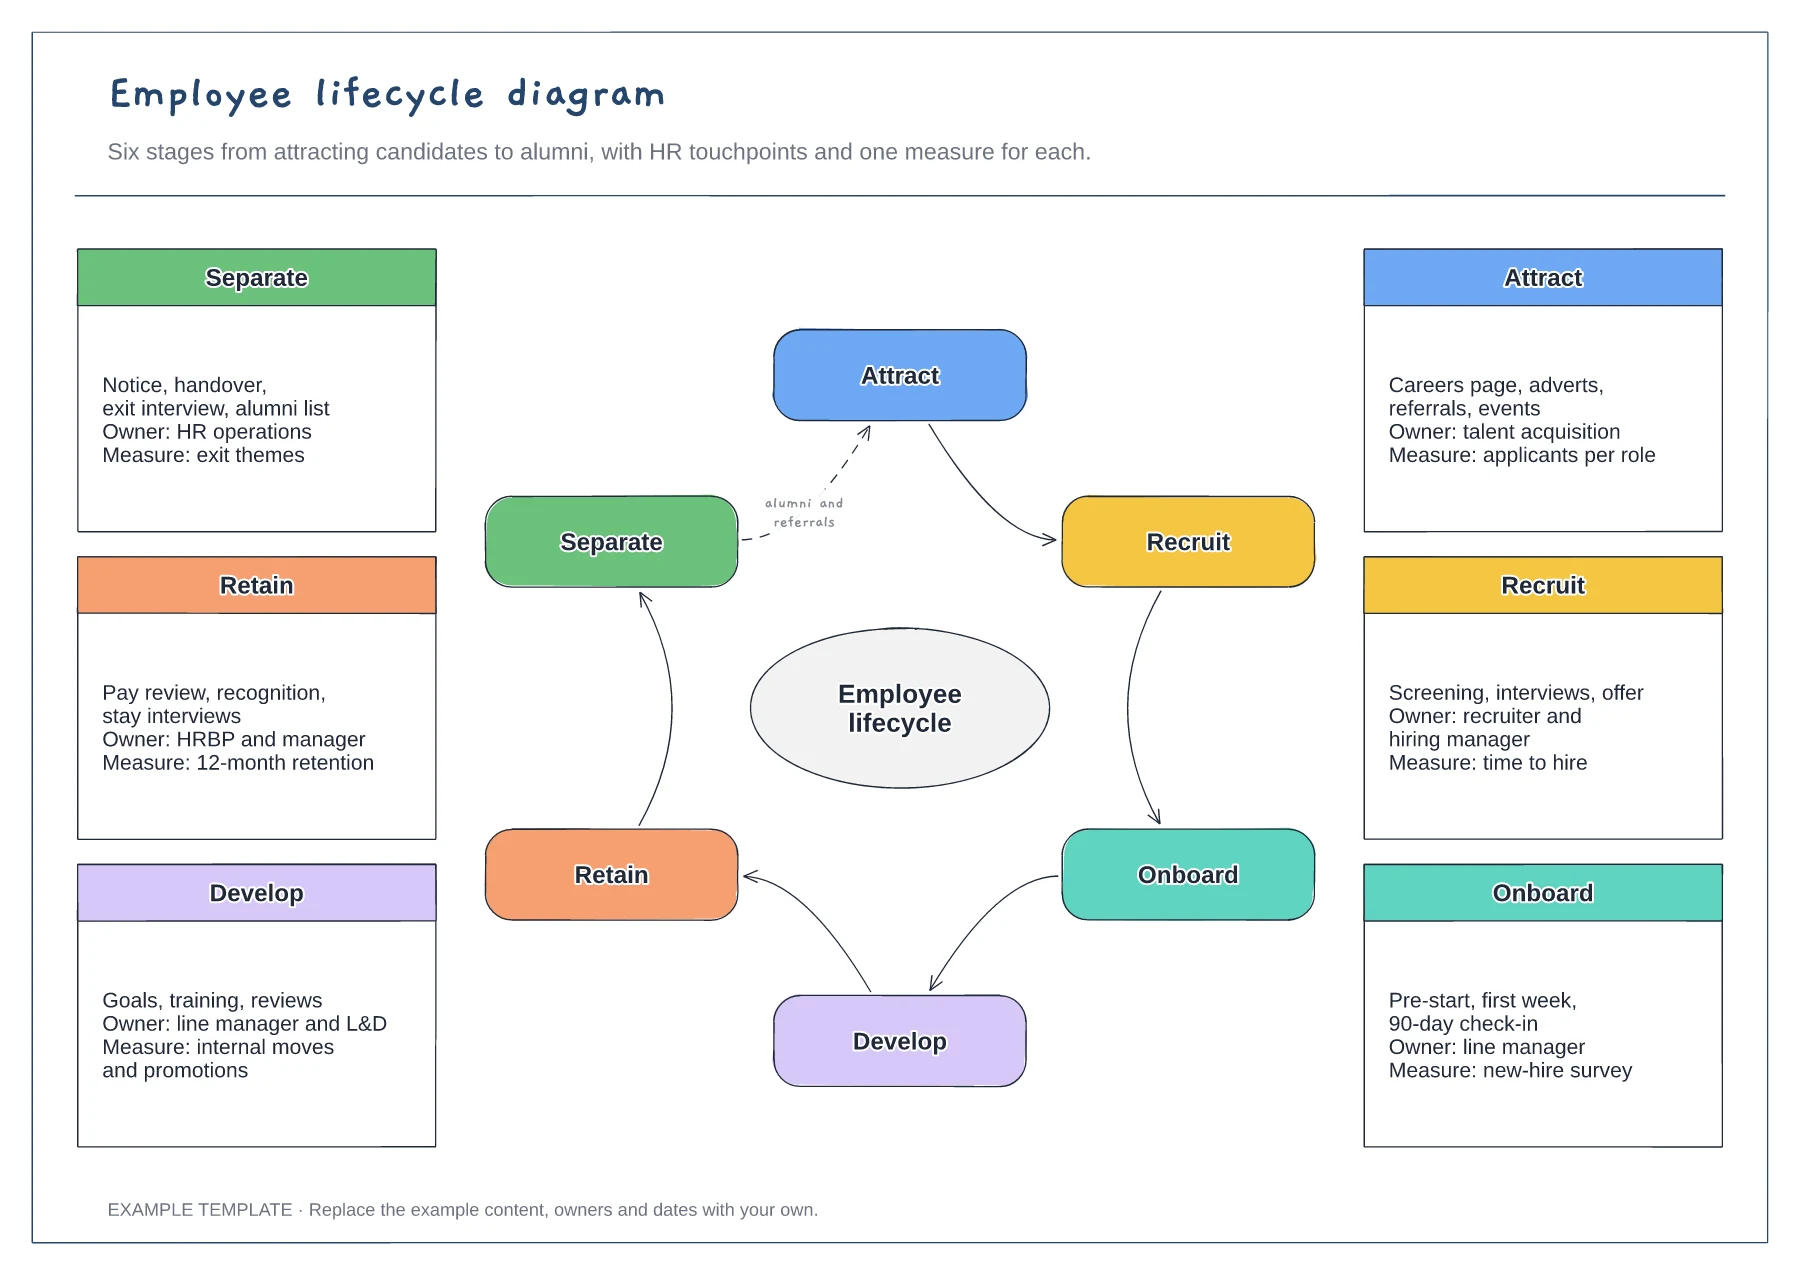
Six stages arranged in a cycle · Touchpoints and owner for each stage · One measure per stage
Preview and use template →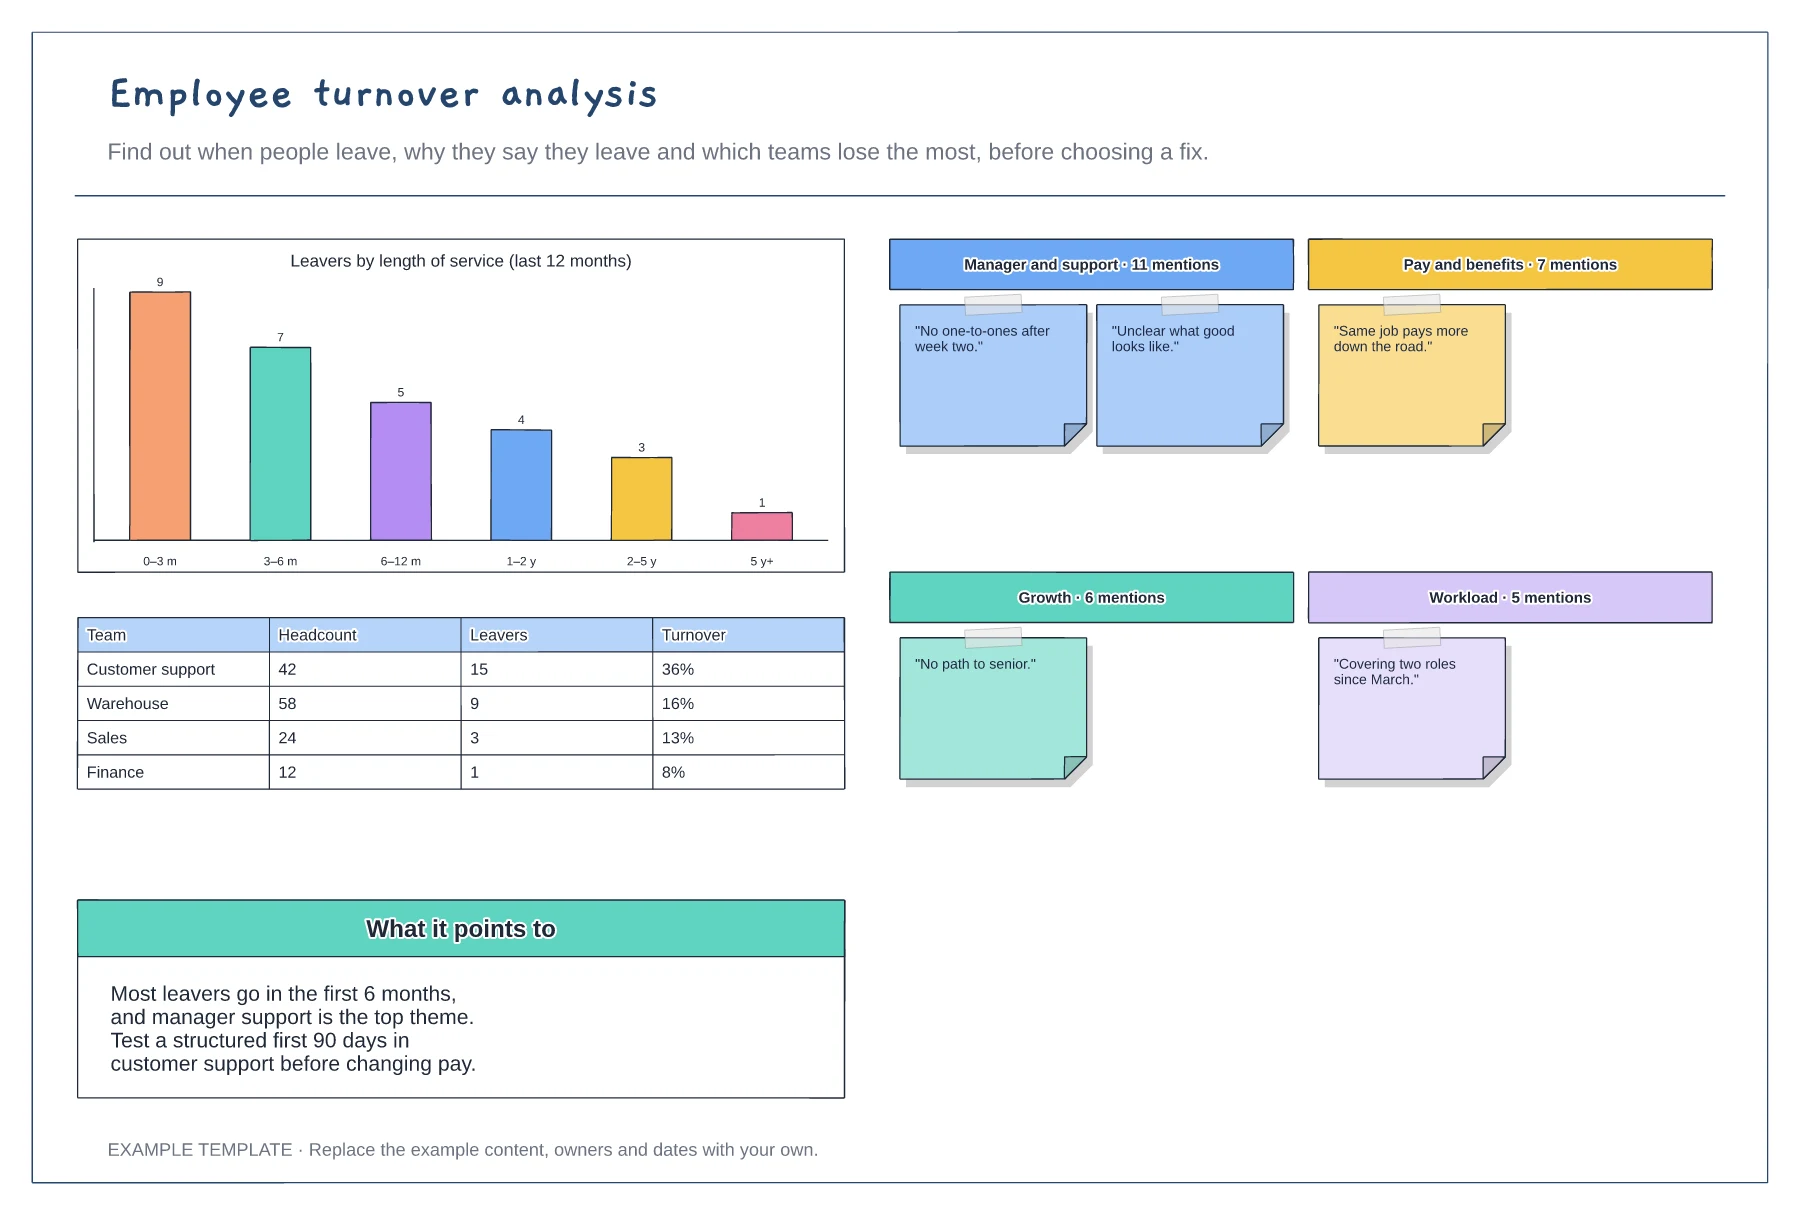
Leavers by length of service · Exit interview themes with quotes · Turnover by team
Preview and use template →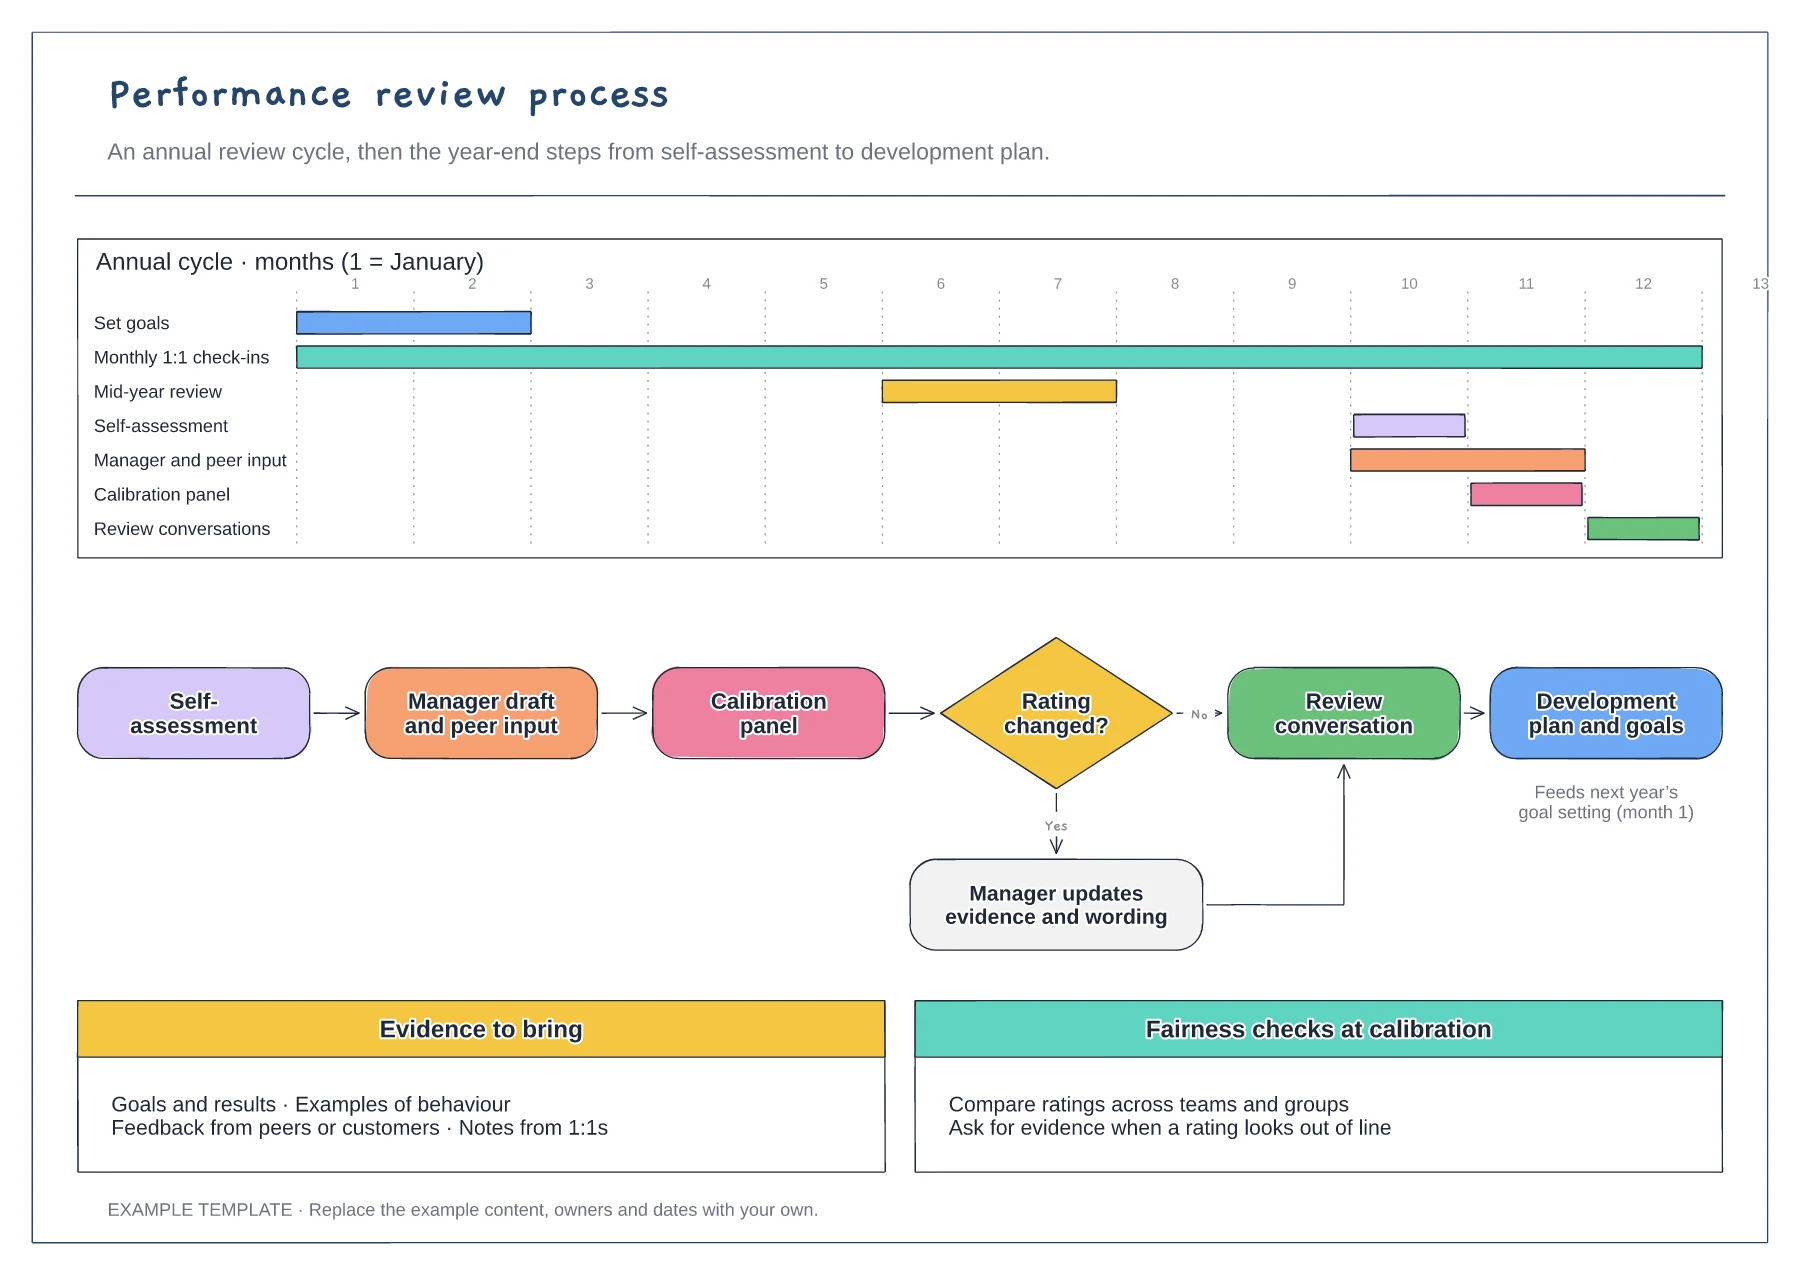
Annual cycle on a Gantt chart · Year-end flow with calibration decision · Evidence and fairness checks
Preview and use template →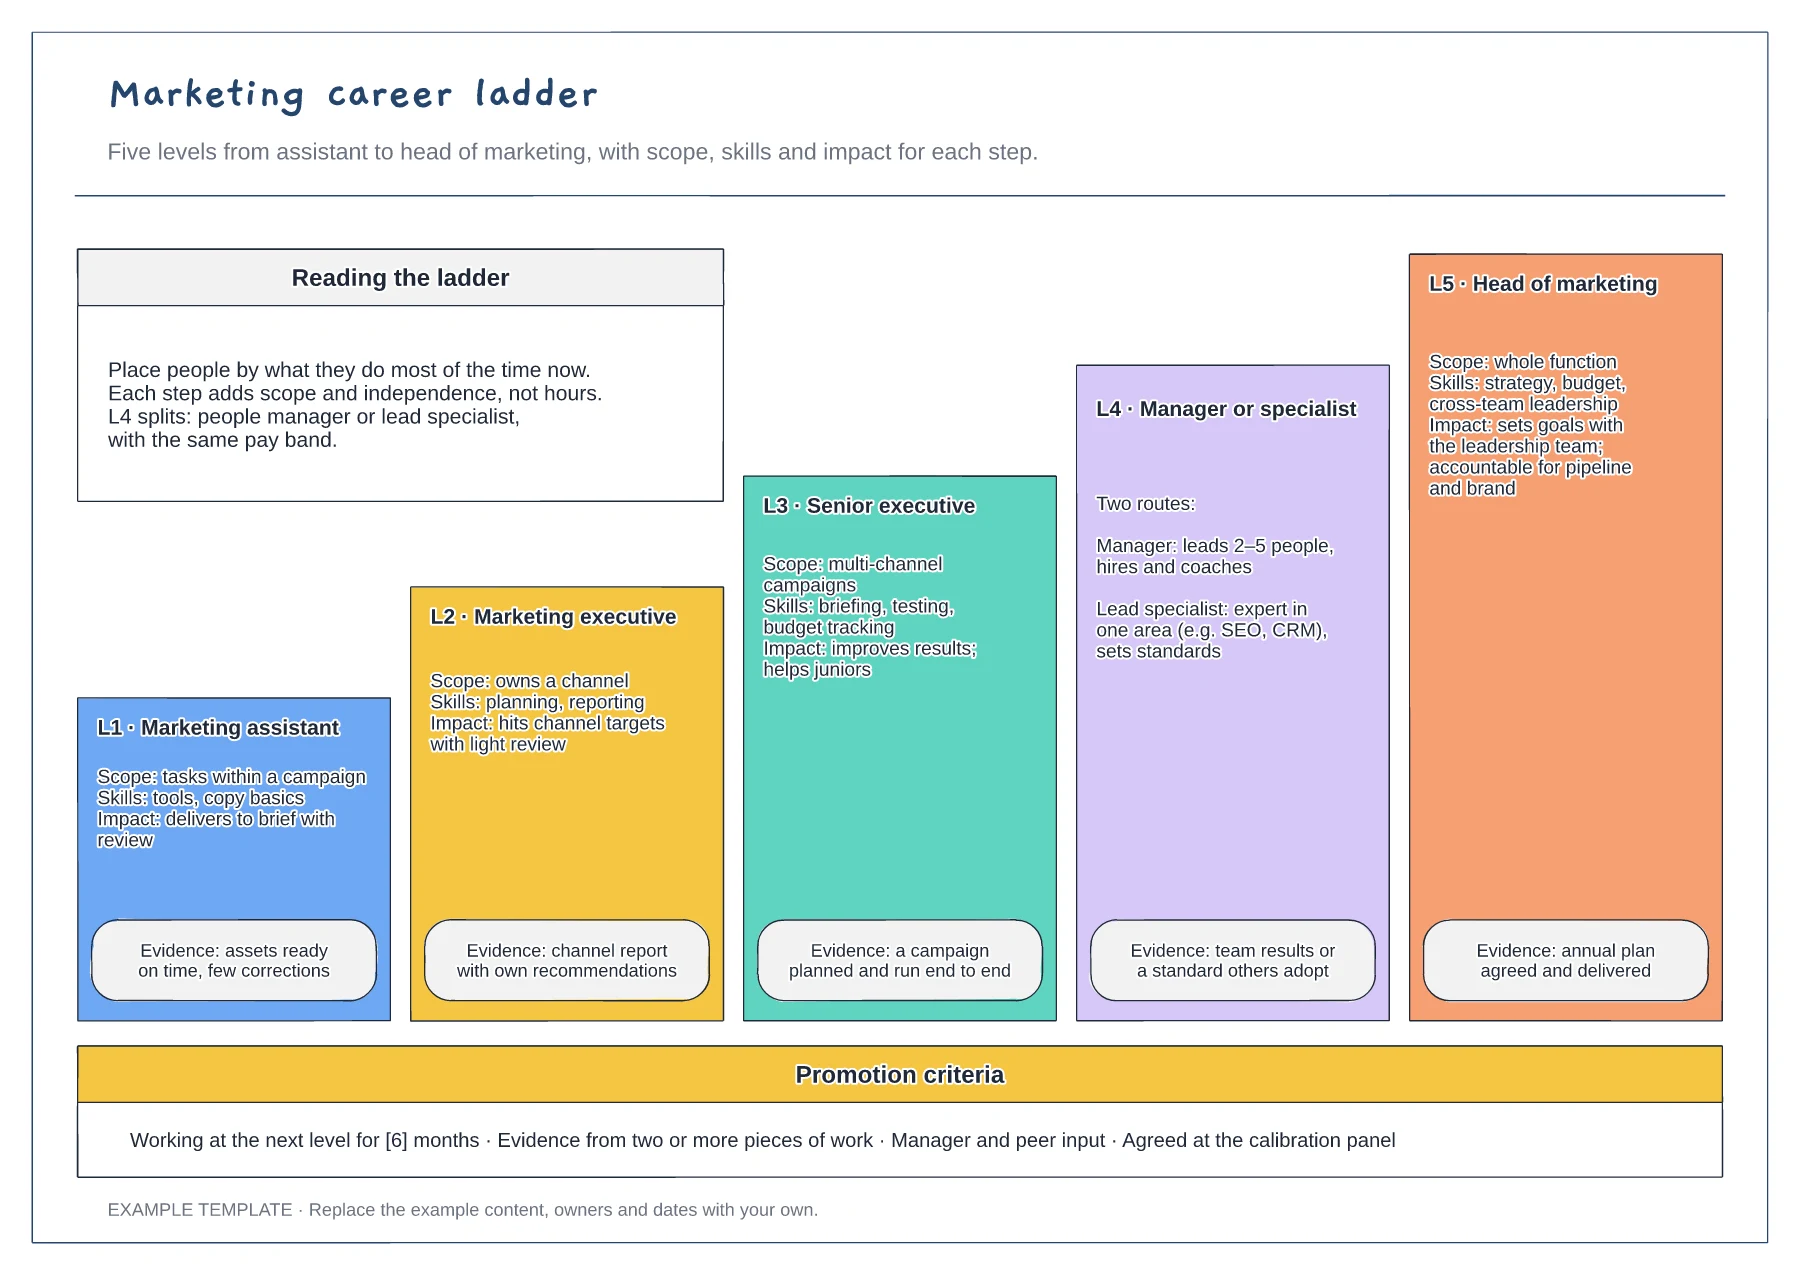
Five levels drawn as a staircase · Scope, skills, impact and evidence · Promotion criteria strip
Preview and use template →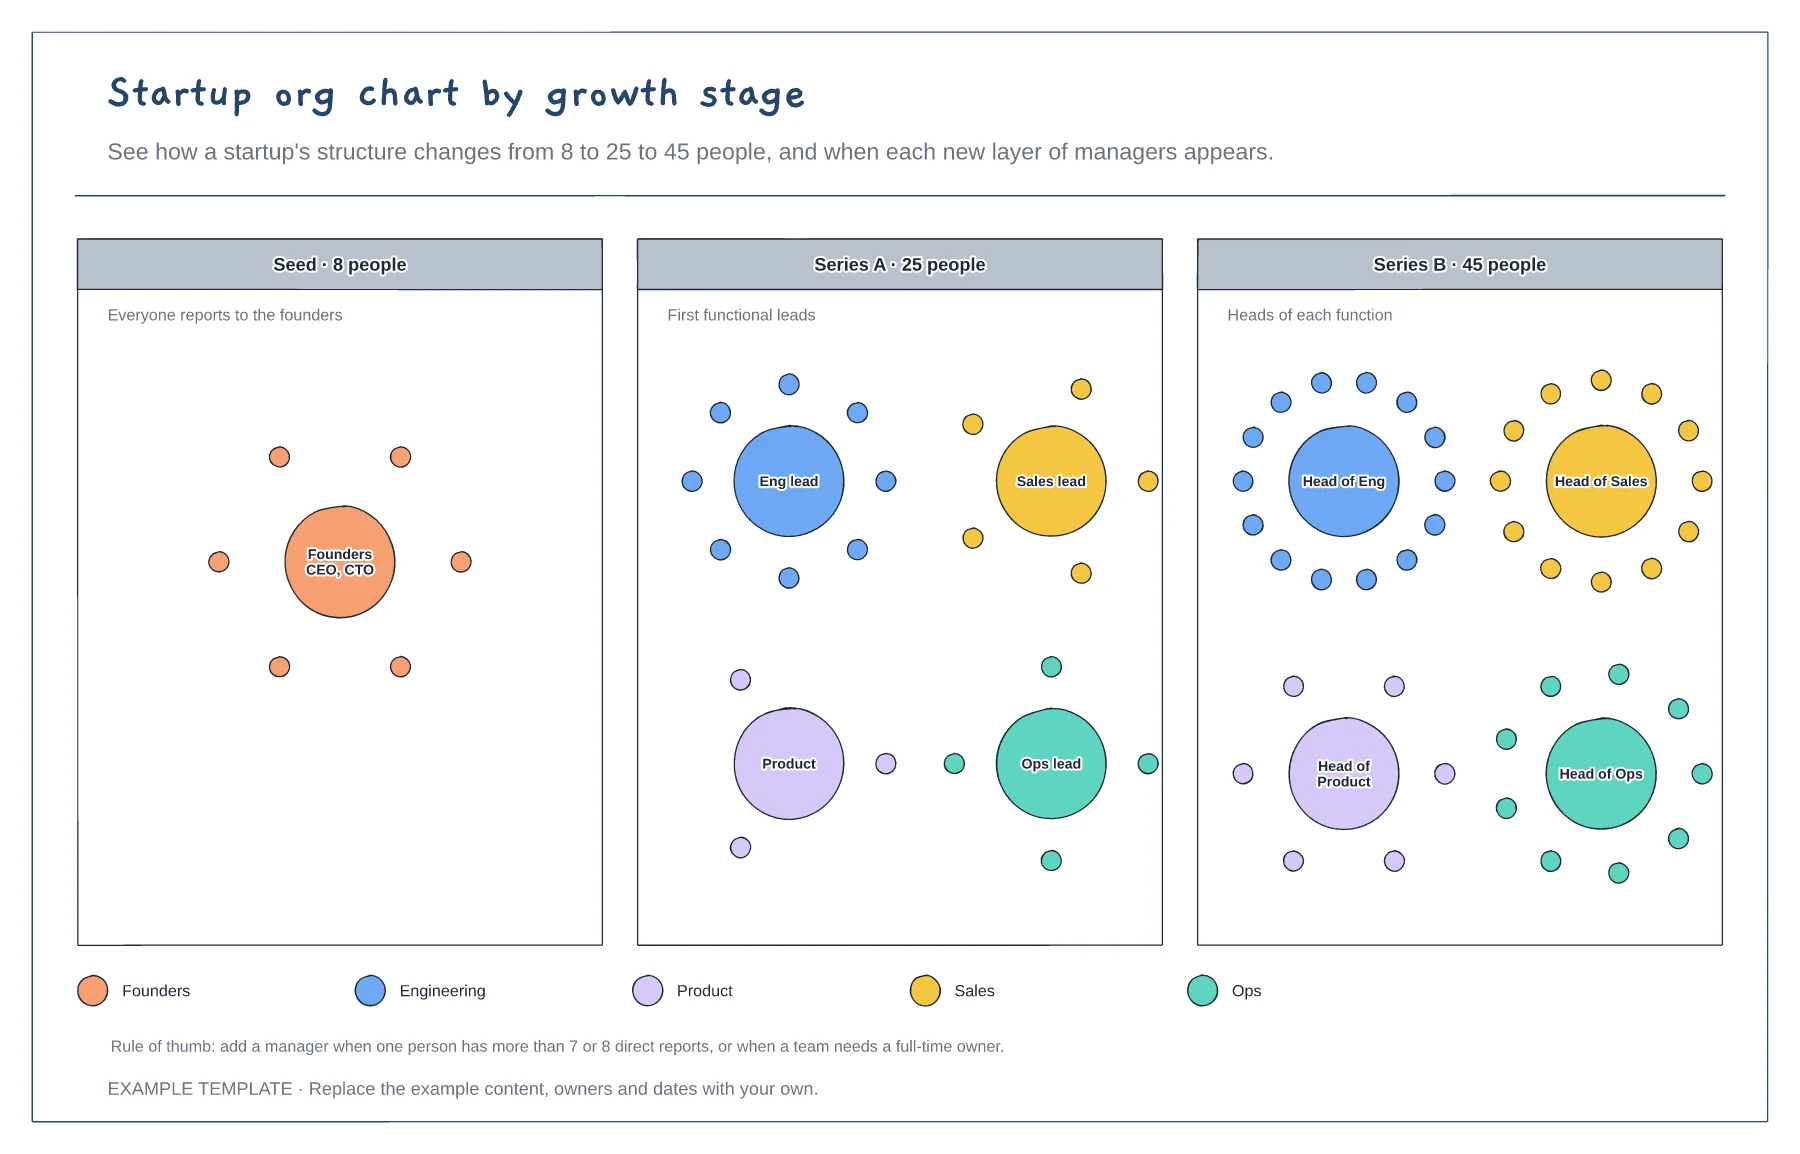
The same company at three headcounts · Clusters of people around each leader · When to add a layer of managers
Preview and use template →