Legal and risk
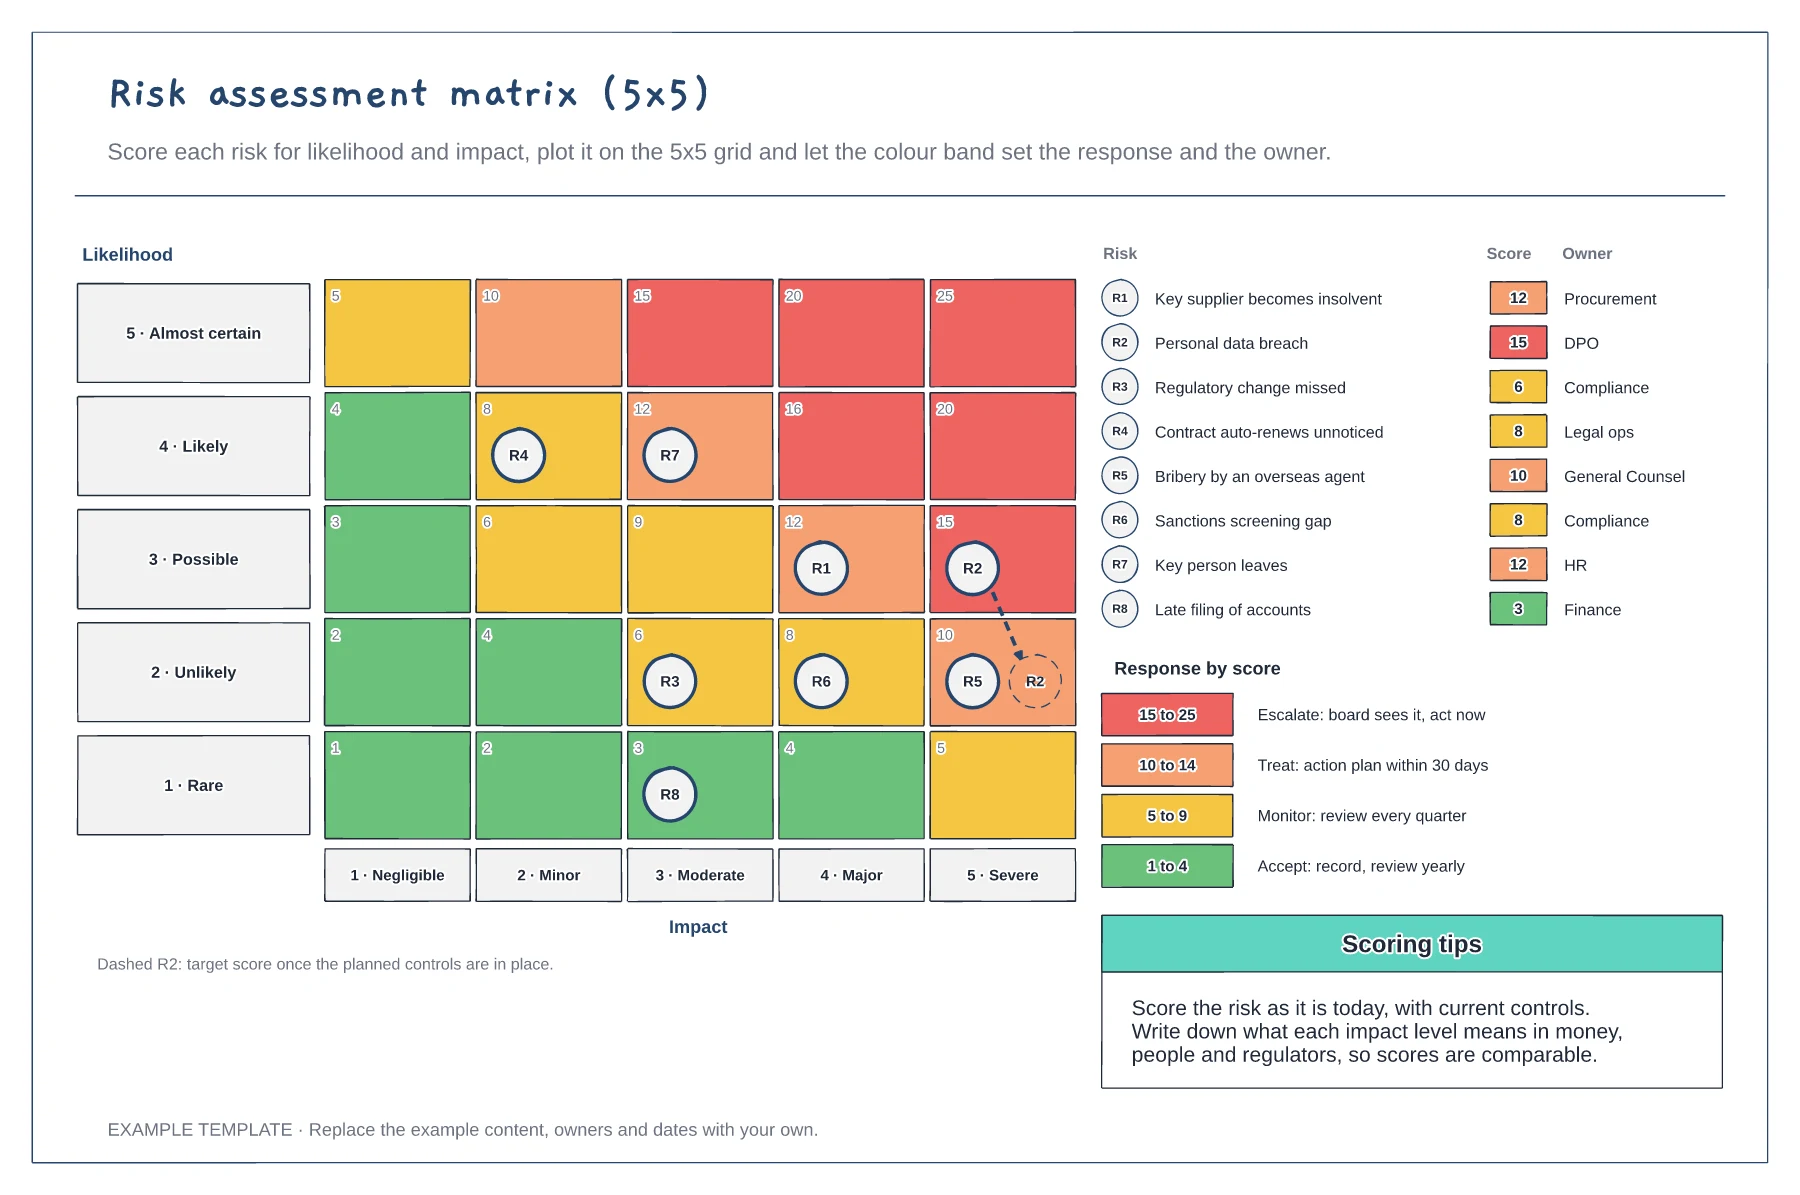
Risk assessment matrix (5x5) template
5x5 grid with scores and colour bands · Eight plotted risks with owners · A response rule for each band
Preview and use template →A bowtie diagram puts one top event in the middle, the threats that could cause it on the left and the consequences that could follow on the right. This example uses customer personal data exposed from a CRM, with two preventive barriers on each threat path, two recovery barriers on each consequence path, colours for barriers that are weak or untested and an escalation factor that could defeat a barrier.
This is a planning example, not legal advice. Check your own policies, advisers and the local rules that apply to you.
No account needed · Opens as your own editable page
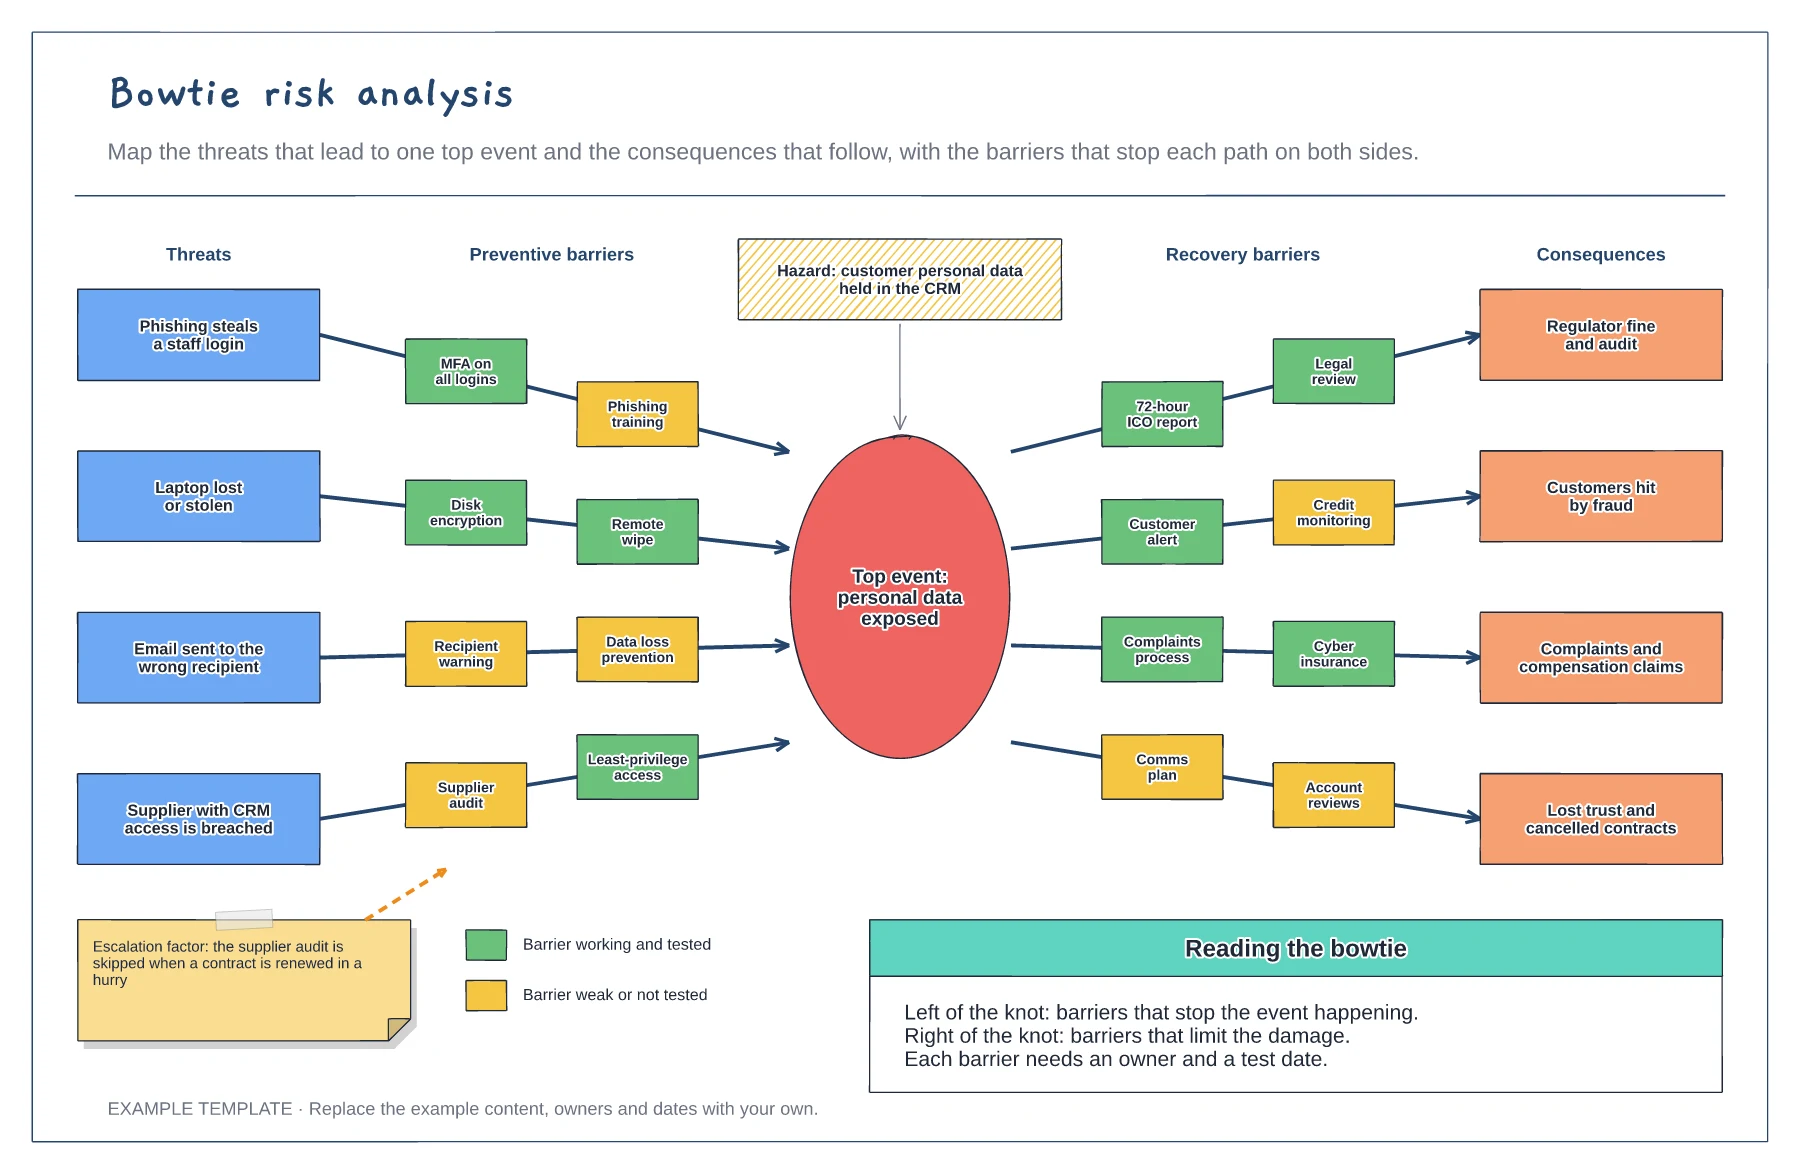
The hazard is the thing you hold or do, such as personal data in a CRM. The top event is the moment you lose control of it.
List what could cause the top event and what could follow from it. Keep each one specific enough to attach a barrier to.
Place each control on the path it blocks and colour it by how well it works. Add escalation factors that could make a barrier fail.
Yes. Add a threat on the left or a consequence on the right, then add the barriers between it and the top event in the centre.
No. Open the template and edit it in your browser. Your work saves on this device. An account is optional if you want to sync your workspace.
Yes. Use Export in the editor to save a PNG, SVG or PDF, or download an editable .epicdraw backup.
5x5 grid with scores and colour bands · Eight plotted risks with owners · A response rule for each band
Preview and use template →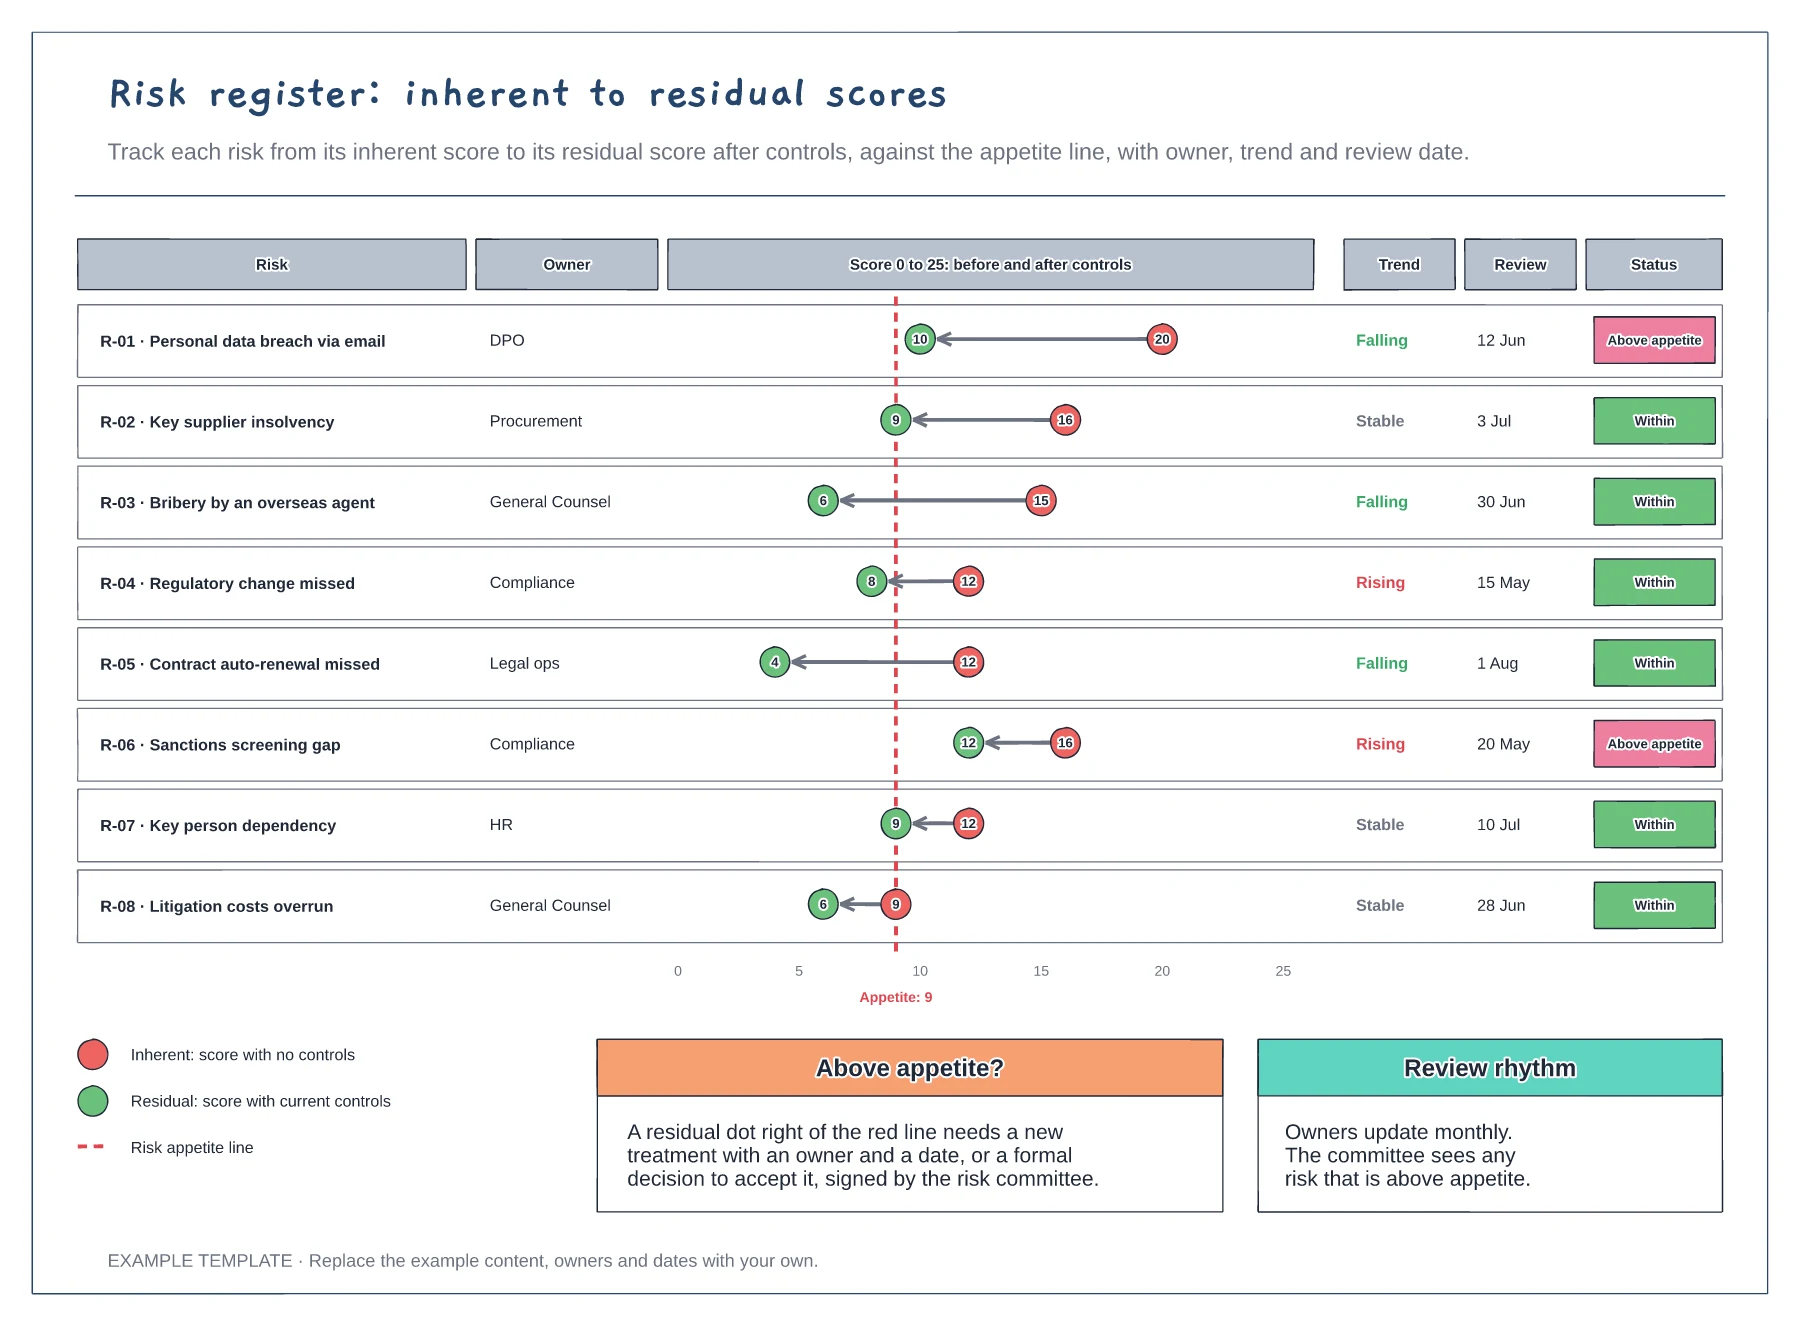
Eight risks with owners and review dates · Inherent to residual bars on one scale · Risk appetite line and status flags
Preview and use template →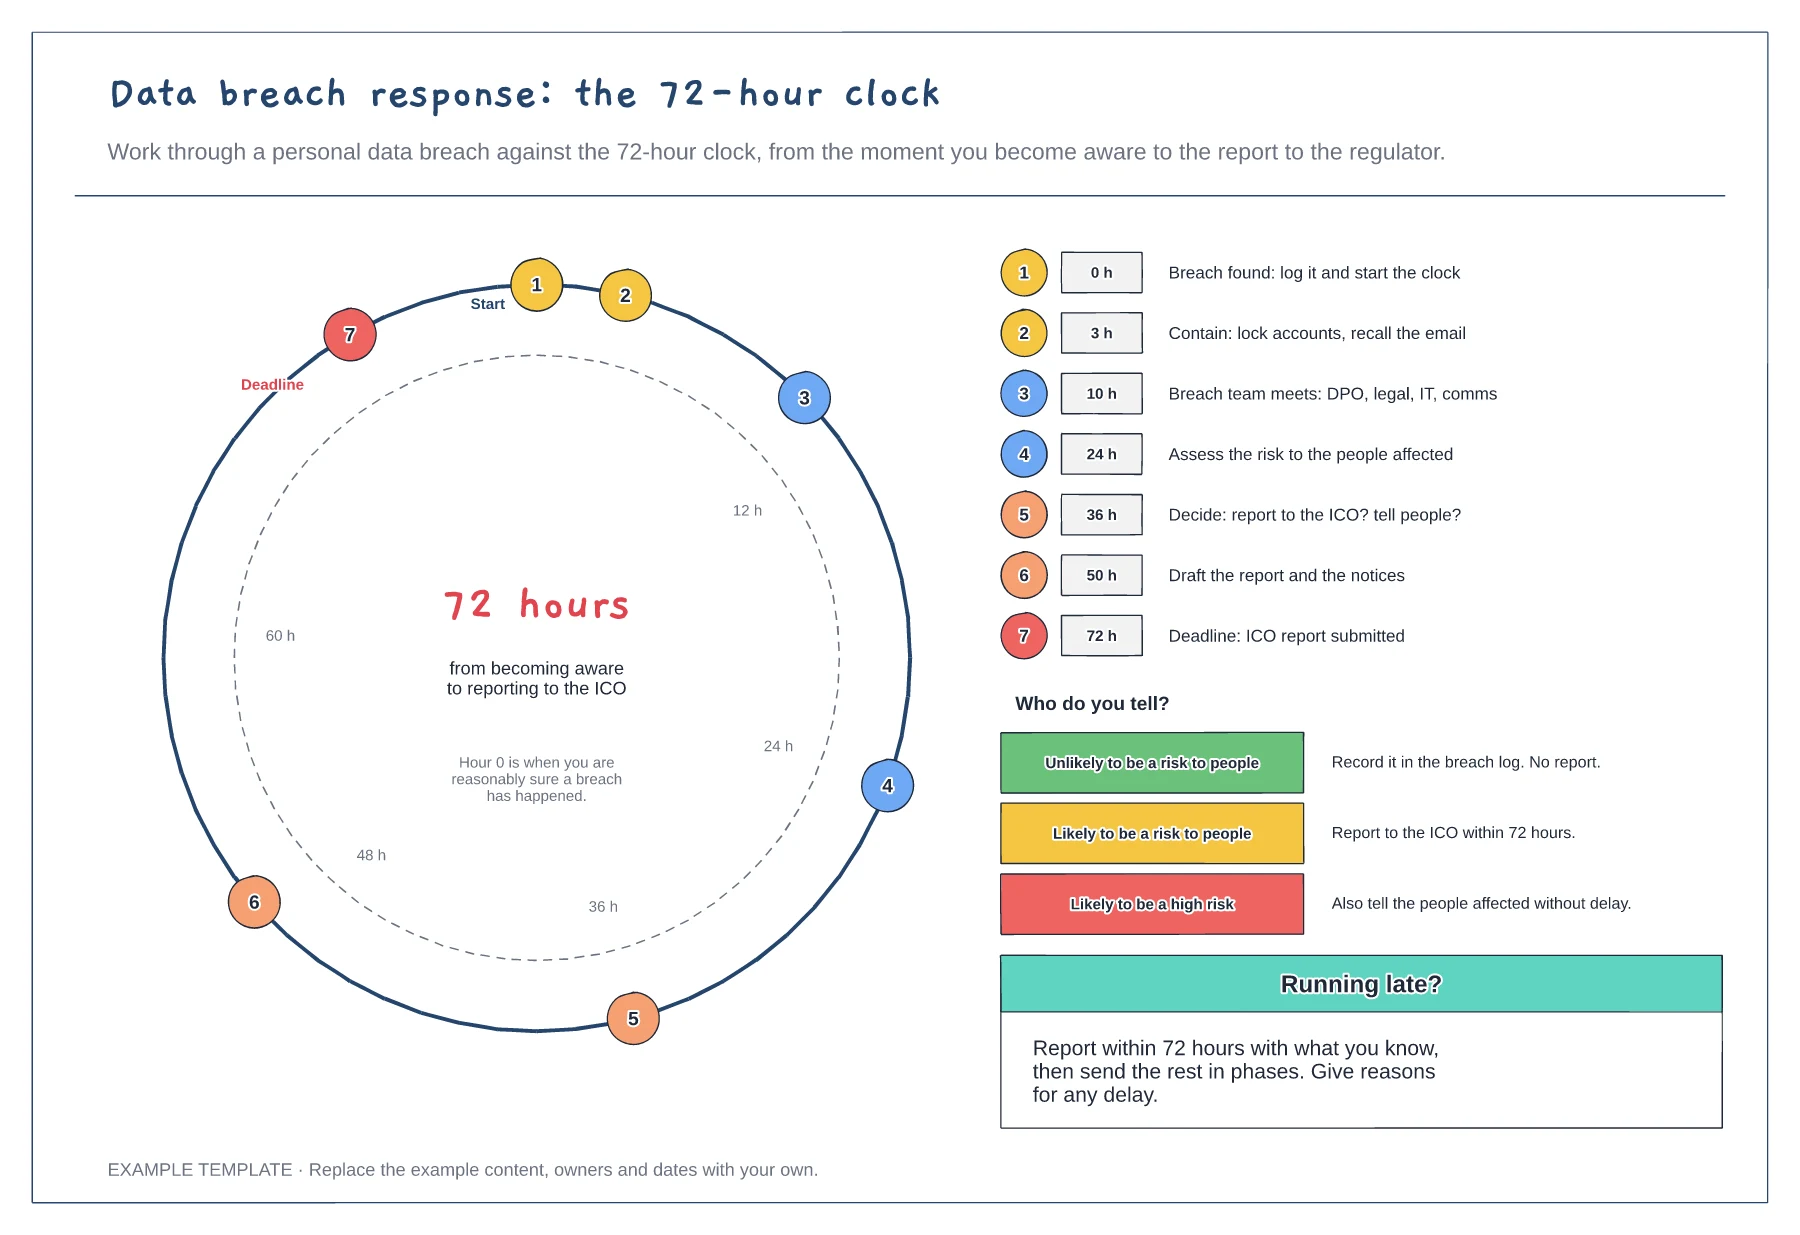
72-hour dial with timed steps · Step list with target hours · Who to tell at each level of risk
Preview and use template →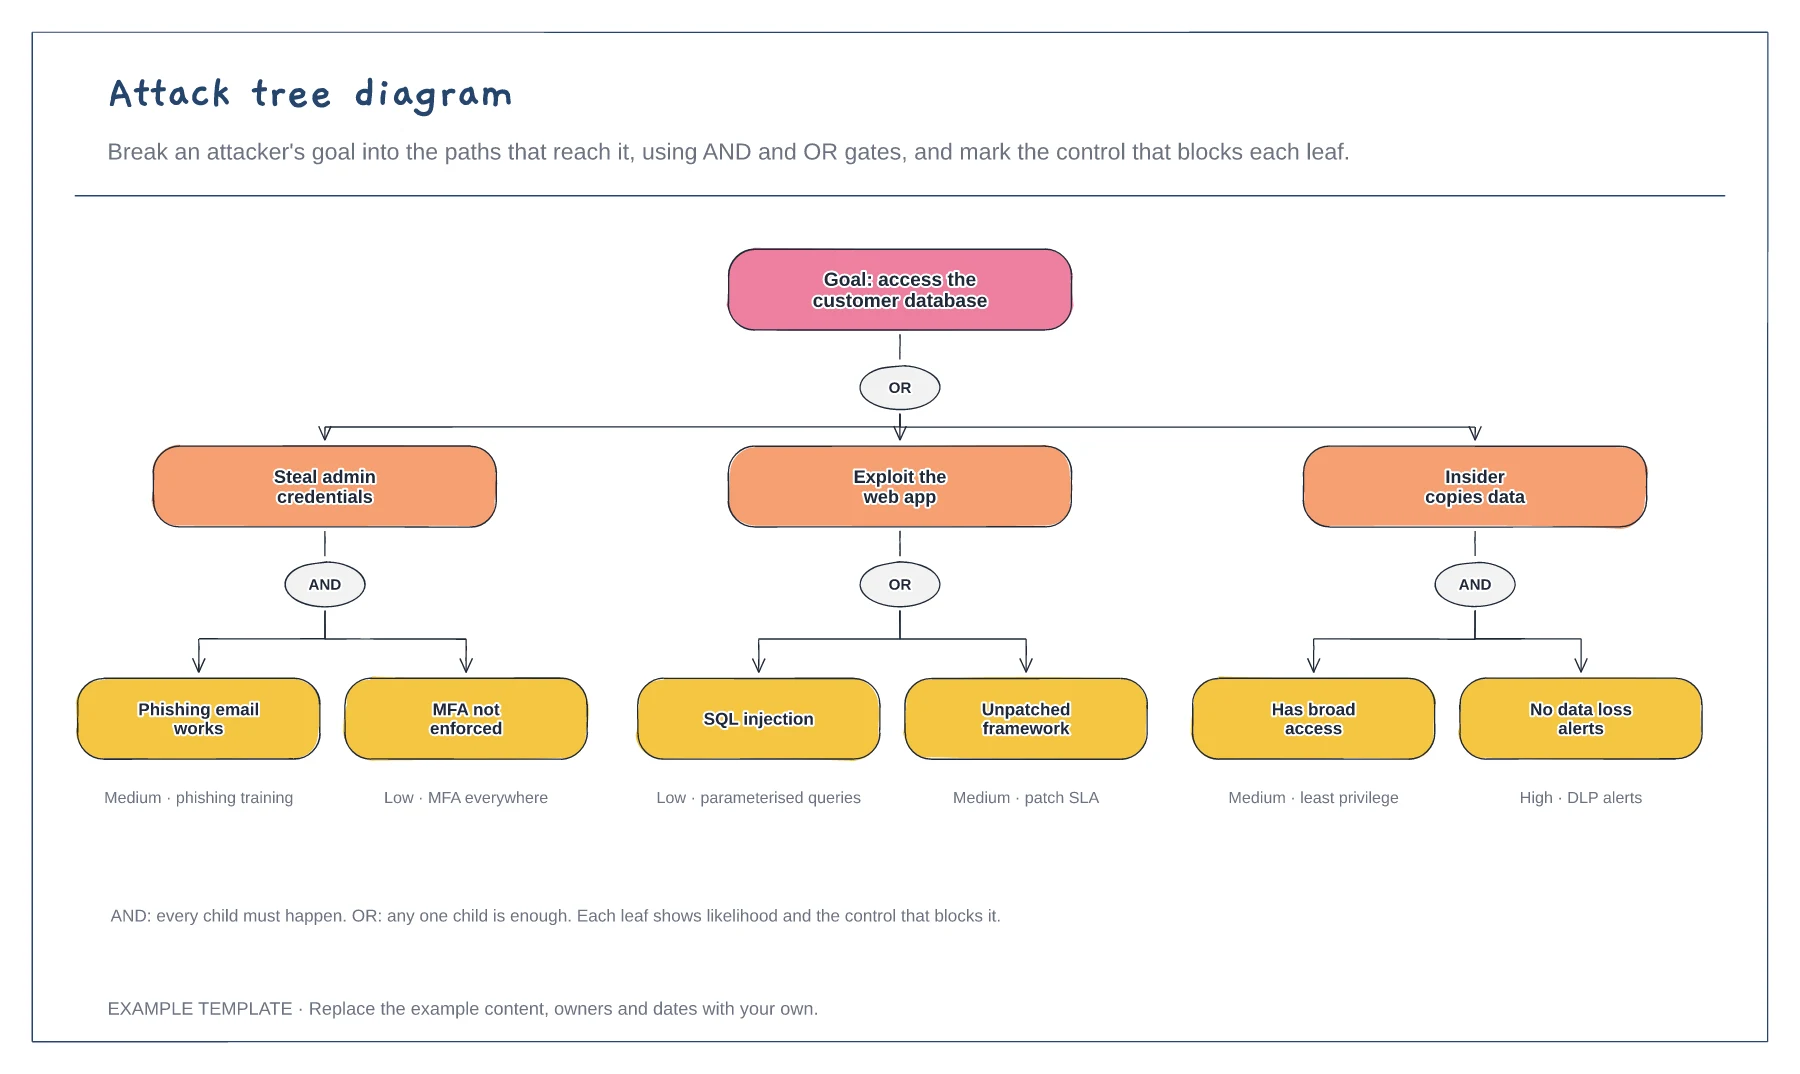
Goal broken into three attack paths · AND and OR gates · Likelihood and control on each leaf
Preview and use template →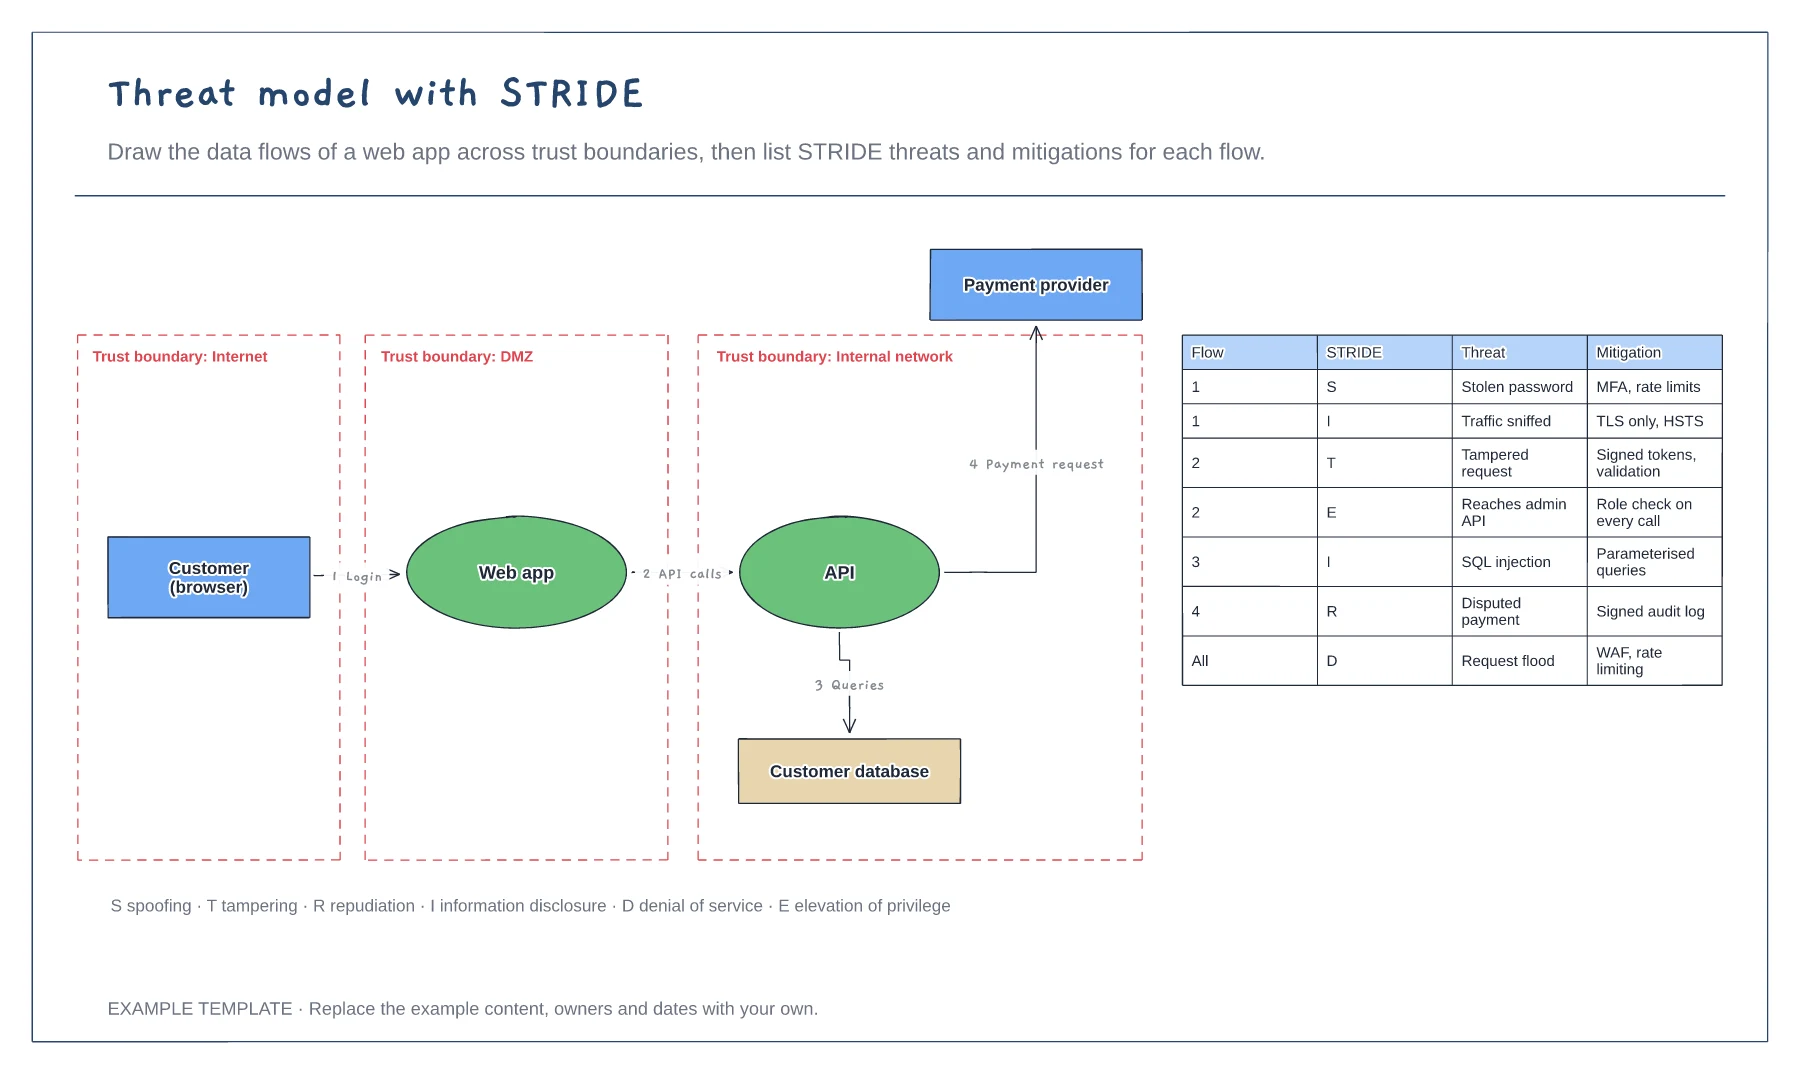
Data flow diagram with trust boundaries · Numbered flows between components · STRIDE threat and mitigation table
Preview and use template →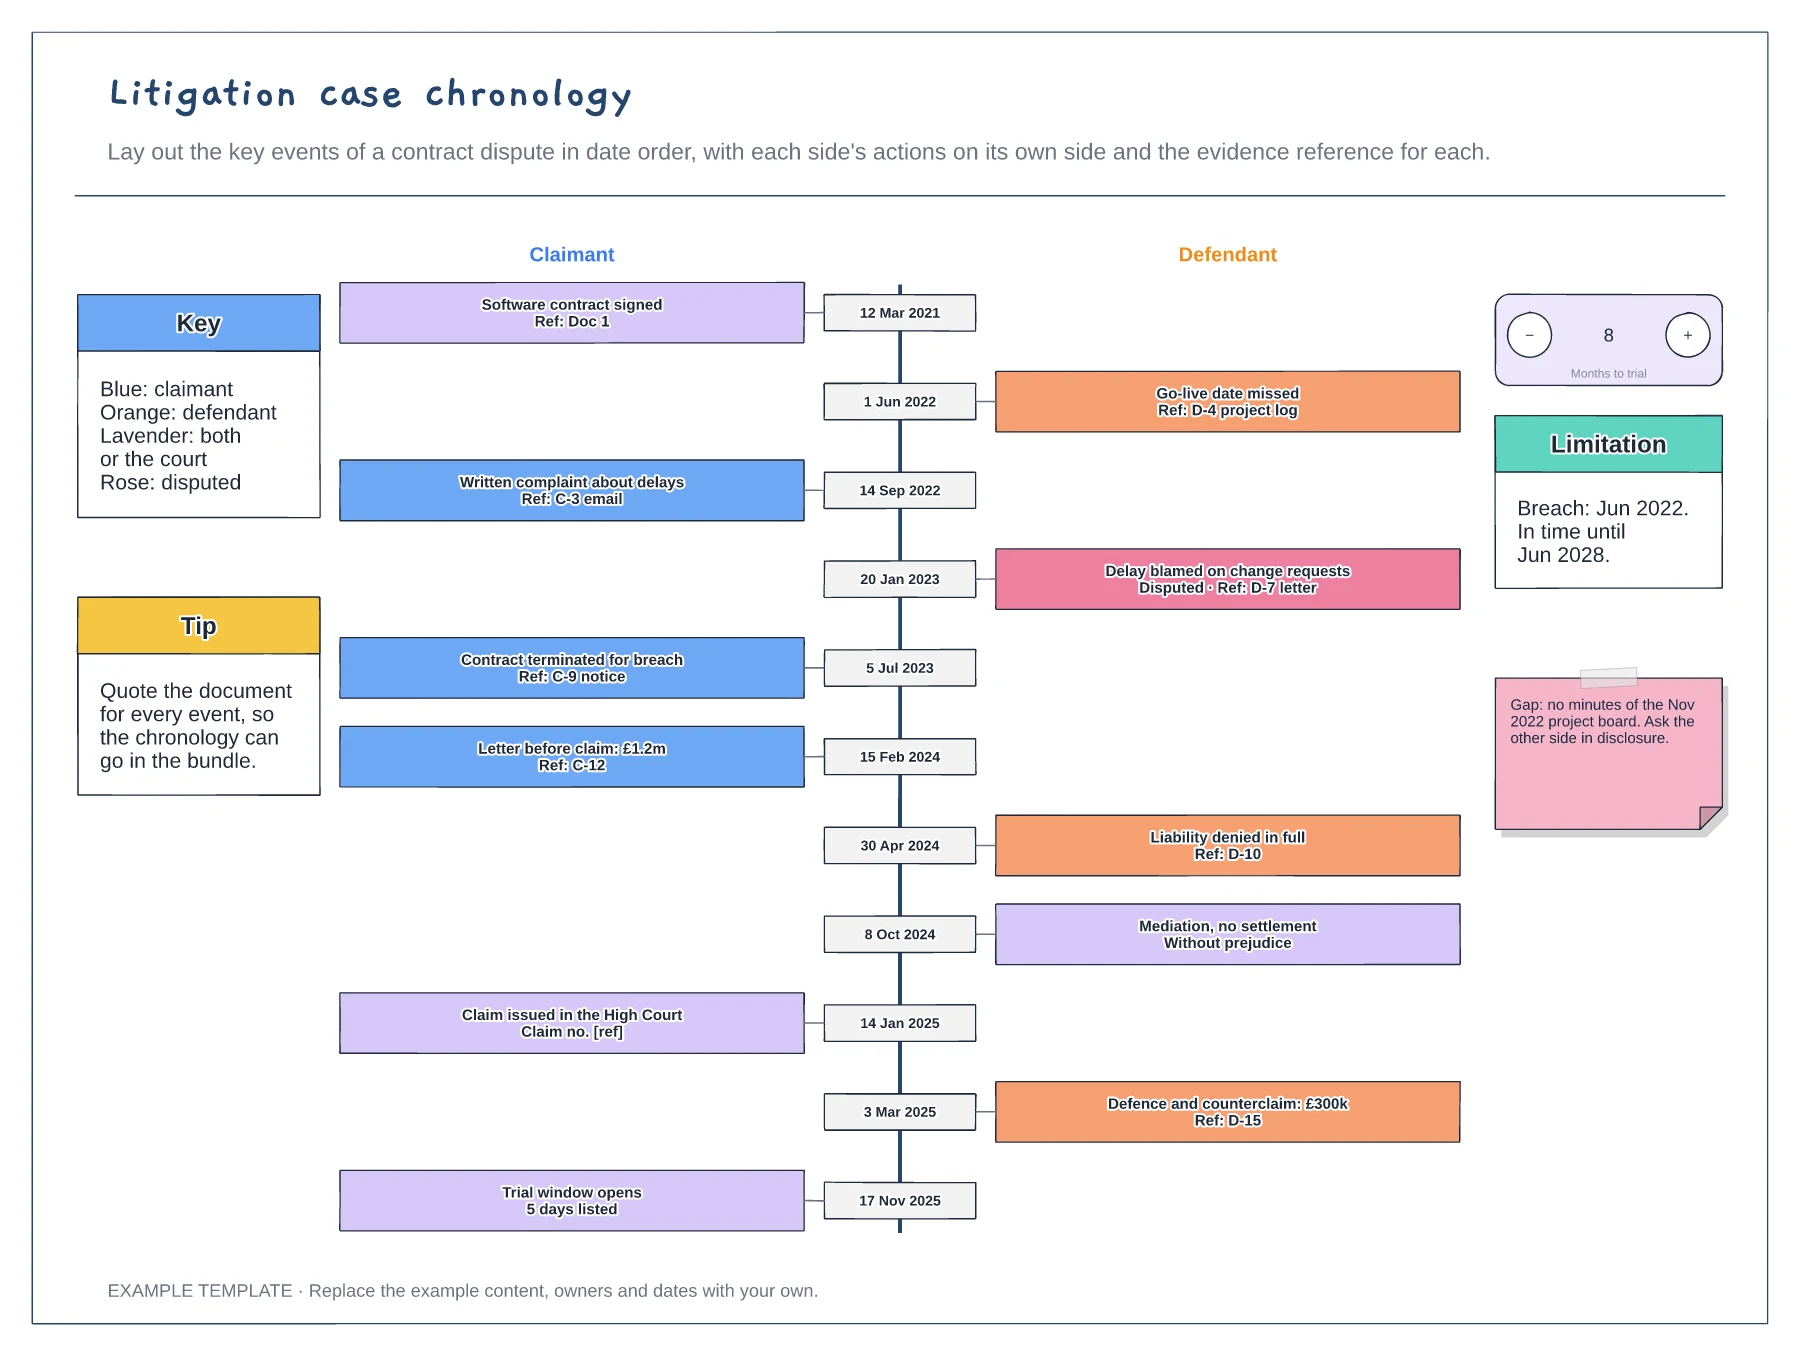
Eleven dated events on a central spine · Evidence reference on every event · Disputed facts, gaps and limitation date
Preview and use template →