Finance
Accounting cycle diagram template
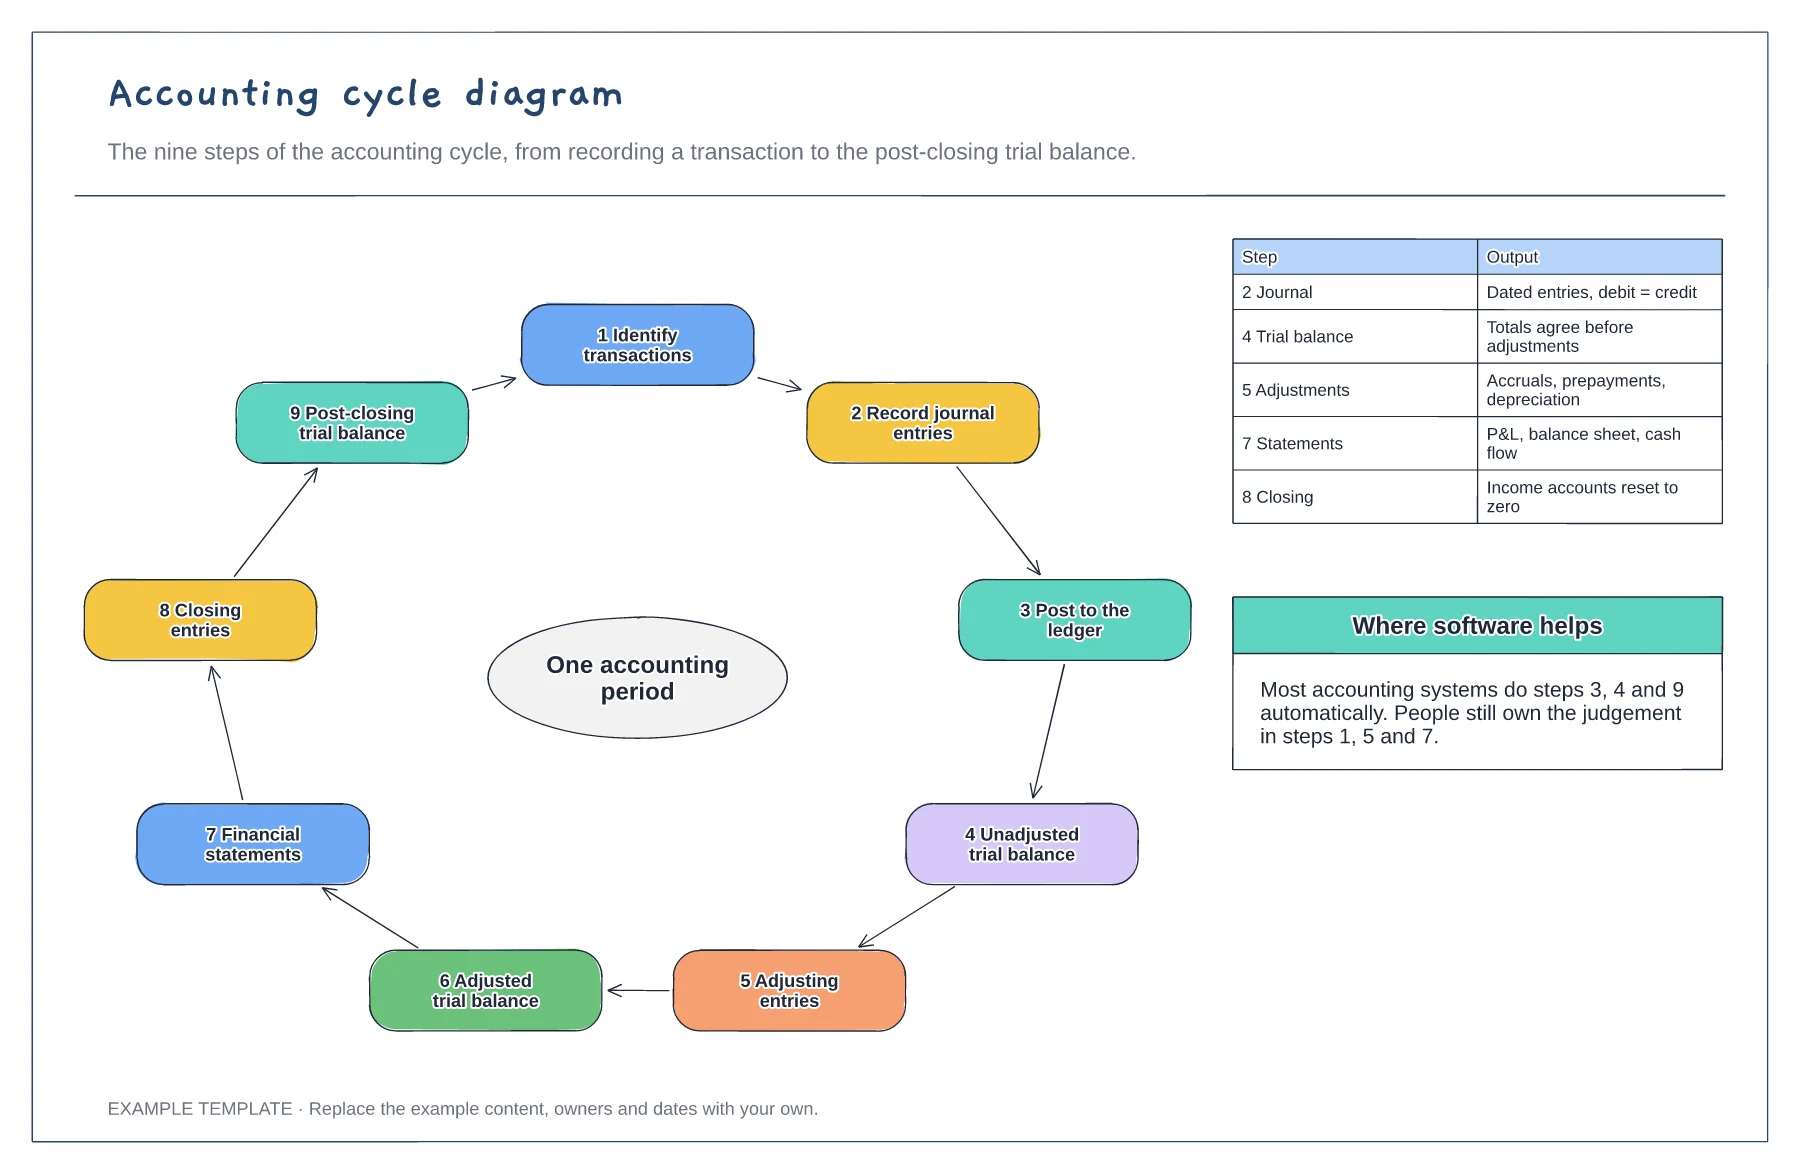
Nine steps in a loop · Output of the key steps · Where software does the work
Preview and use template →An accounting system data flow diagram shows where financial data comes from, which process handles it and where it is stored. This example covers a small business, with customers, suppliers, employees, the bank and the tax authority as external entities, five processes and three ledgers feeding the general ledger and reporting.
This is a planning example, not financial, accounting, tax or legal advice. Check your own policies, auditors and local rules.
No account needed · Opens as your own editable page
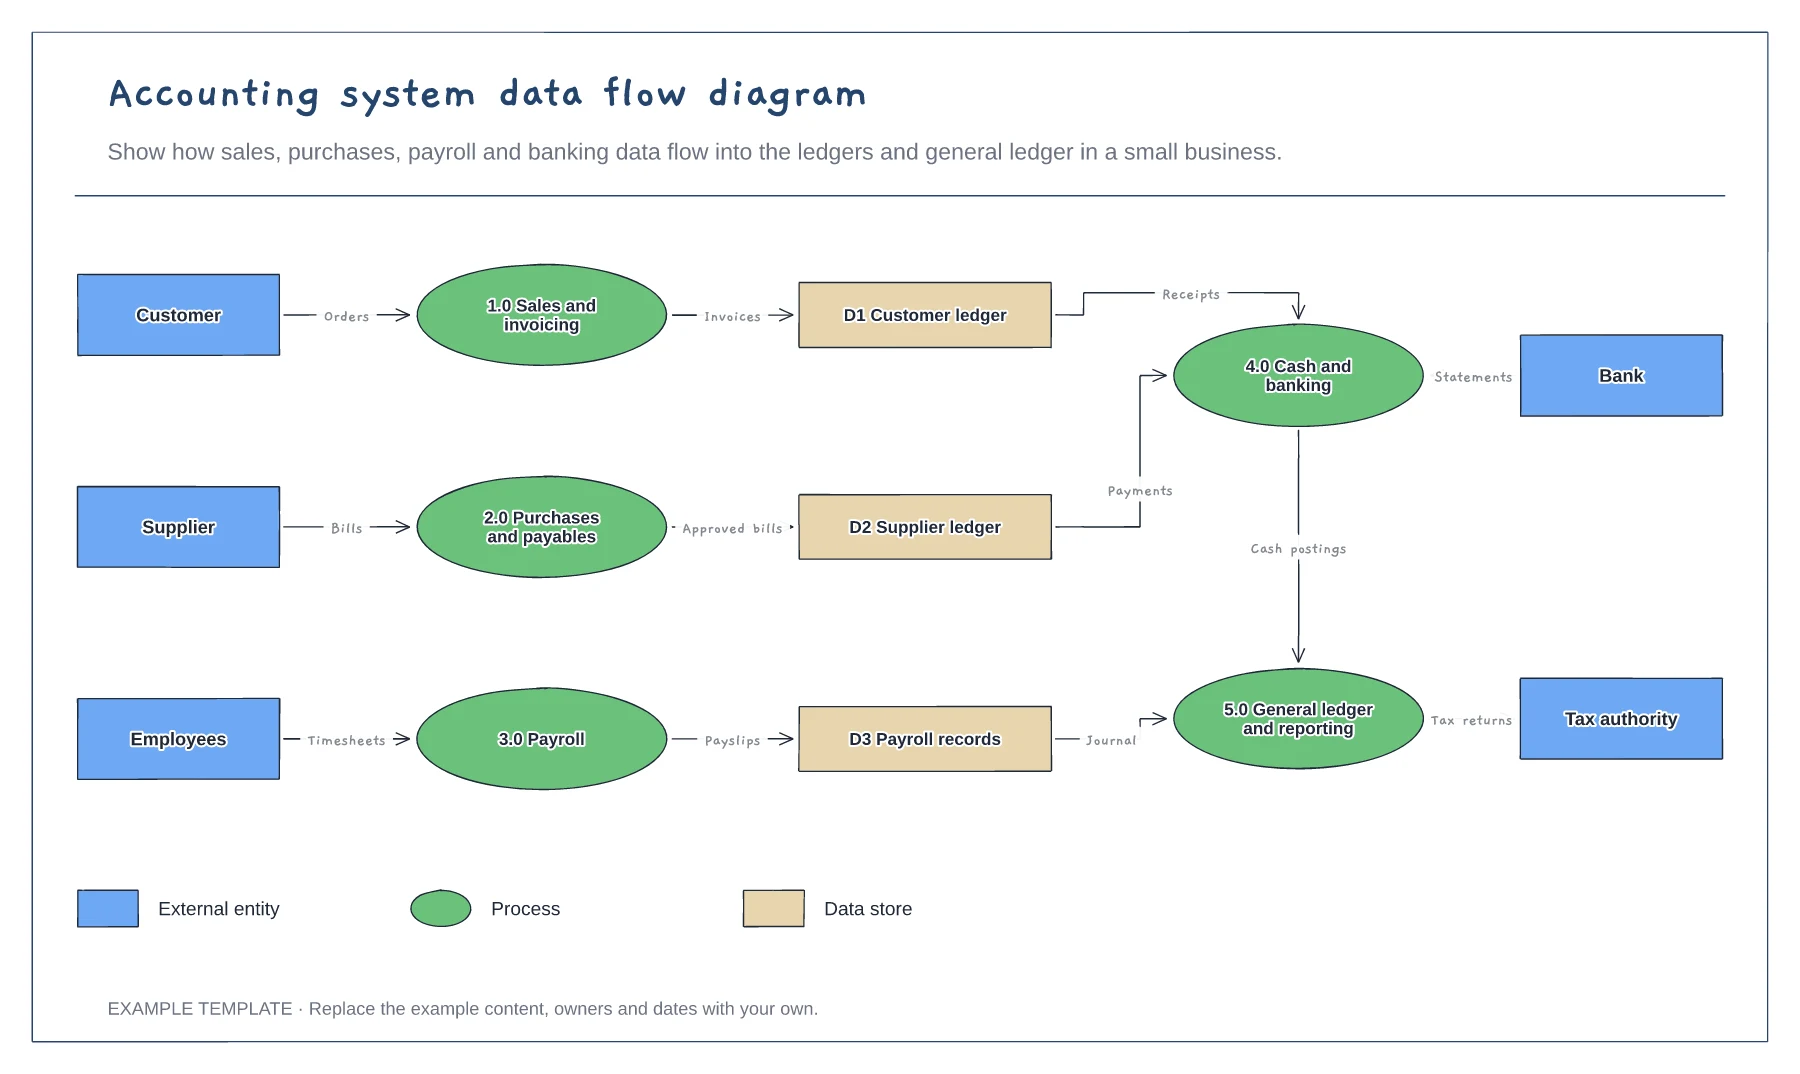
List the people and organisations that send or receive financial data, such as customers, suppliers, banks and tax authorities.
Draw each process that transforms data and the ledgers or files where it is kept. Number them so you can refer to them.
Write what data moves along each arrow. Unlabelled arrows hide where data is entered twice or not at all.
Use the shape legend on the board: it shows which shapes are external entities, processes and data stores. Each arrow is labelled with the data it carries.
No. Open the template and edit it in your browser. Your work saves on this device. An account is optional if you want to sync your workspace.
Yes. Use Export in the editor to save a PNG, SVG or PDF, or download an editable .epicdraw backup.
Nine steps in a loop · Output of the key steps · Where software does the work
Preview and use template →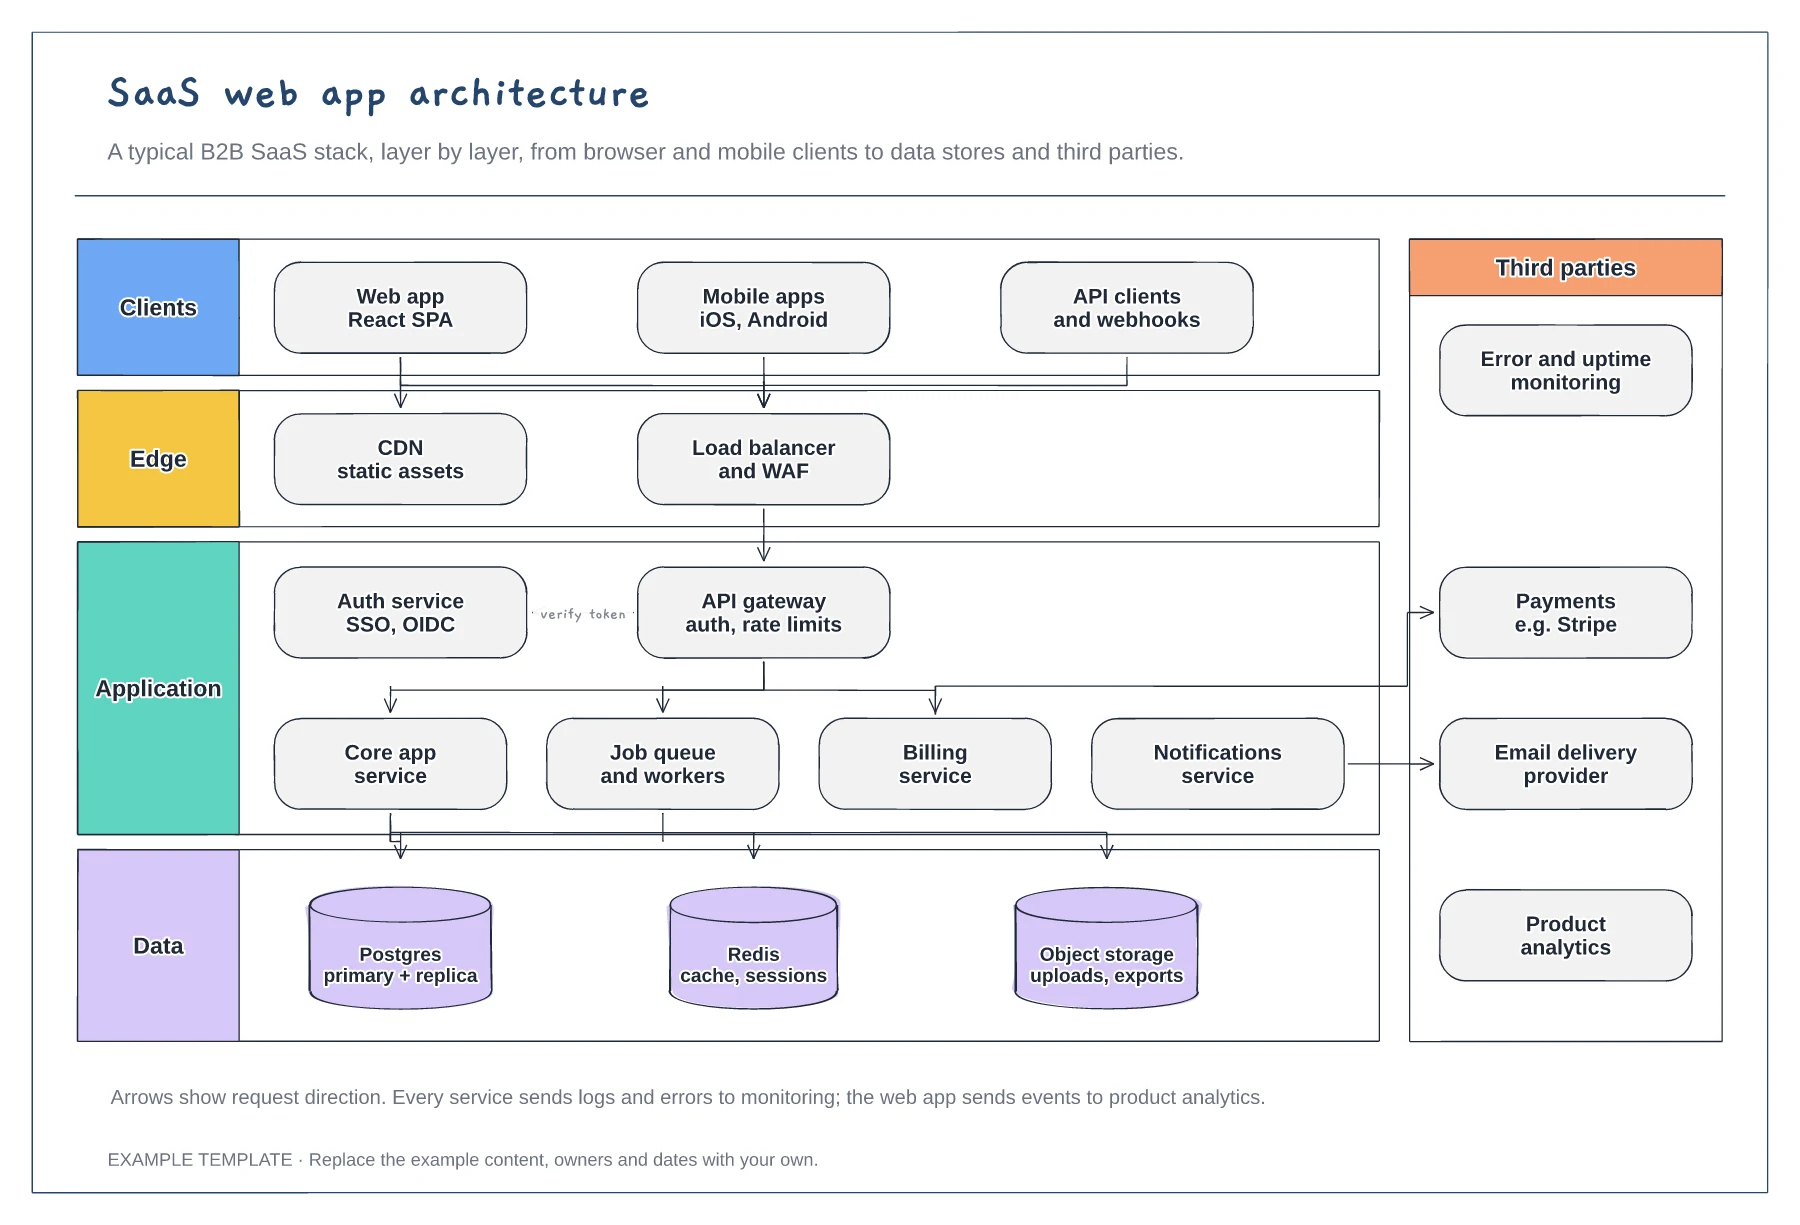
Client, edge, application and data layers · Services behind an API gateway and auth service · Third parties such as payments and email
Preview and use template →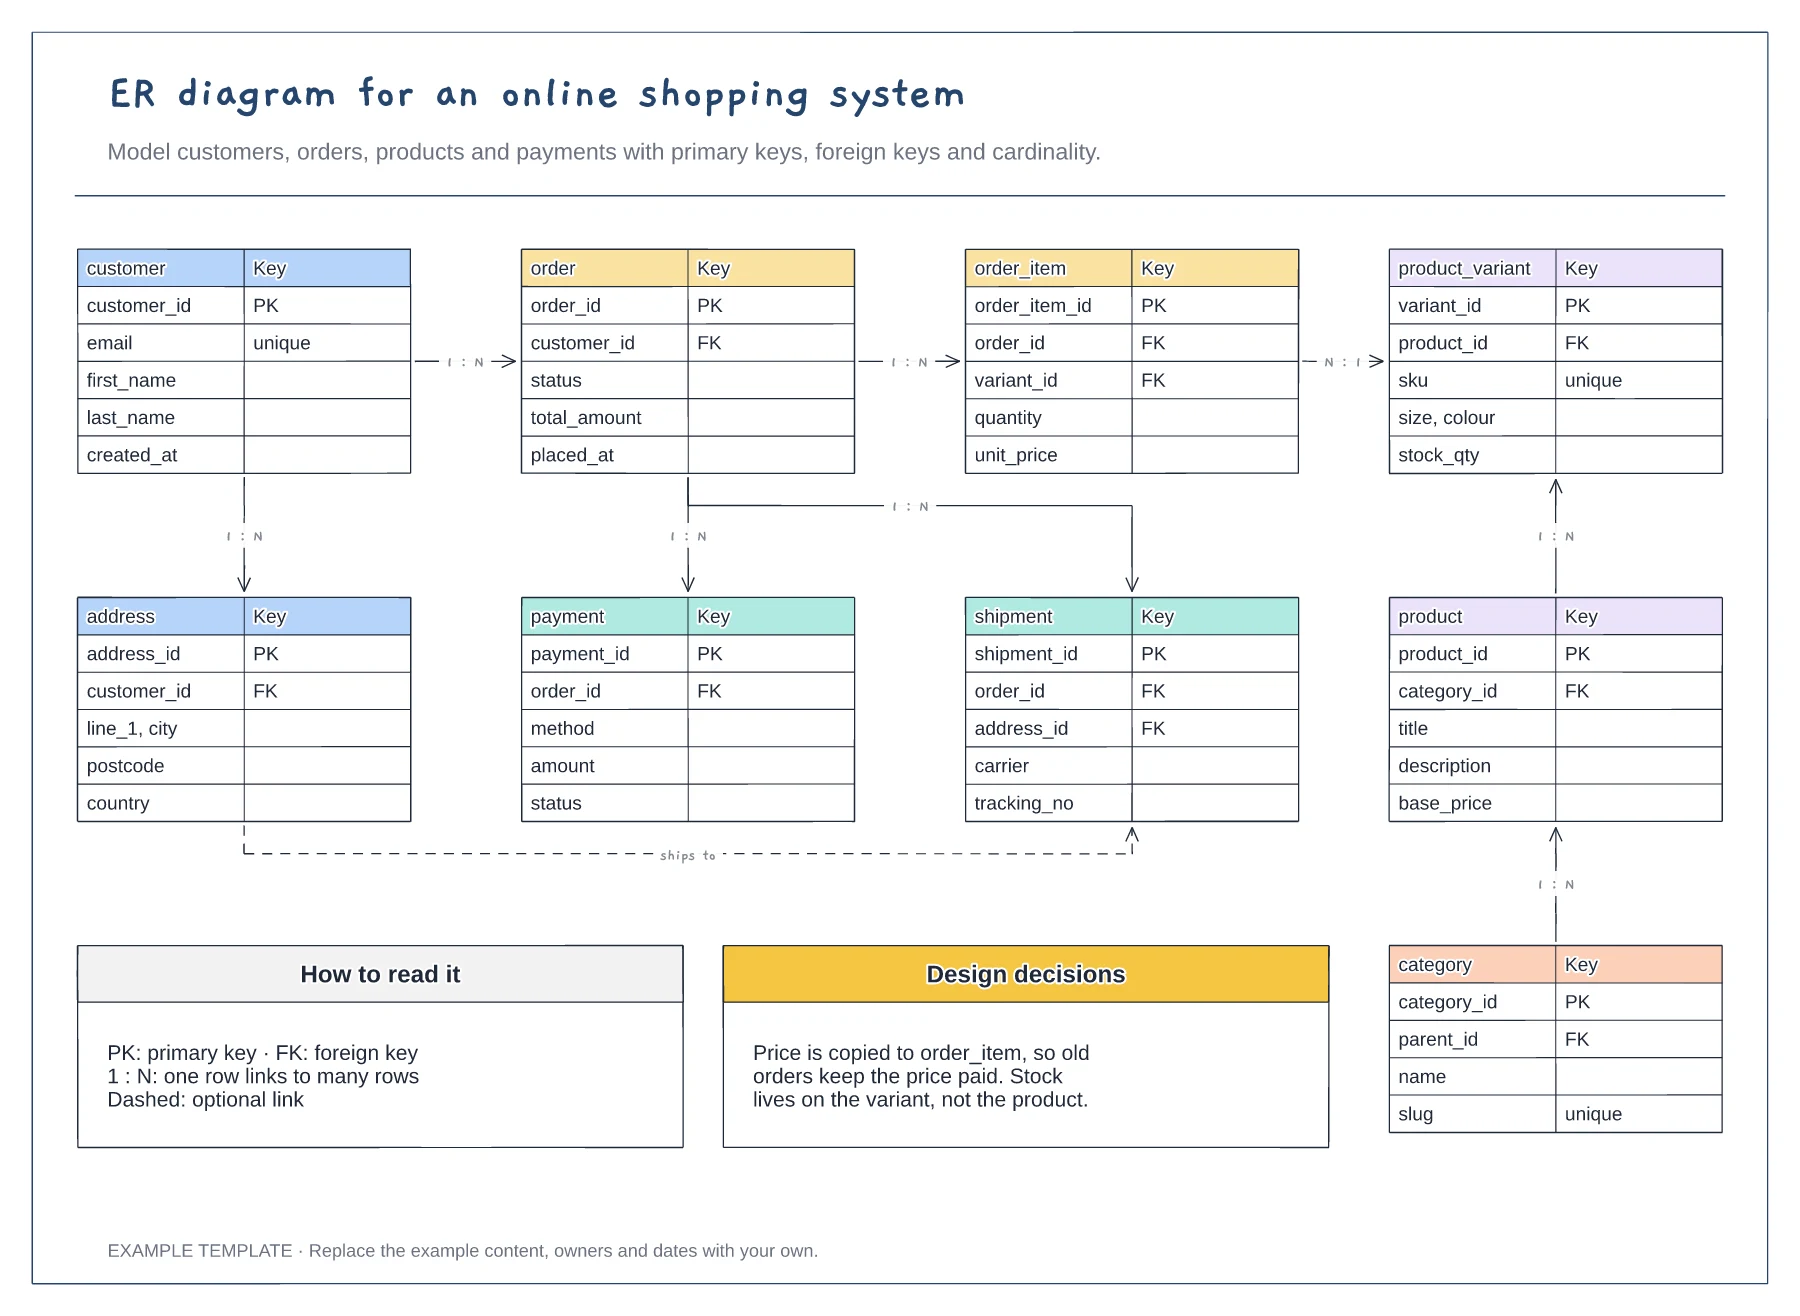
Nine entities with key fields · Primary and foreign keys · One-to-many relationships labelled
Preview and use template →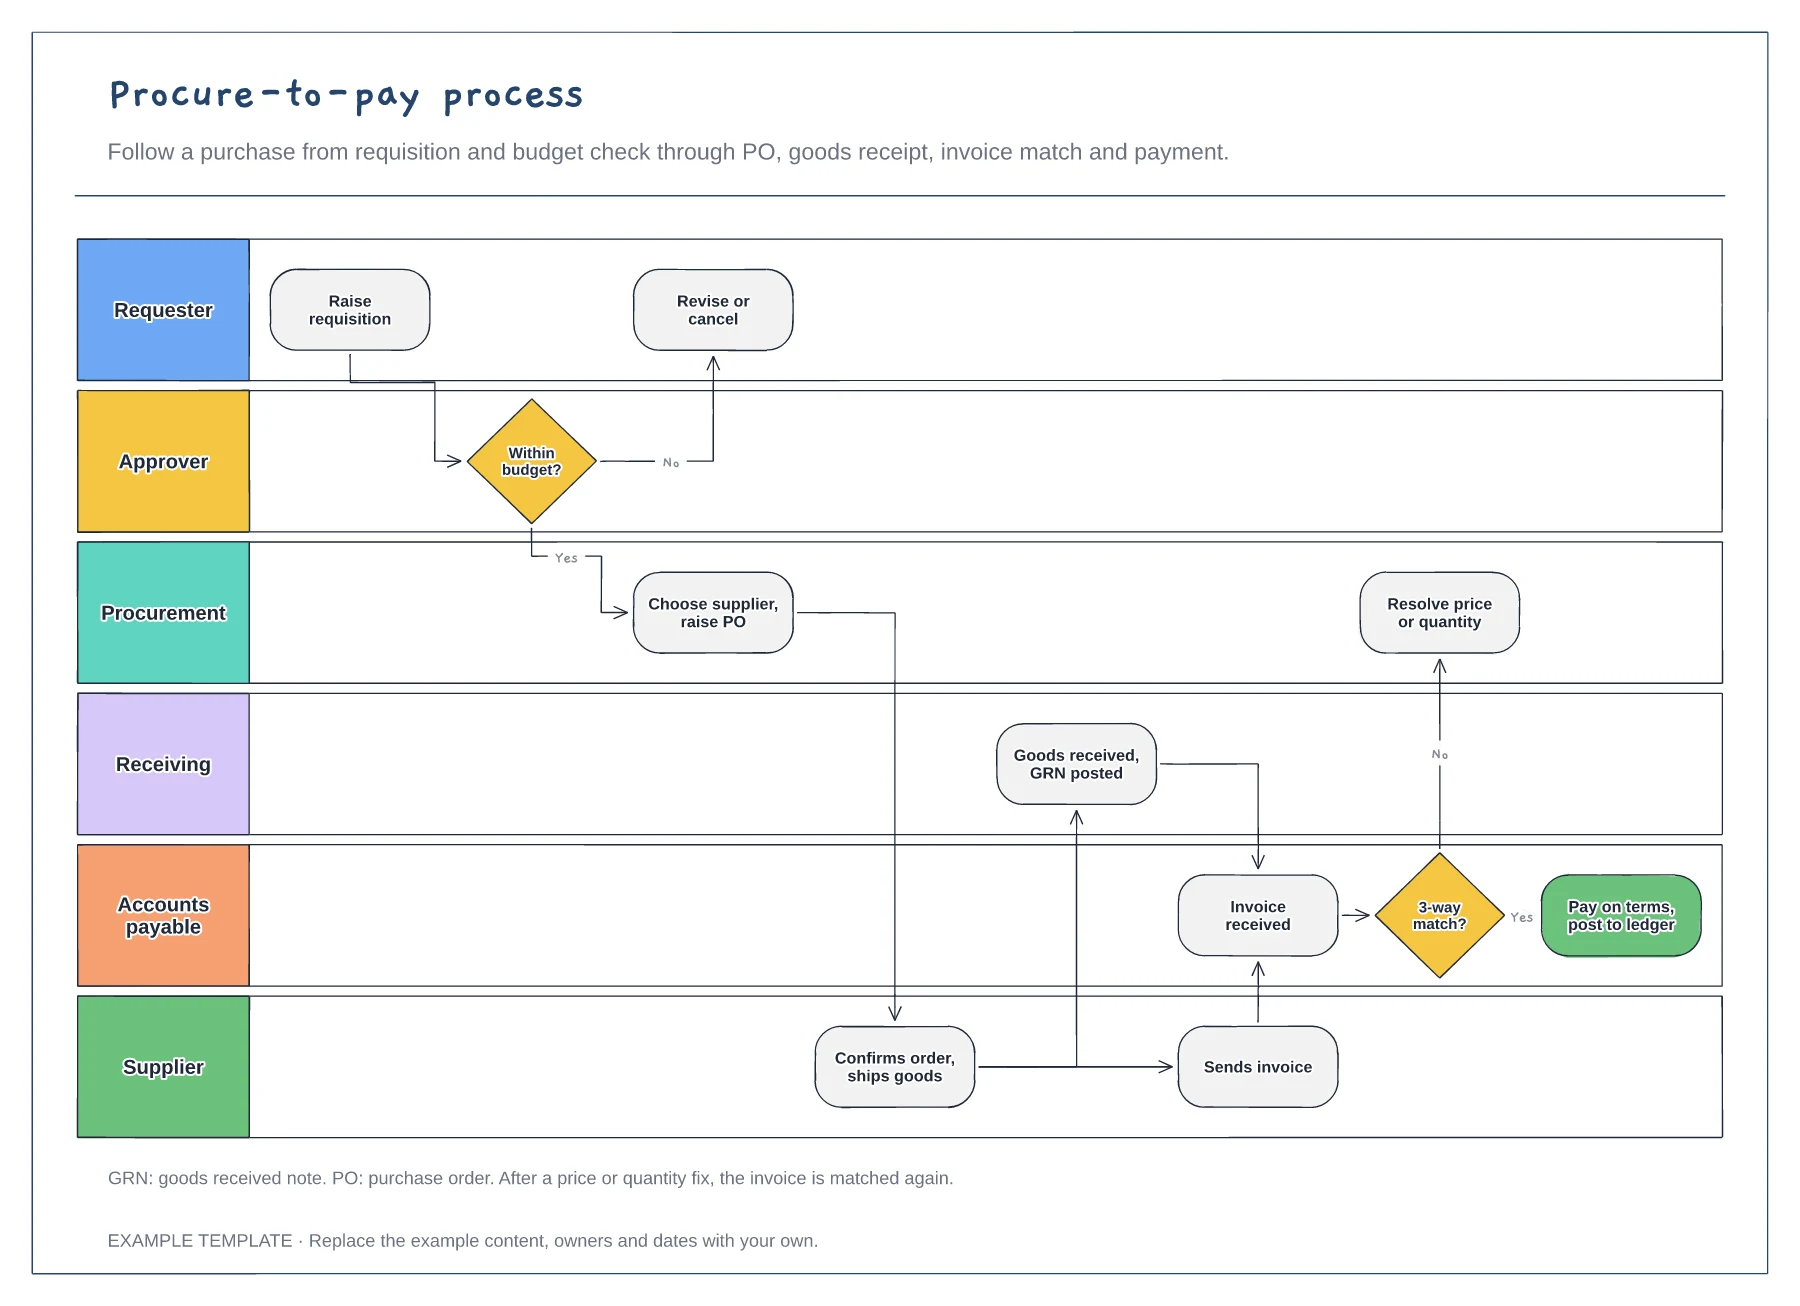
Six lanes from requester to supplier · Budget check and purchase order · Goods receipt, invoice match and payment
Preview and use template →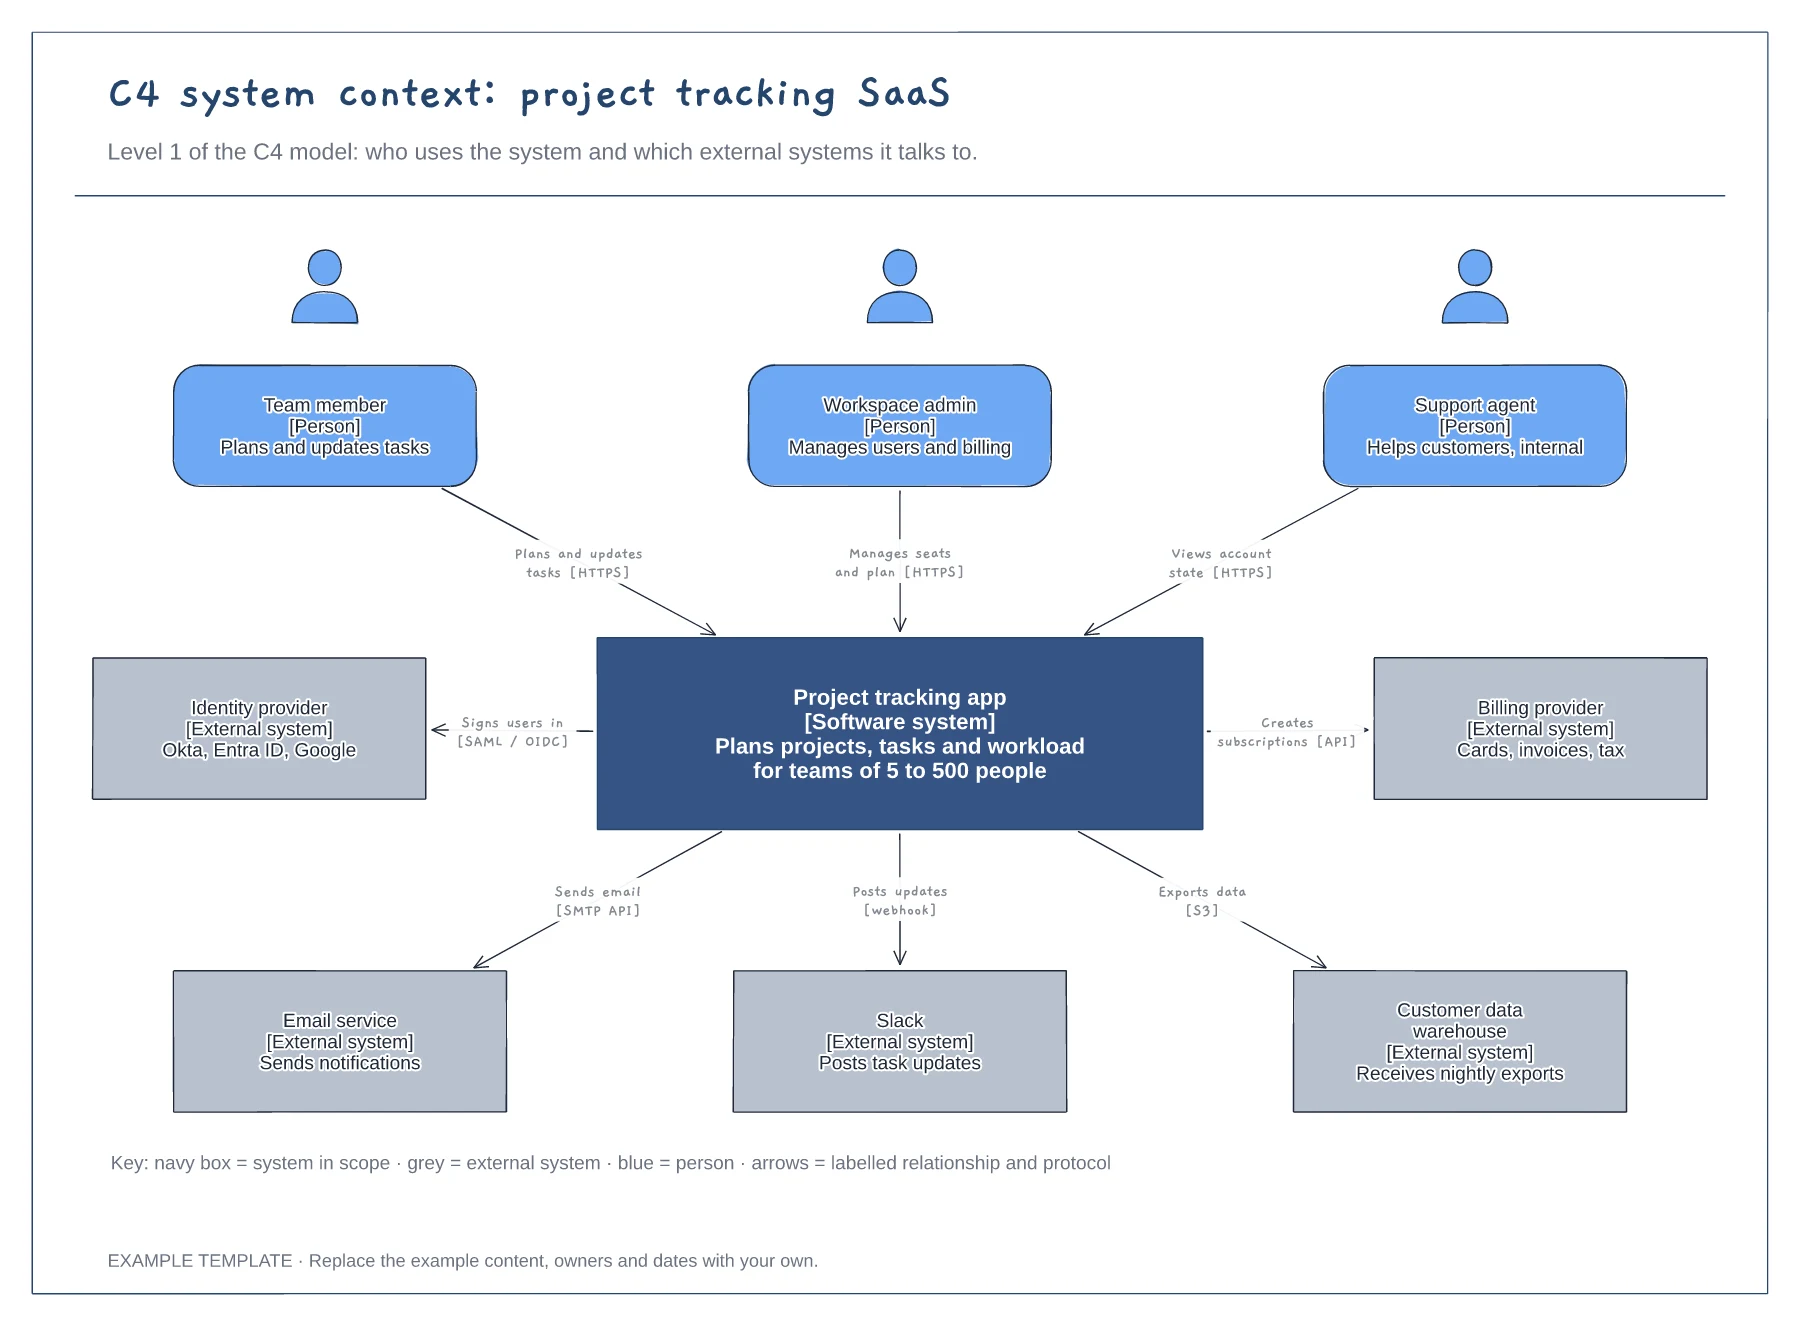
People with roles and descriptions · The system in scope and its external systems · Labelled relationships with protocols, plus a key
Preview and use template →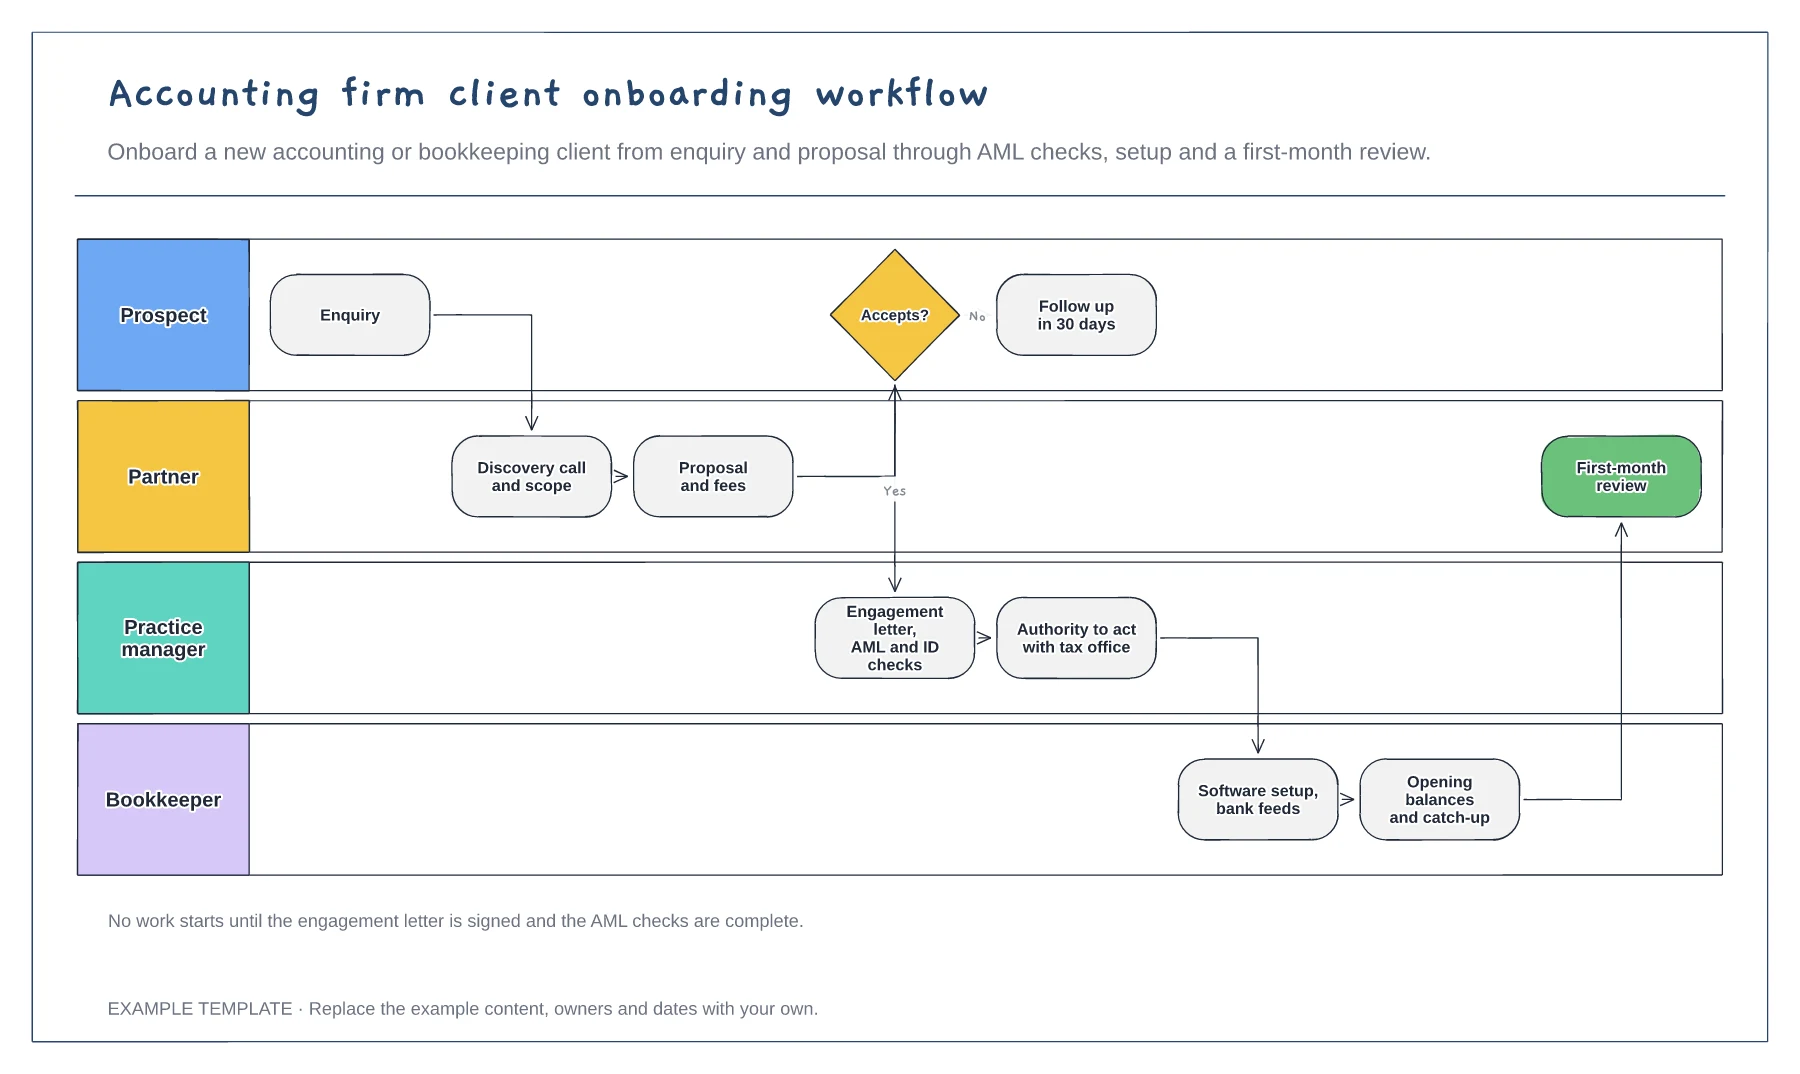
Four lanes from prospect to bookkeeper · Engagement letter and AML checks · Software setup and first-month review
Preview and use template →