Marketing
Marketing attribution models diagram template
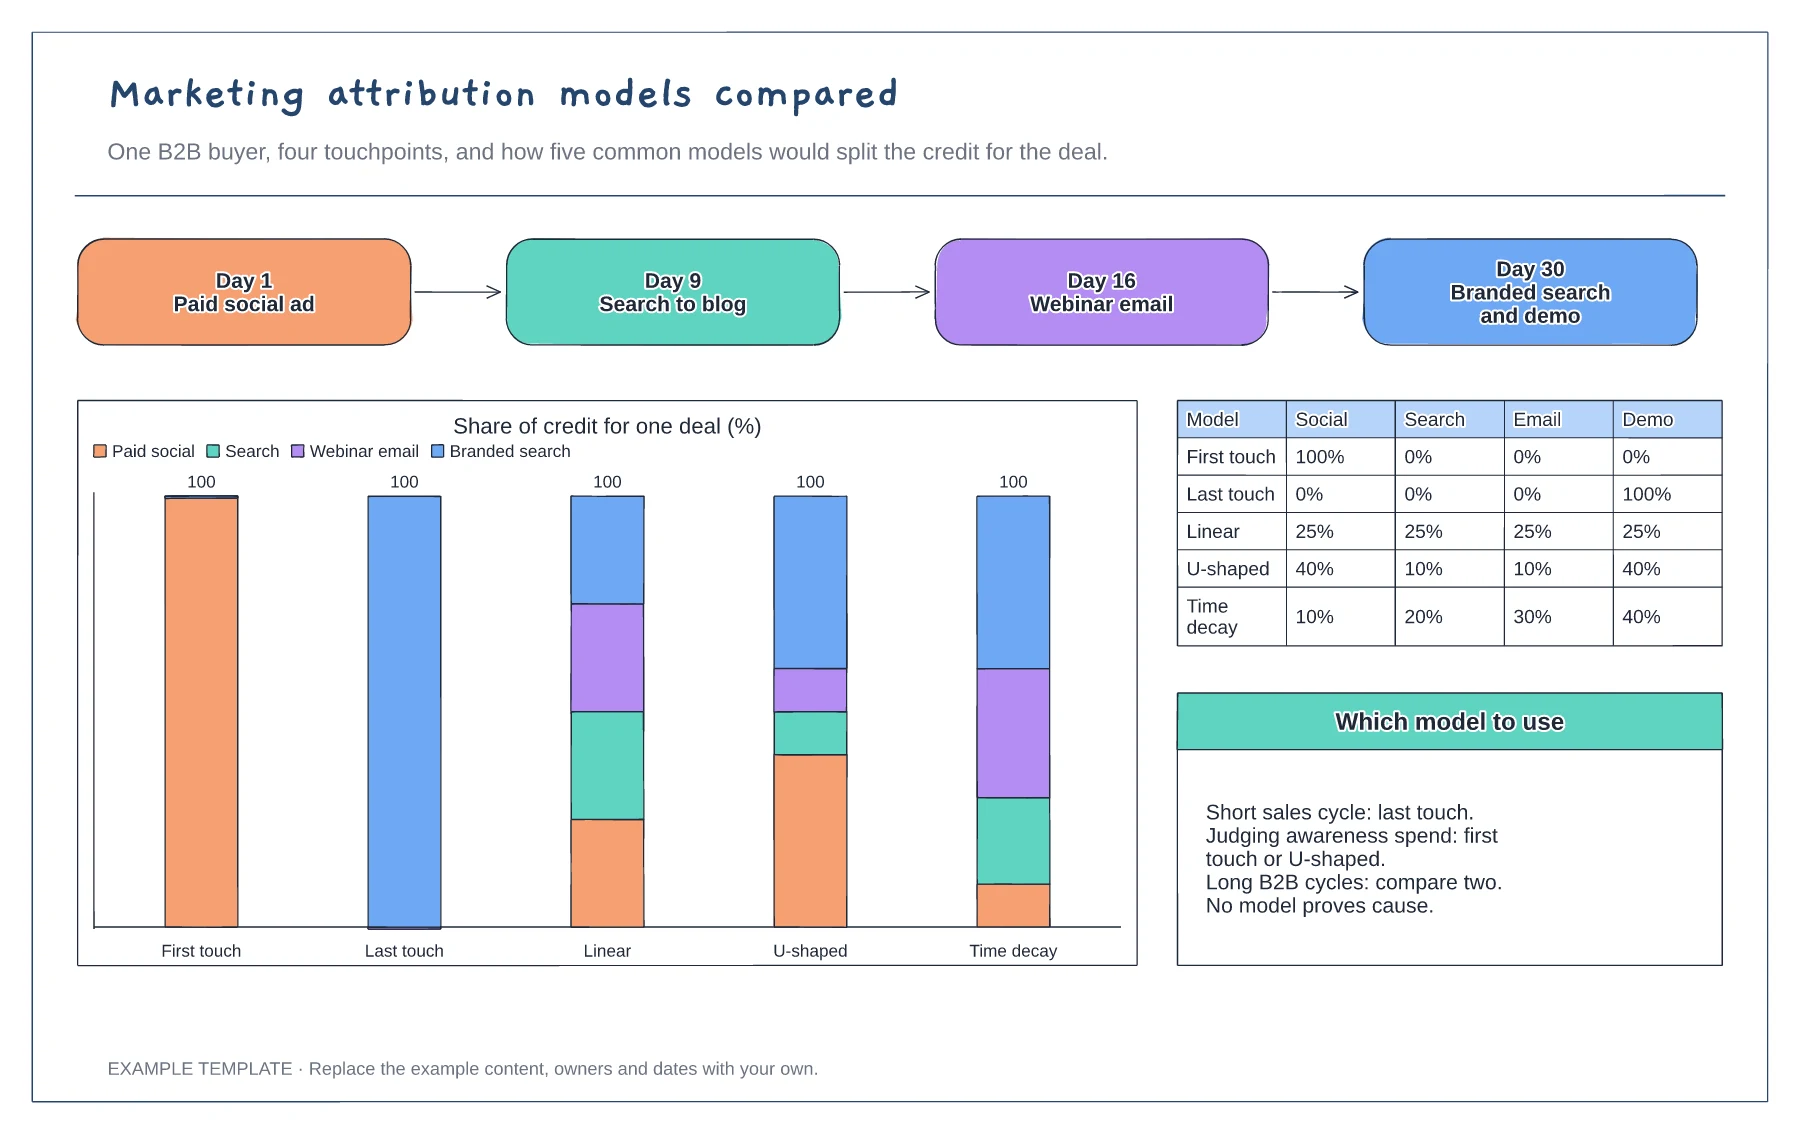
Four-touchpoint buyer path · Stacked chart of credit by model · Percentage table and notes on choosing a model
Preview and use template →An A/B test plan sets out what you are testing, why, and how you will decide before any results come in. This example tests a paid social headline (free delivery against a discount) with a written hypothesis, a fixed sample, a rule against stopping early and a log for this and later tests.
No account needed · Opens as your own editable page
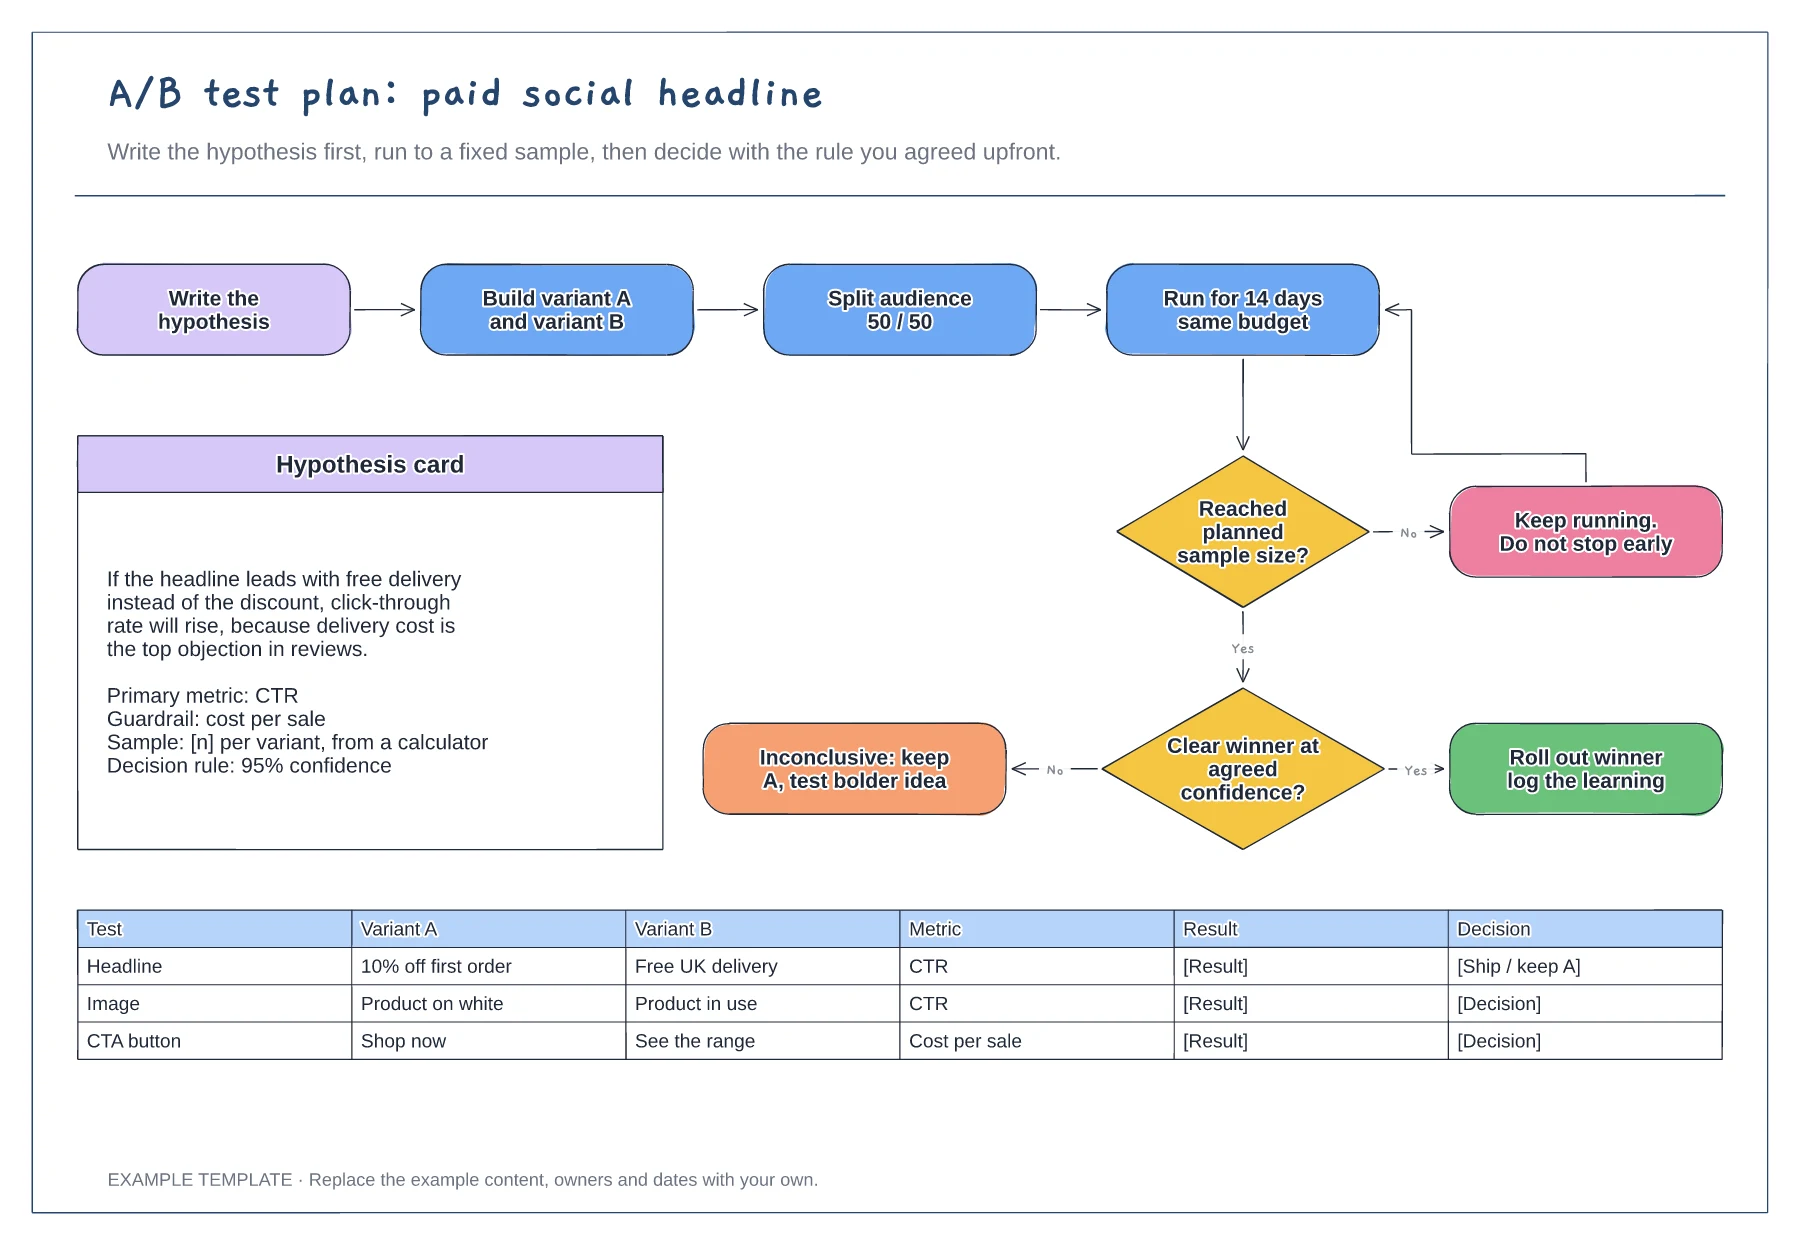
Replace the example with one change, the metric you expect it to move and why. A reason grounded in reviews or research makes the result useful even when the test loses.
Use a sample size calculator for your baseline rate and set the confidence level before launch. Stopping as soon as one variant looks ahead makes false winners much more likely.
Add each test to the log, including inconclusive ones. Over time the log shows which kinds of change move your metric and stops the team repeating old tests.
Yes. Change the 50/50 split to equal shares for each variant and add a row for every variant in the test log.
No. Open the template and edit it in your browser. Your work saves on this device. An account is optional if you want to sync your workspace.
Yes. Use Export in the editor to save a PNG, SVG or PDF, or download an editable .epicdraw backup.
Four-touchpoint buyer path · Stacked chart of credit by model · Percentage table and notes on choosing a model
Preview and use template →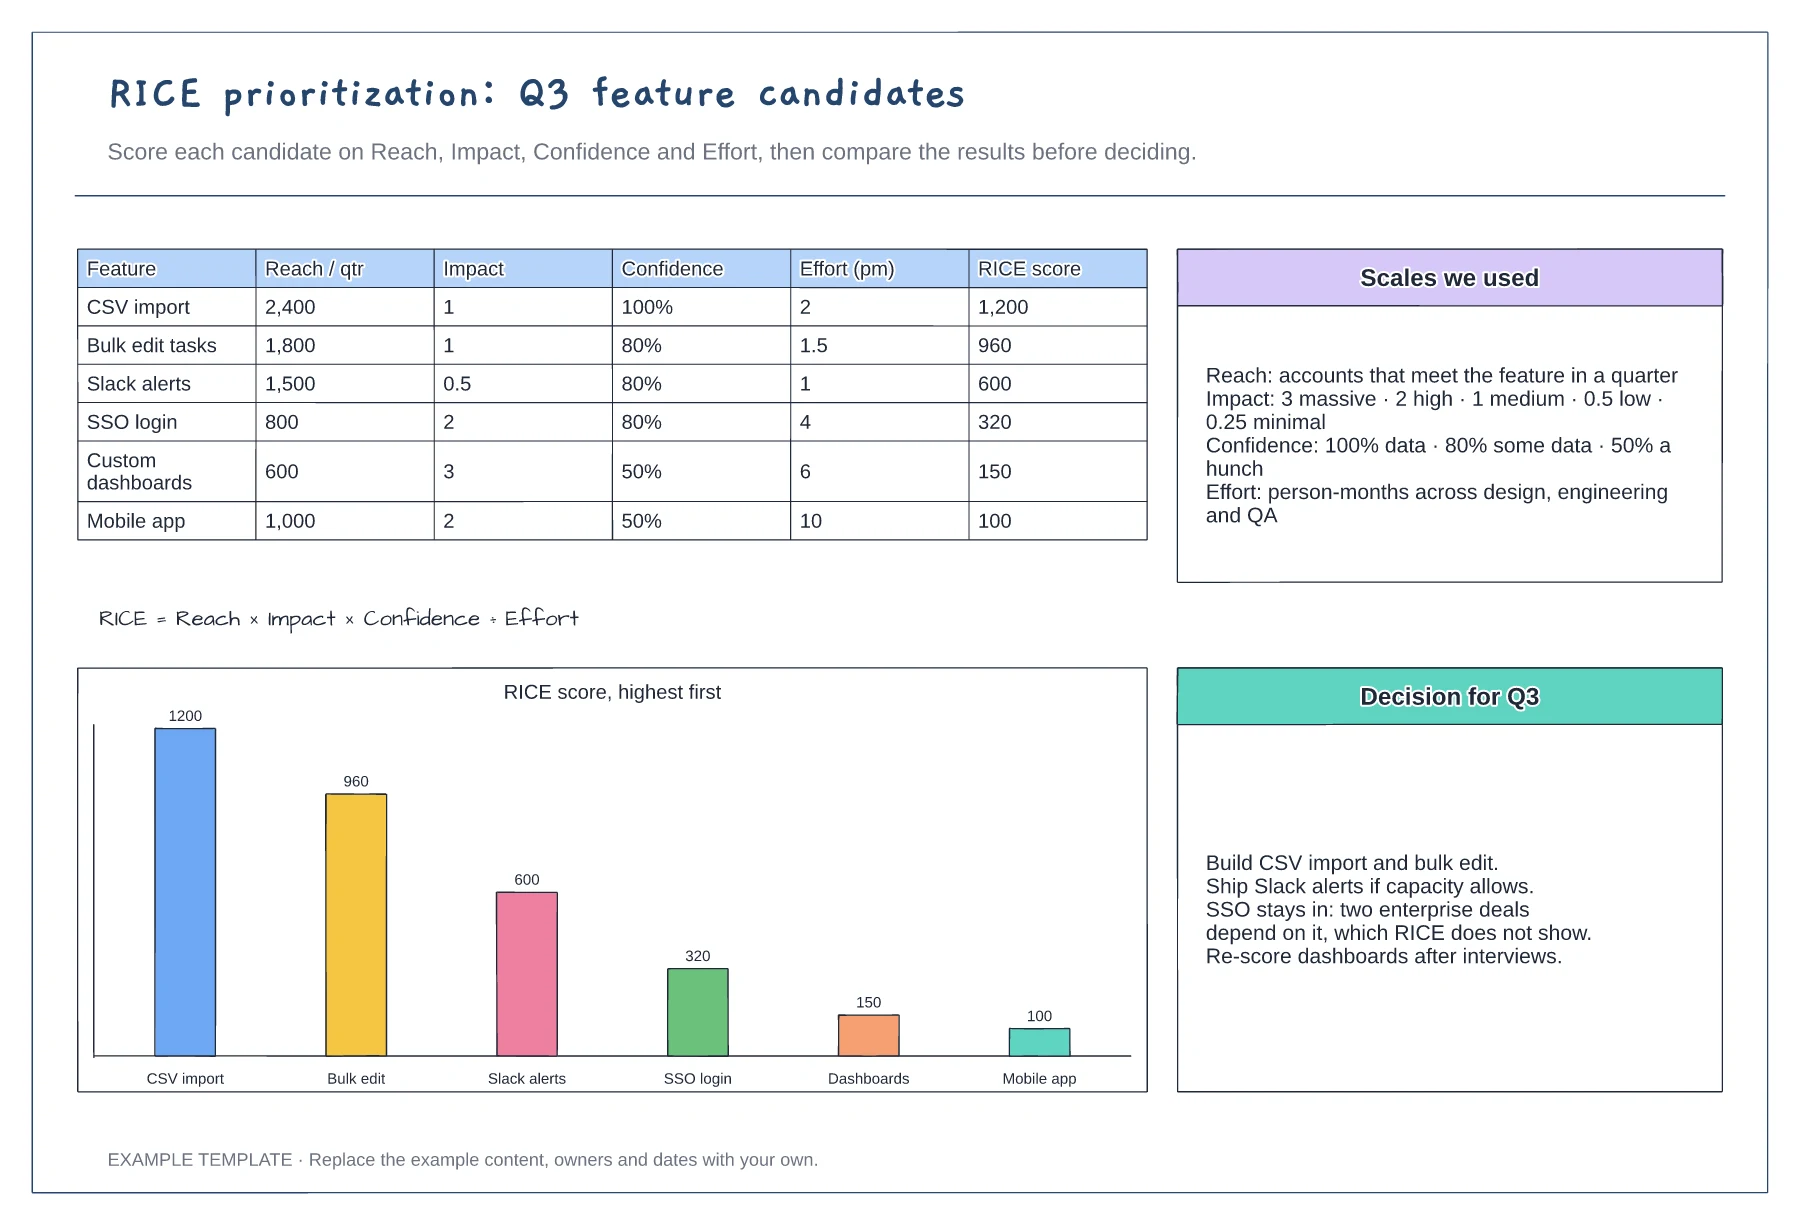
Scoring table with six features · Scales for reach, impact, confidence and effort · Ranked chart and a recorded decision
Preview and use template →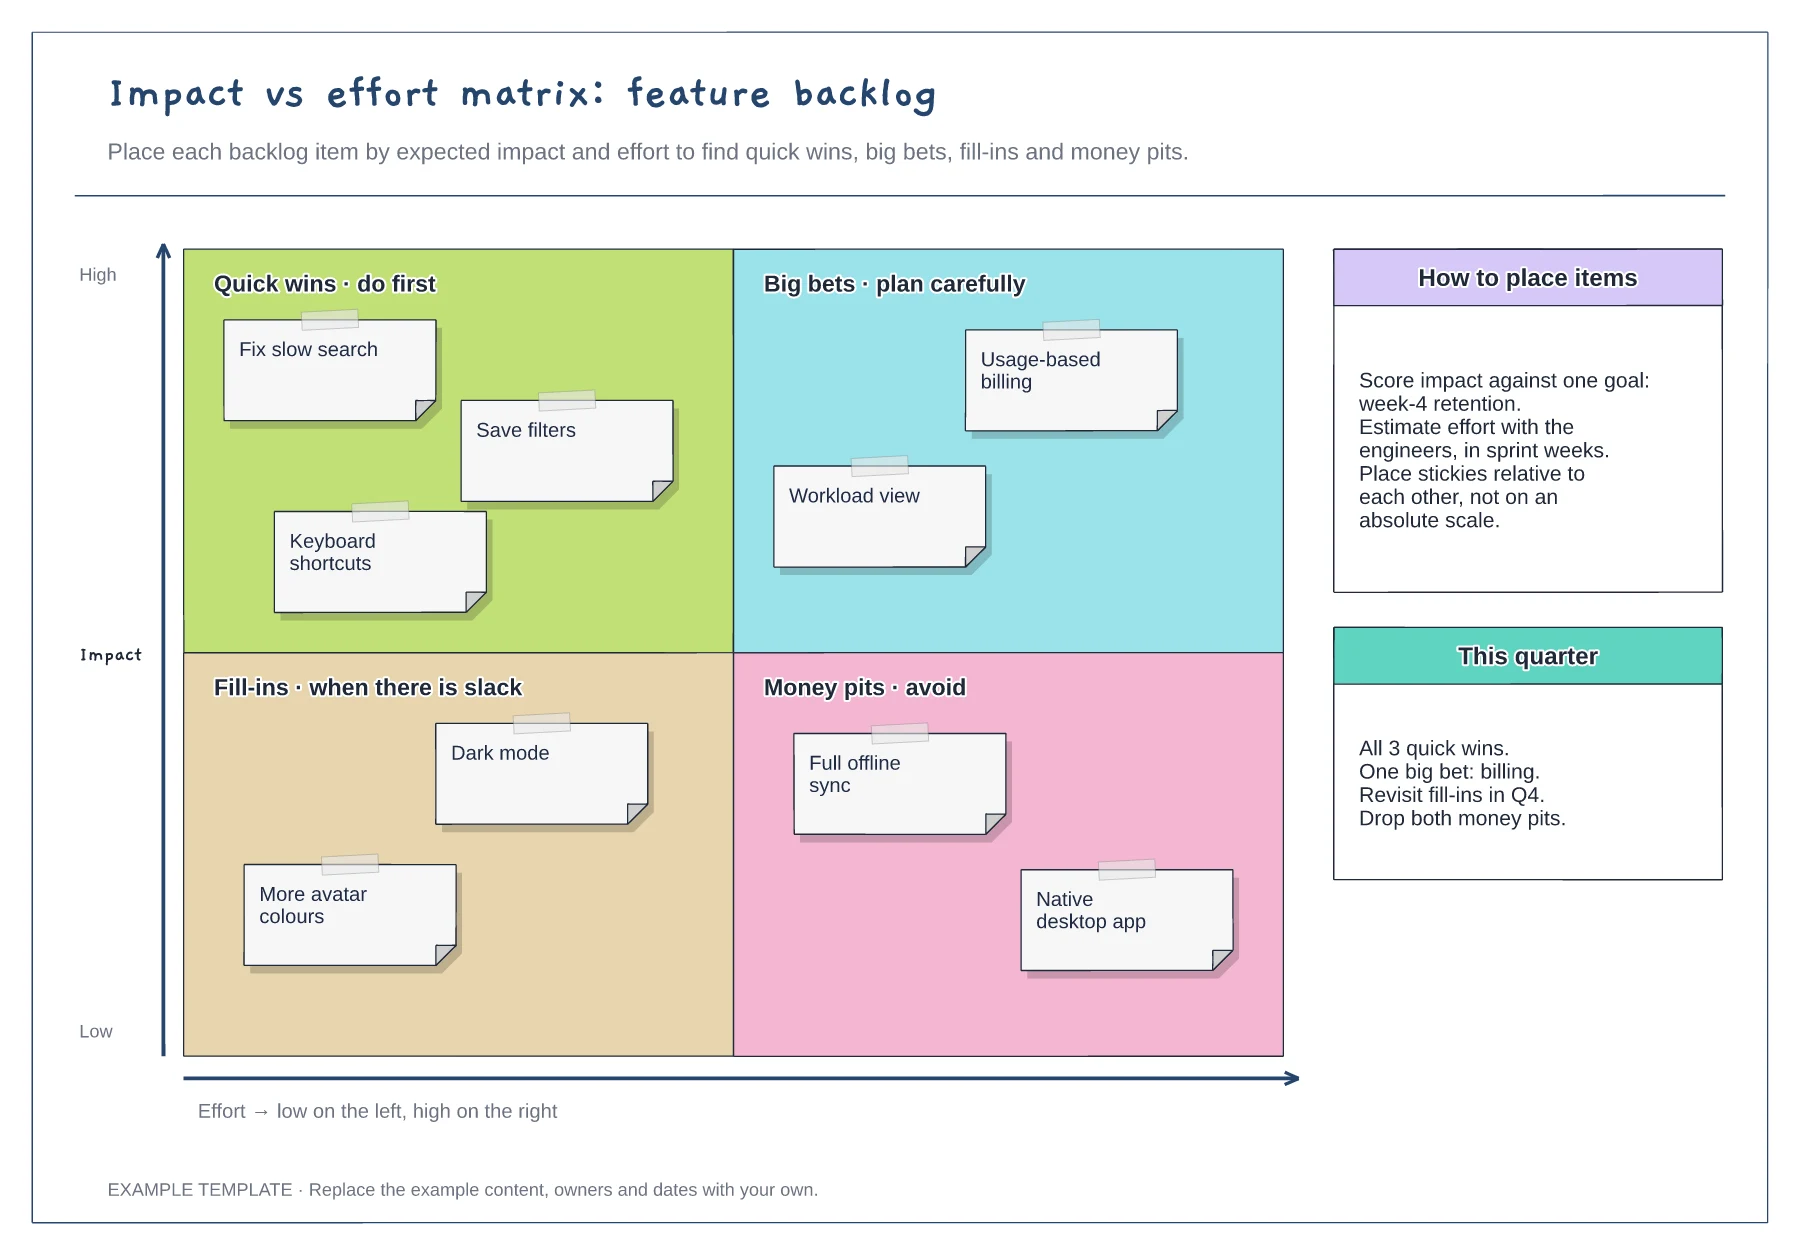
Quick wins, big bets, fill-ins and money pits · Nine example backlog items · Placement guidance and a quarter plan
Preview and use template →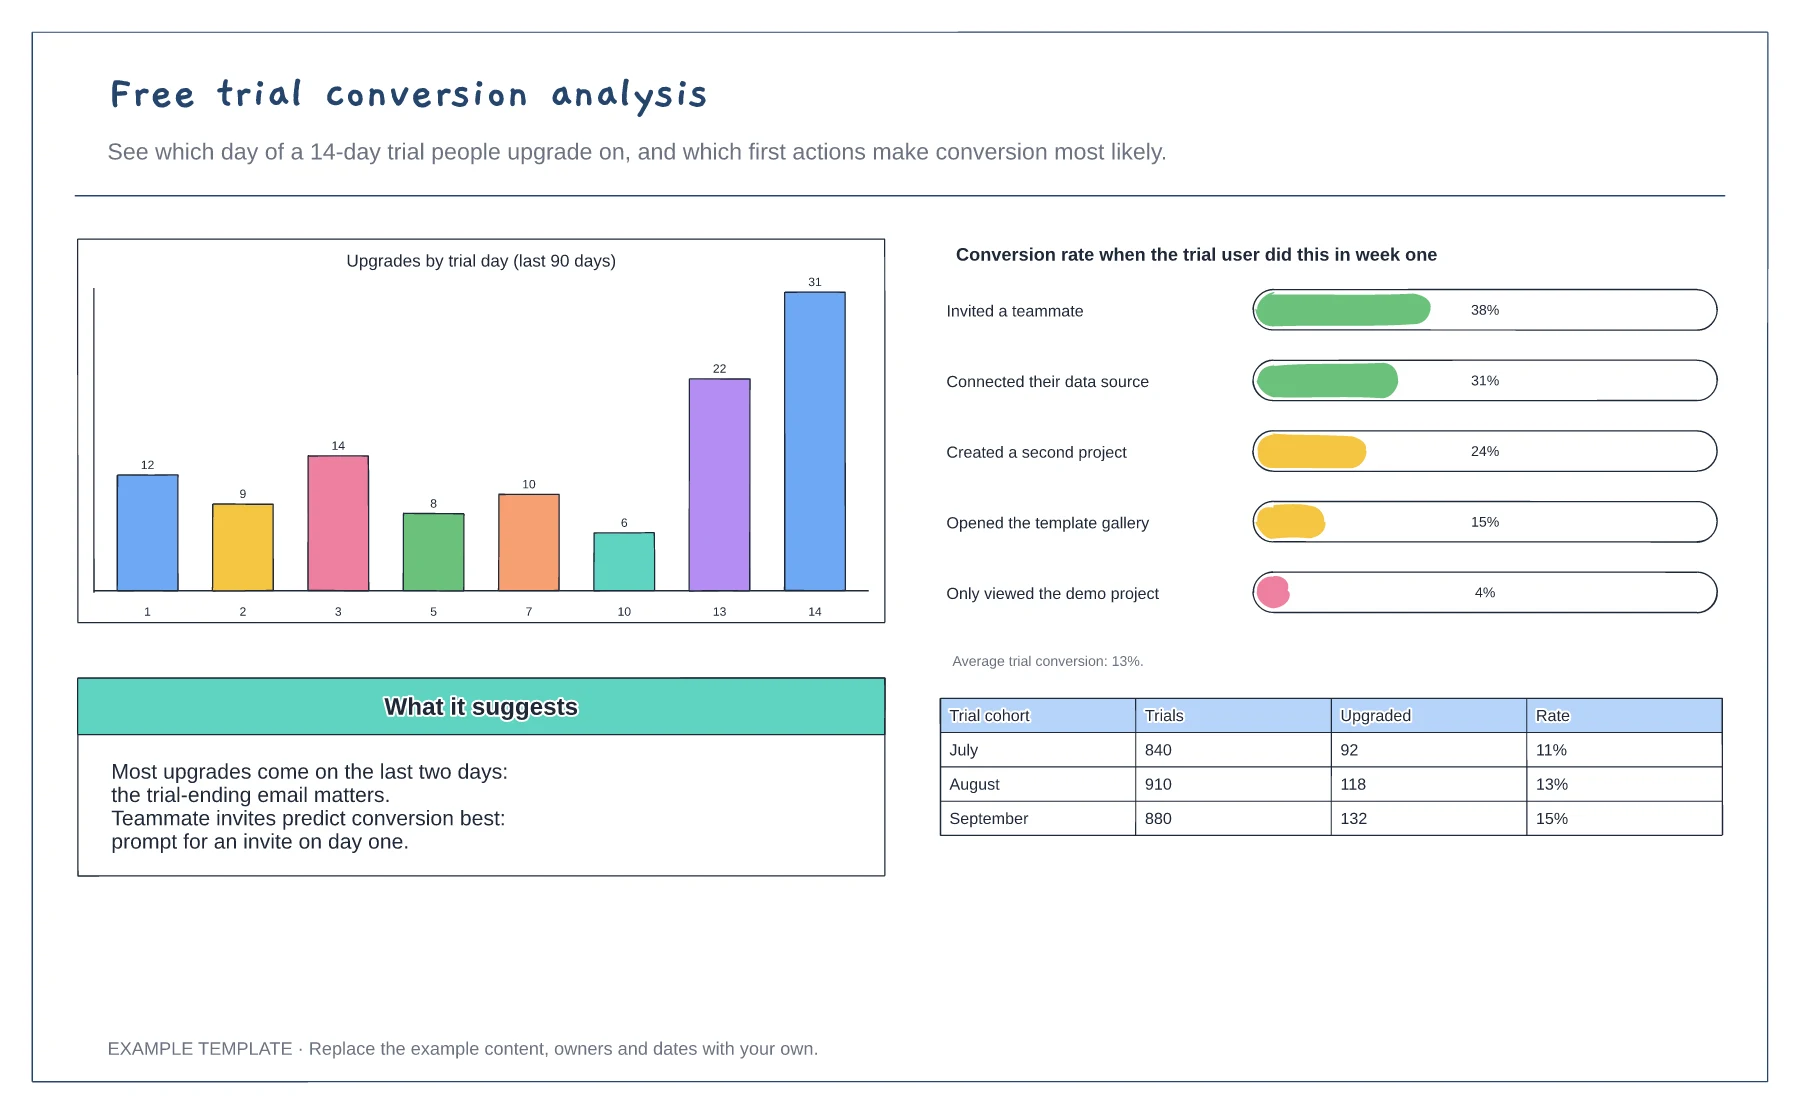
Upgrades by trial day · Conversion by first-week action · Monthly cohort table
Preview and use template →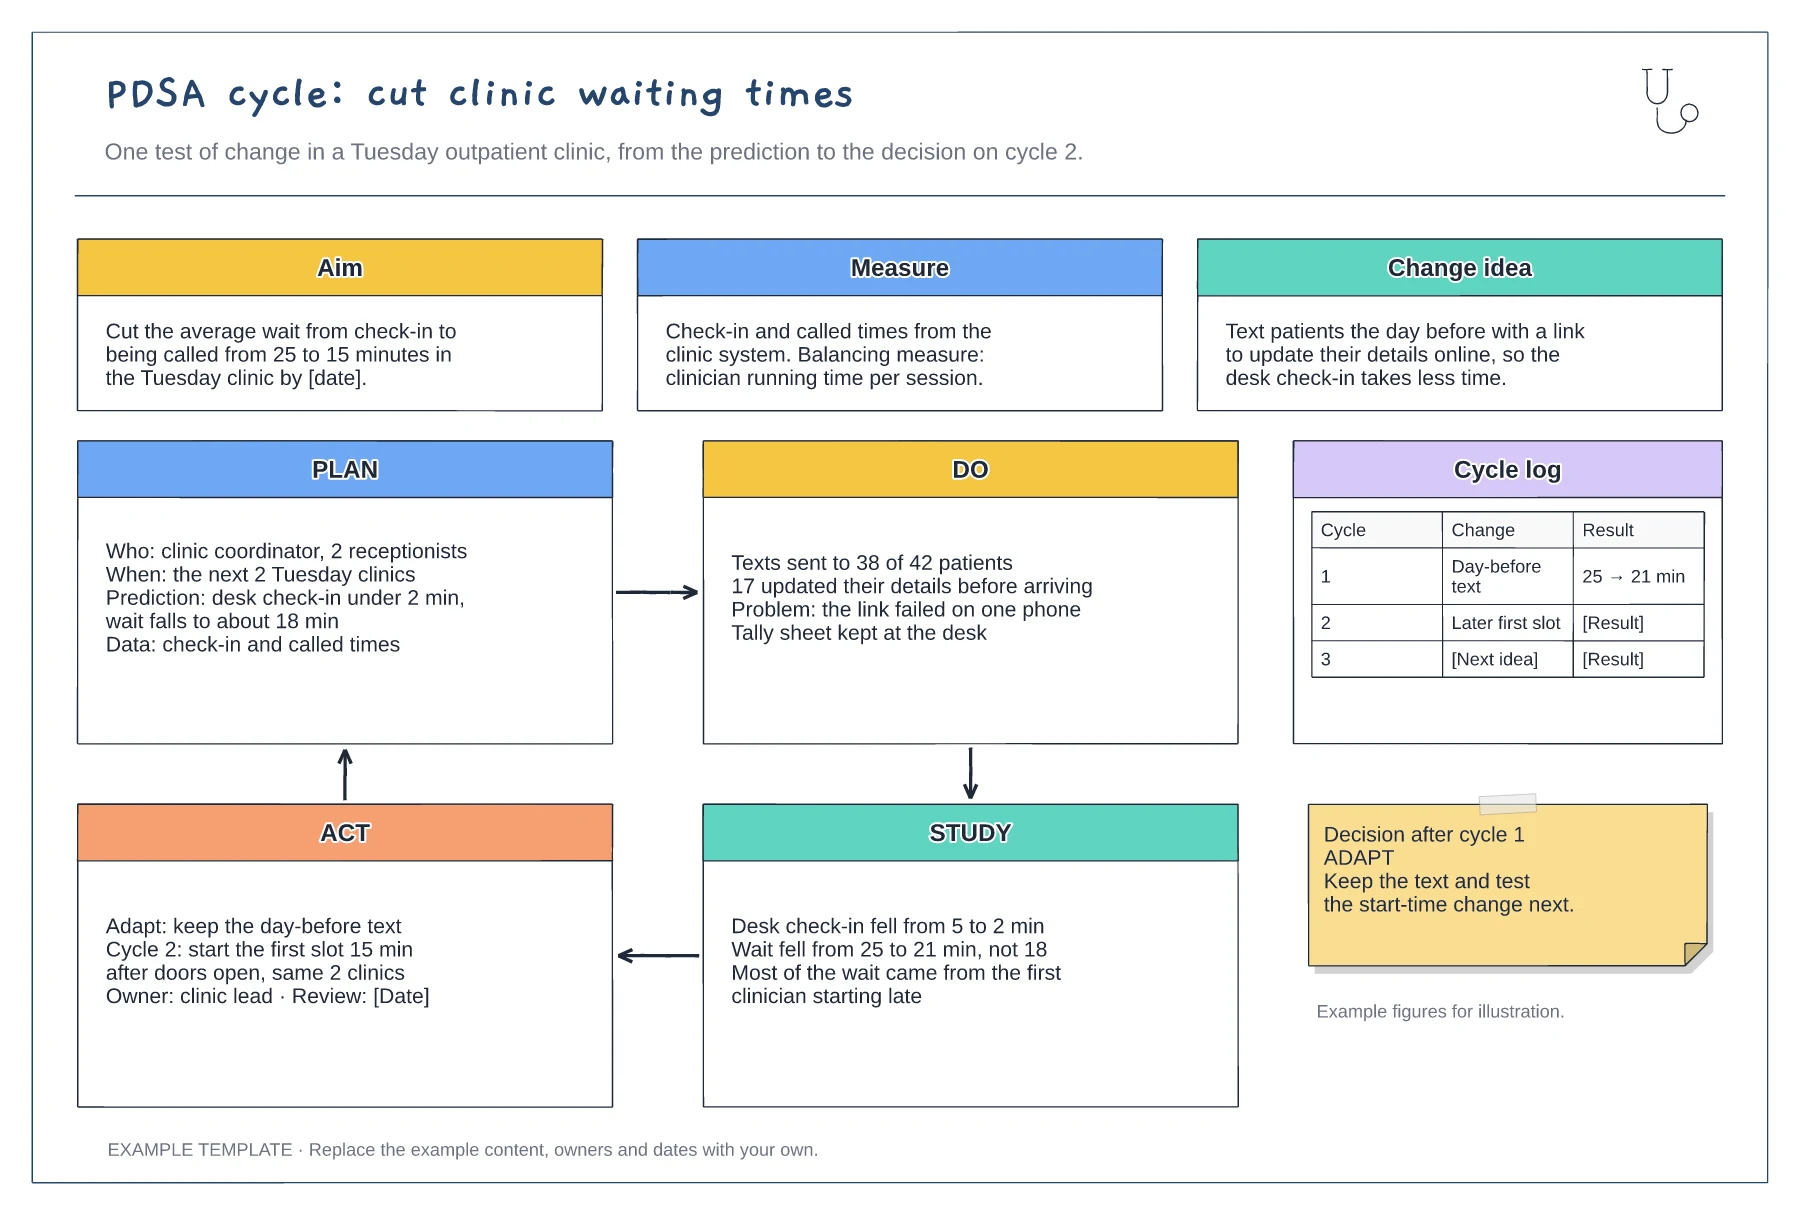
Aim, measure and change idea · Filled-in Plan, Do, Study and Act panels · Cycle log and decision note
Preview and use template →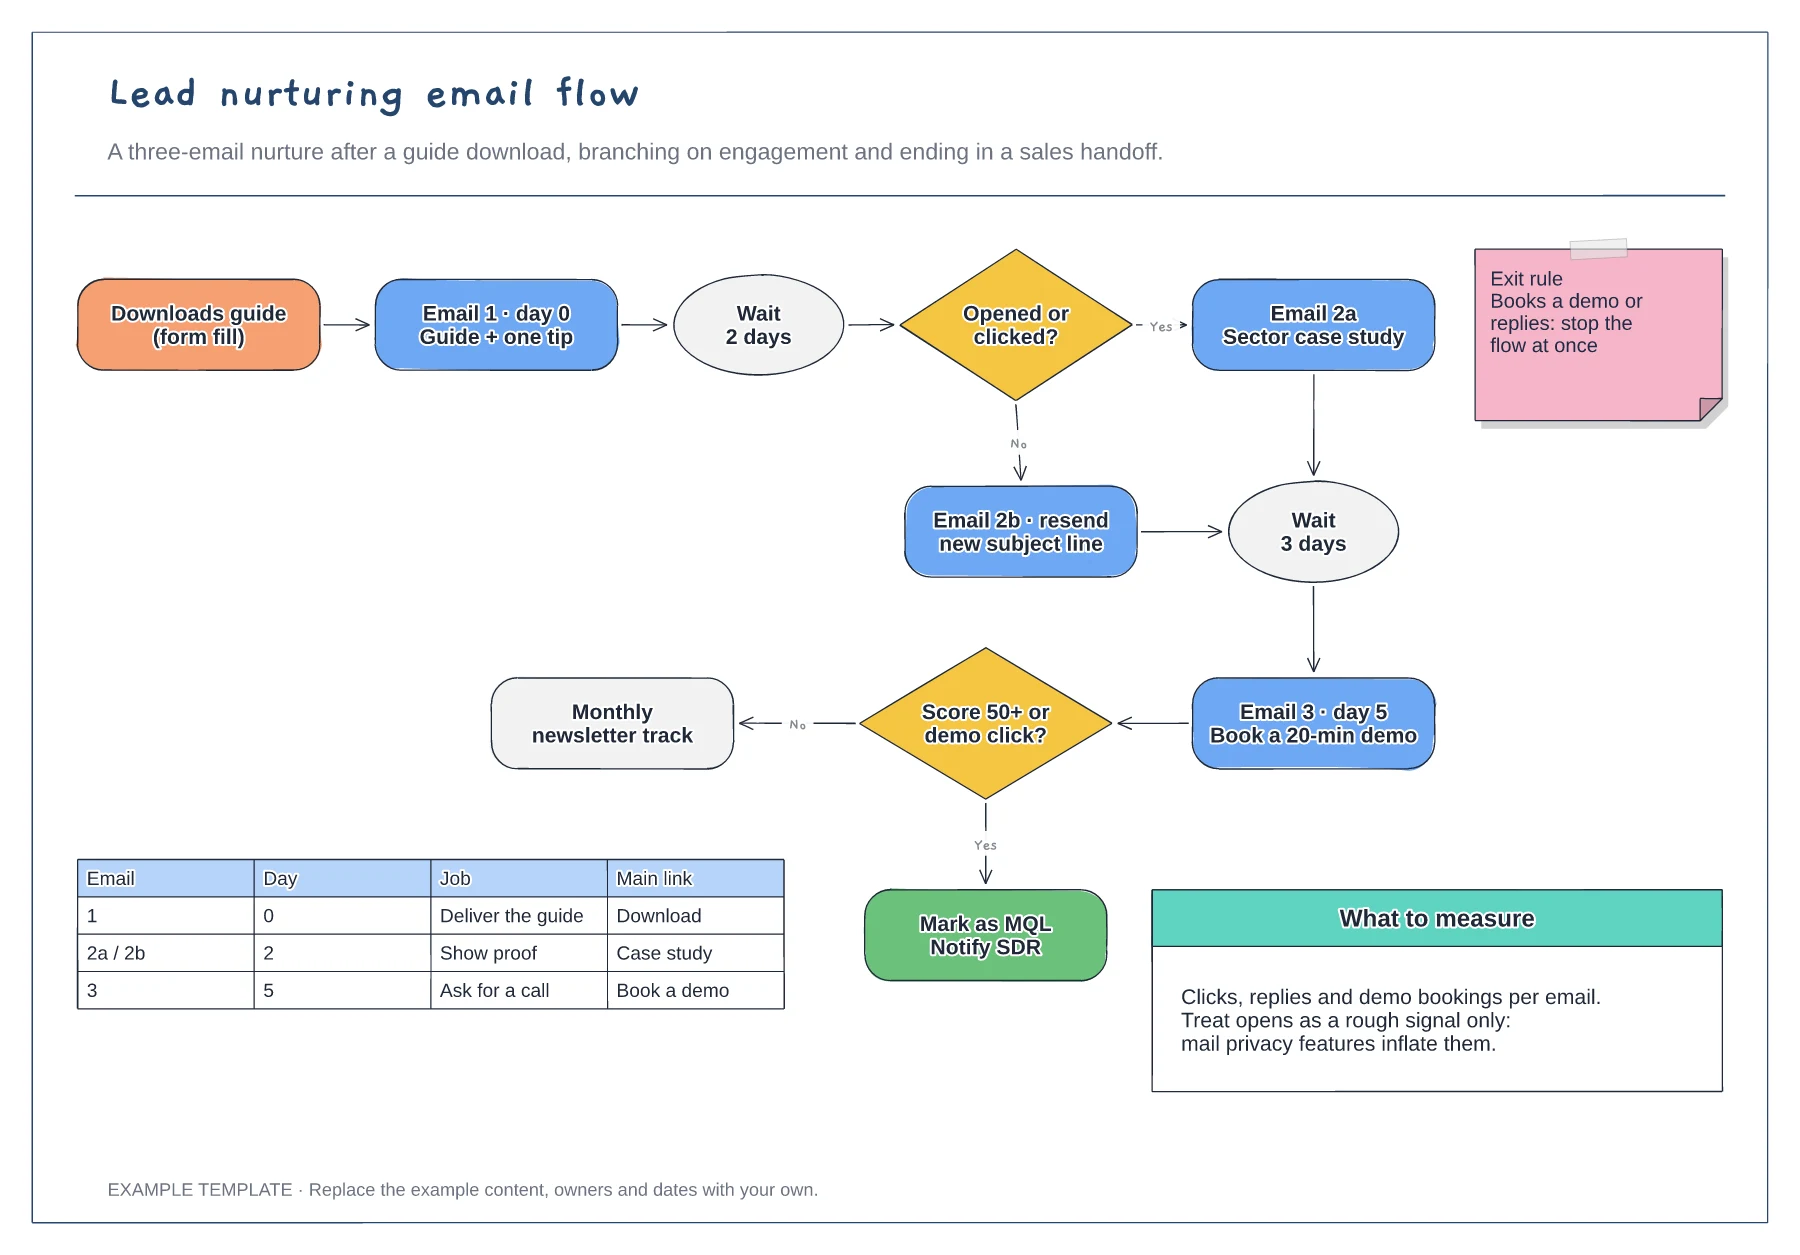
Trigger, wait steps and engagement branches · Exit rule and MQL handoff · Email table and notes on what to measure
Preview and use template →