Marketing
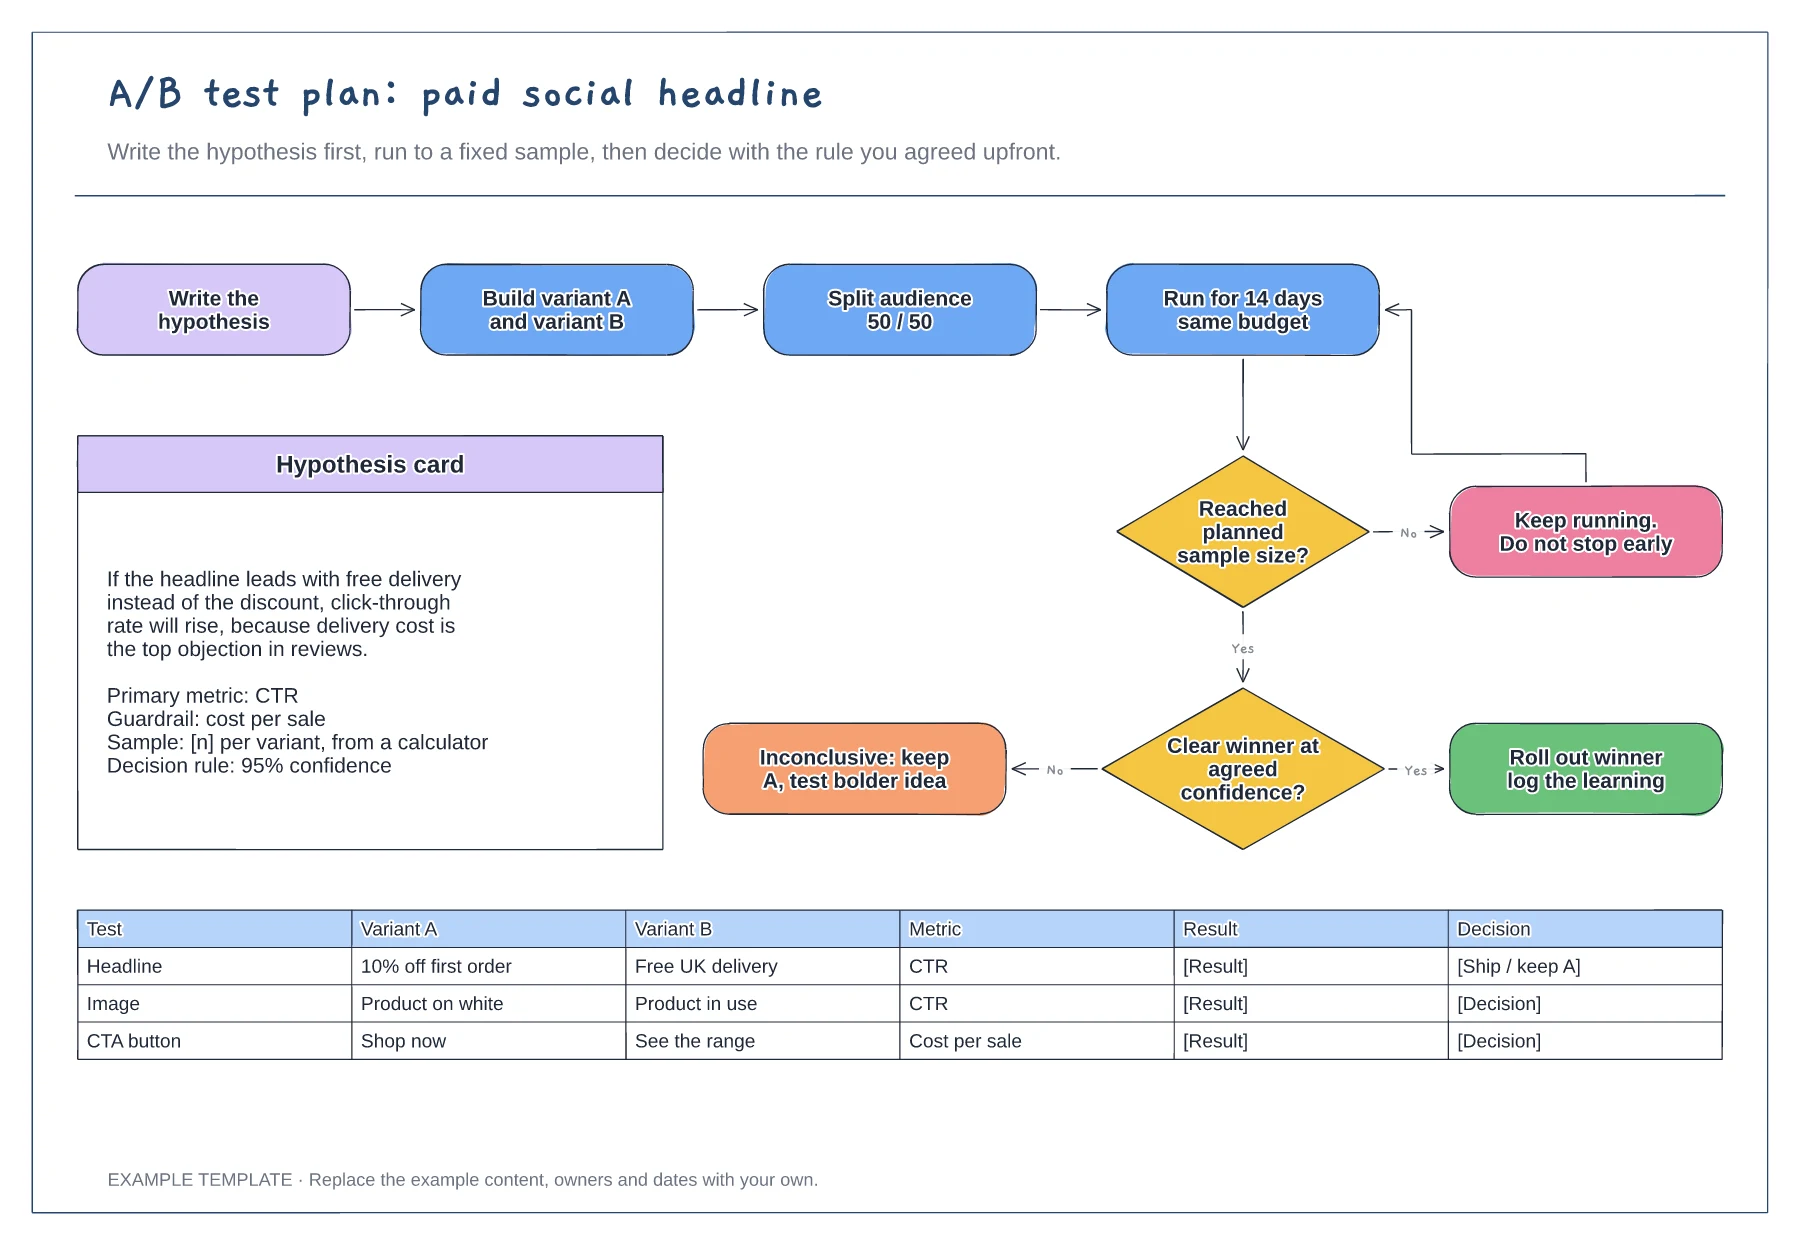
A/B test plan template
Hypothesis card with metric and guardrail · Decision flow with a no-peeking loop · Test log for variants and results
Preview and use template →An attribution diagram shows how different models share credit for a sale between the touchpoints that led to it. This example follows one B2B buyer through four touchpoints over 30 days and compares how first touch, last touch, linear, U-shaped and time decay models would split the credit.
No account needed · Opens as your own editable page
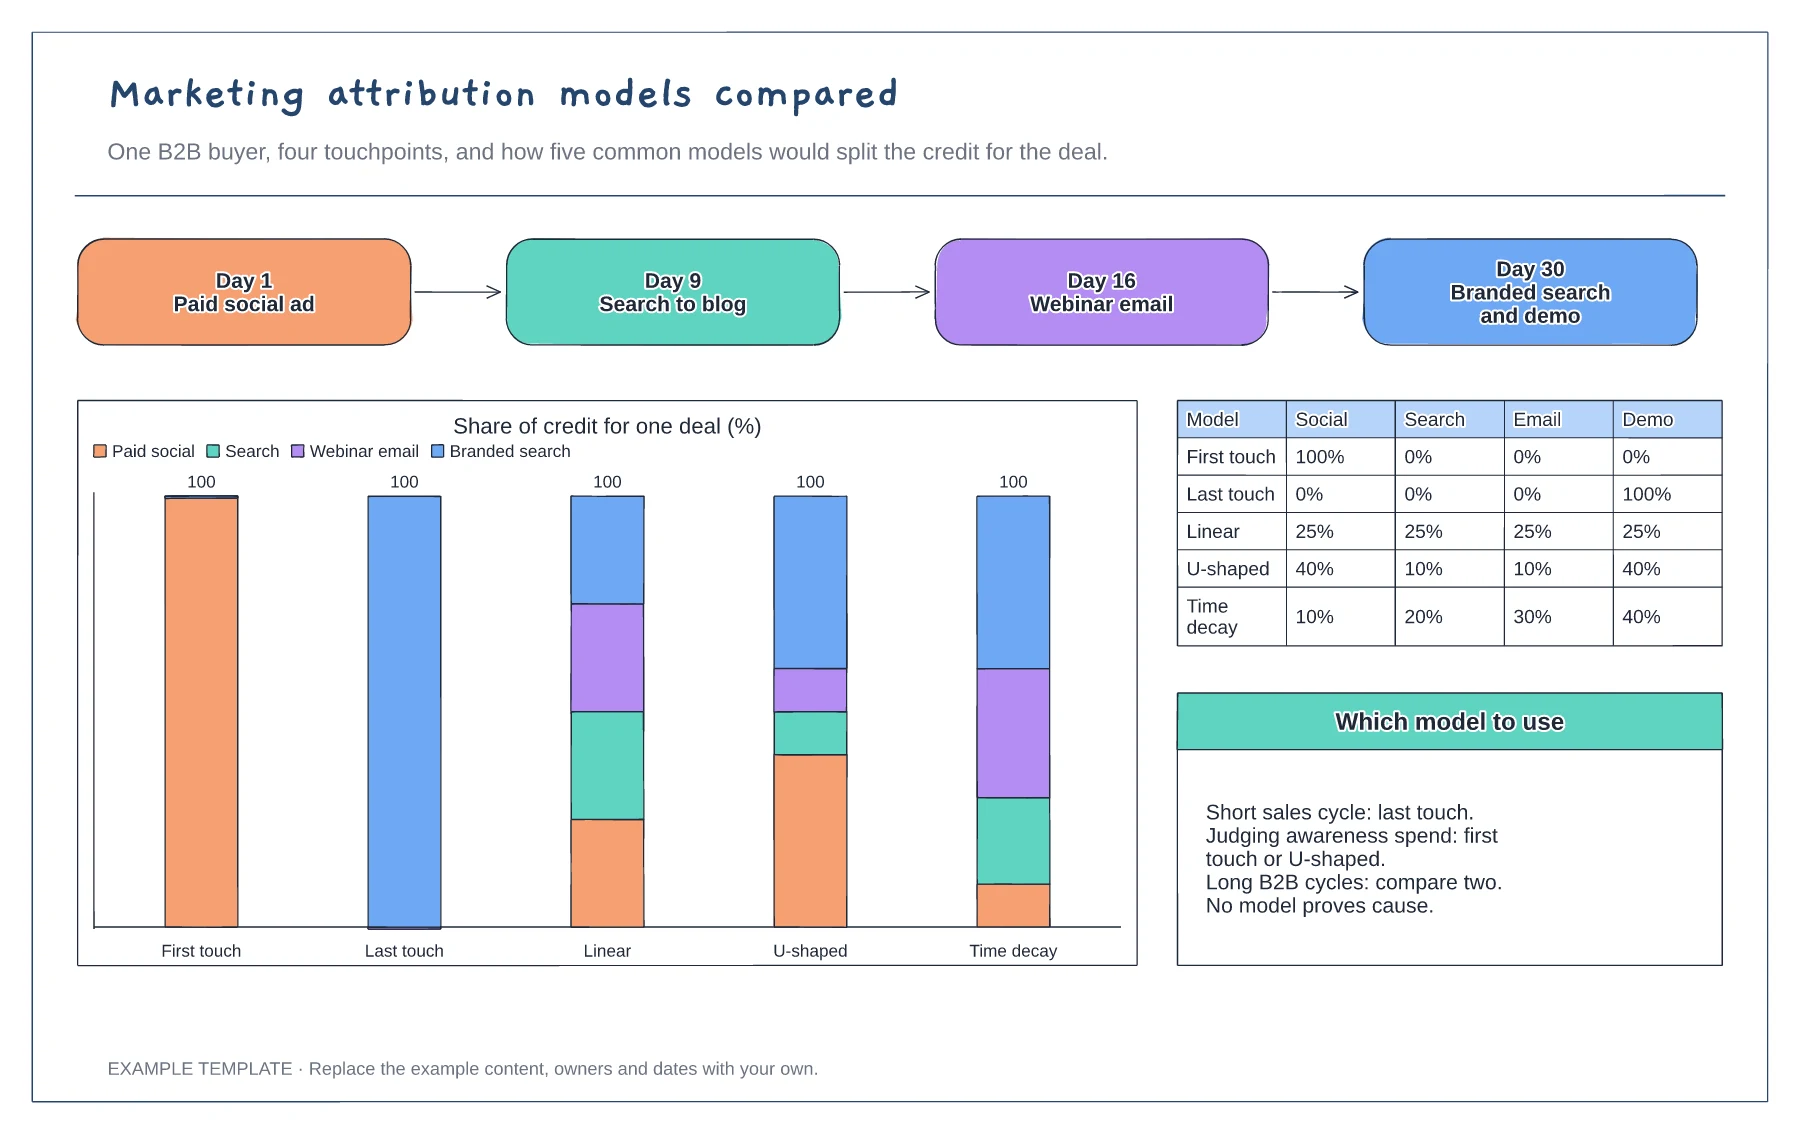
Replace the touchpoints with a journey from your CRM or analytics. A real example makes the differences between models easier for clients and colleagues to grasp than definitions do.
Look at how each model would change the credit for each channel. If one channel looks strong only under one model, treat its results with caution before moving budget.
Choose the model your reports will use and write the reason beside the chart. Switching models between reports makes channel performance look as if it has changed when it has not.
Yes. Rename the four touchpoints, recalculate the credit each model gives them and update the stacked chart and percentage table to match.
No. Open the template and edit it in your browser. Your work saves on this device. An account is optional if you want to sync your workspace.
Yes. Use Export in the editor to save a PNG, SVG or PDF, or download an editable .epicdraw backup.
Hypothesis card with metric and guardrail · Decision flow with a no-peeking loop · Test log for variants and results
Preview and use template →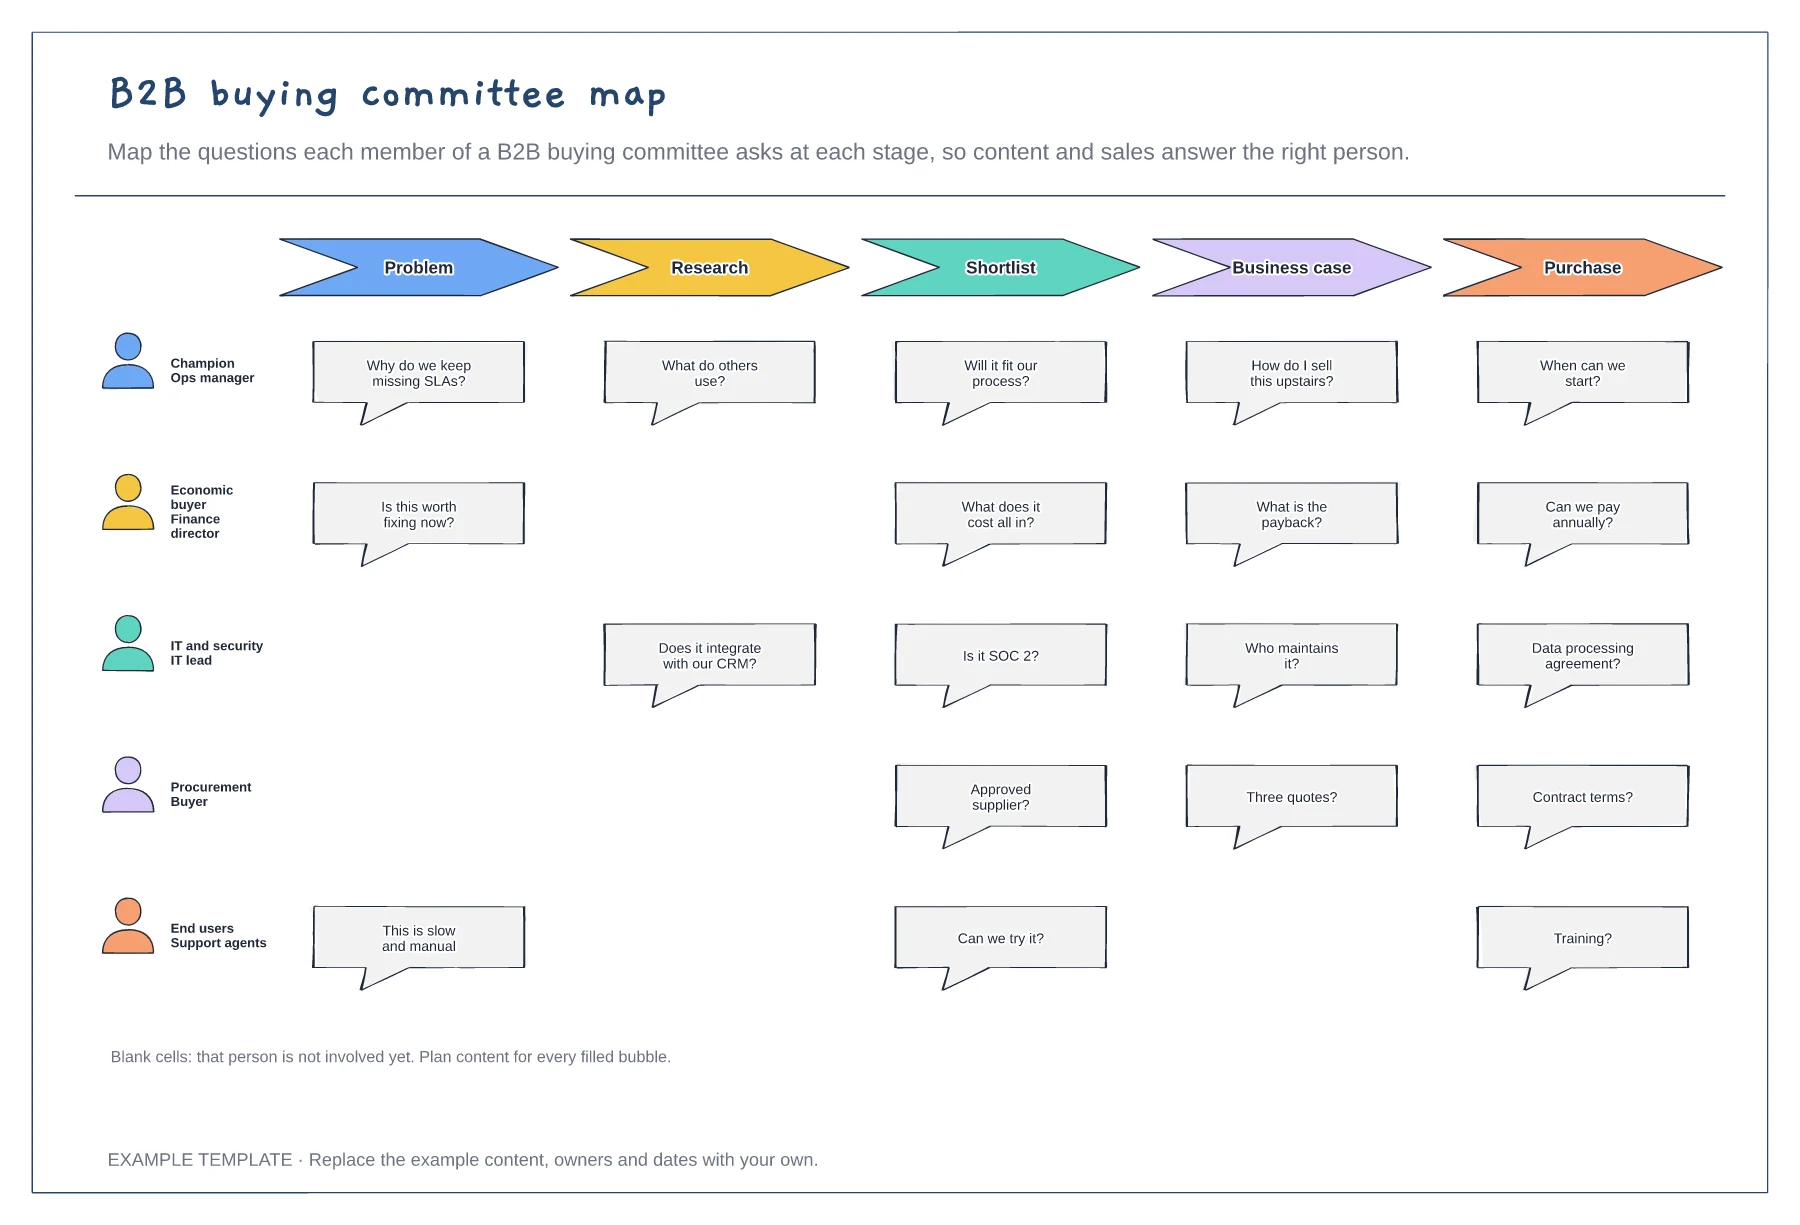
Five buying committee roles · Their questions at each stage · Gaps where a role is not yet involved
Preview and use template →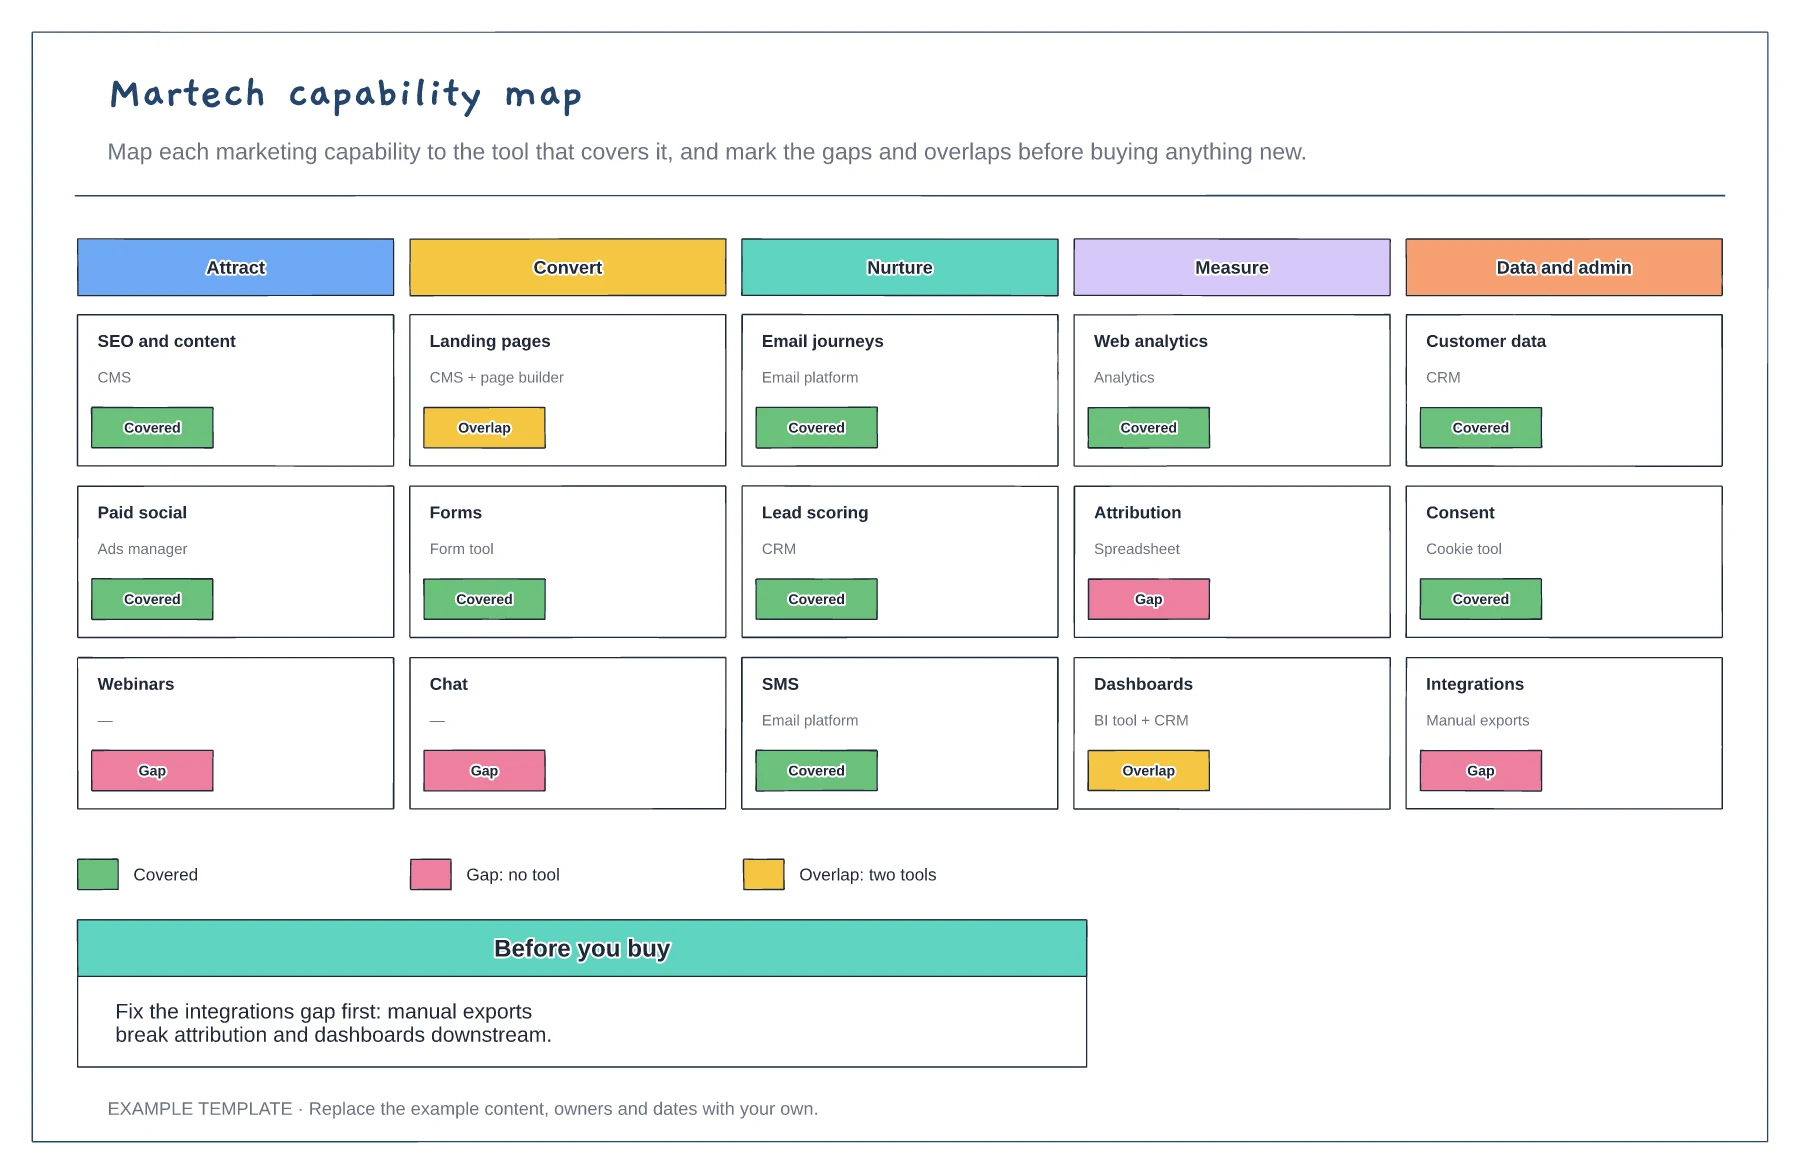
Capabilities in five stages · The tool covering each · Gaps and overlaps marked
Preview and use template →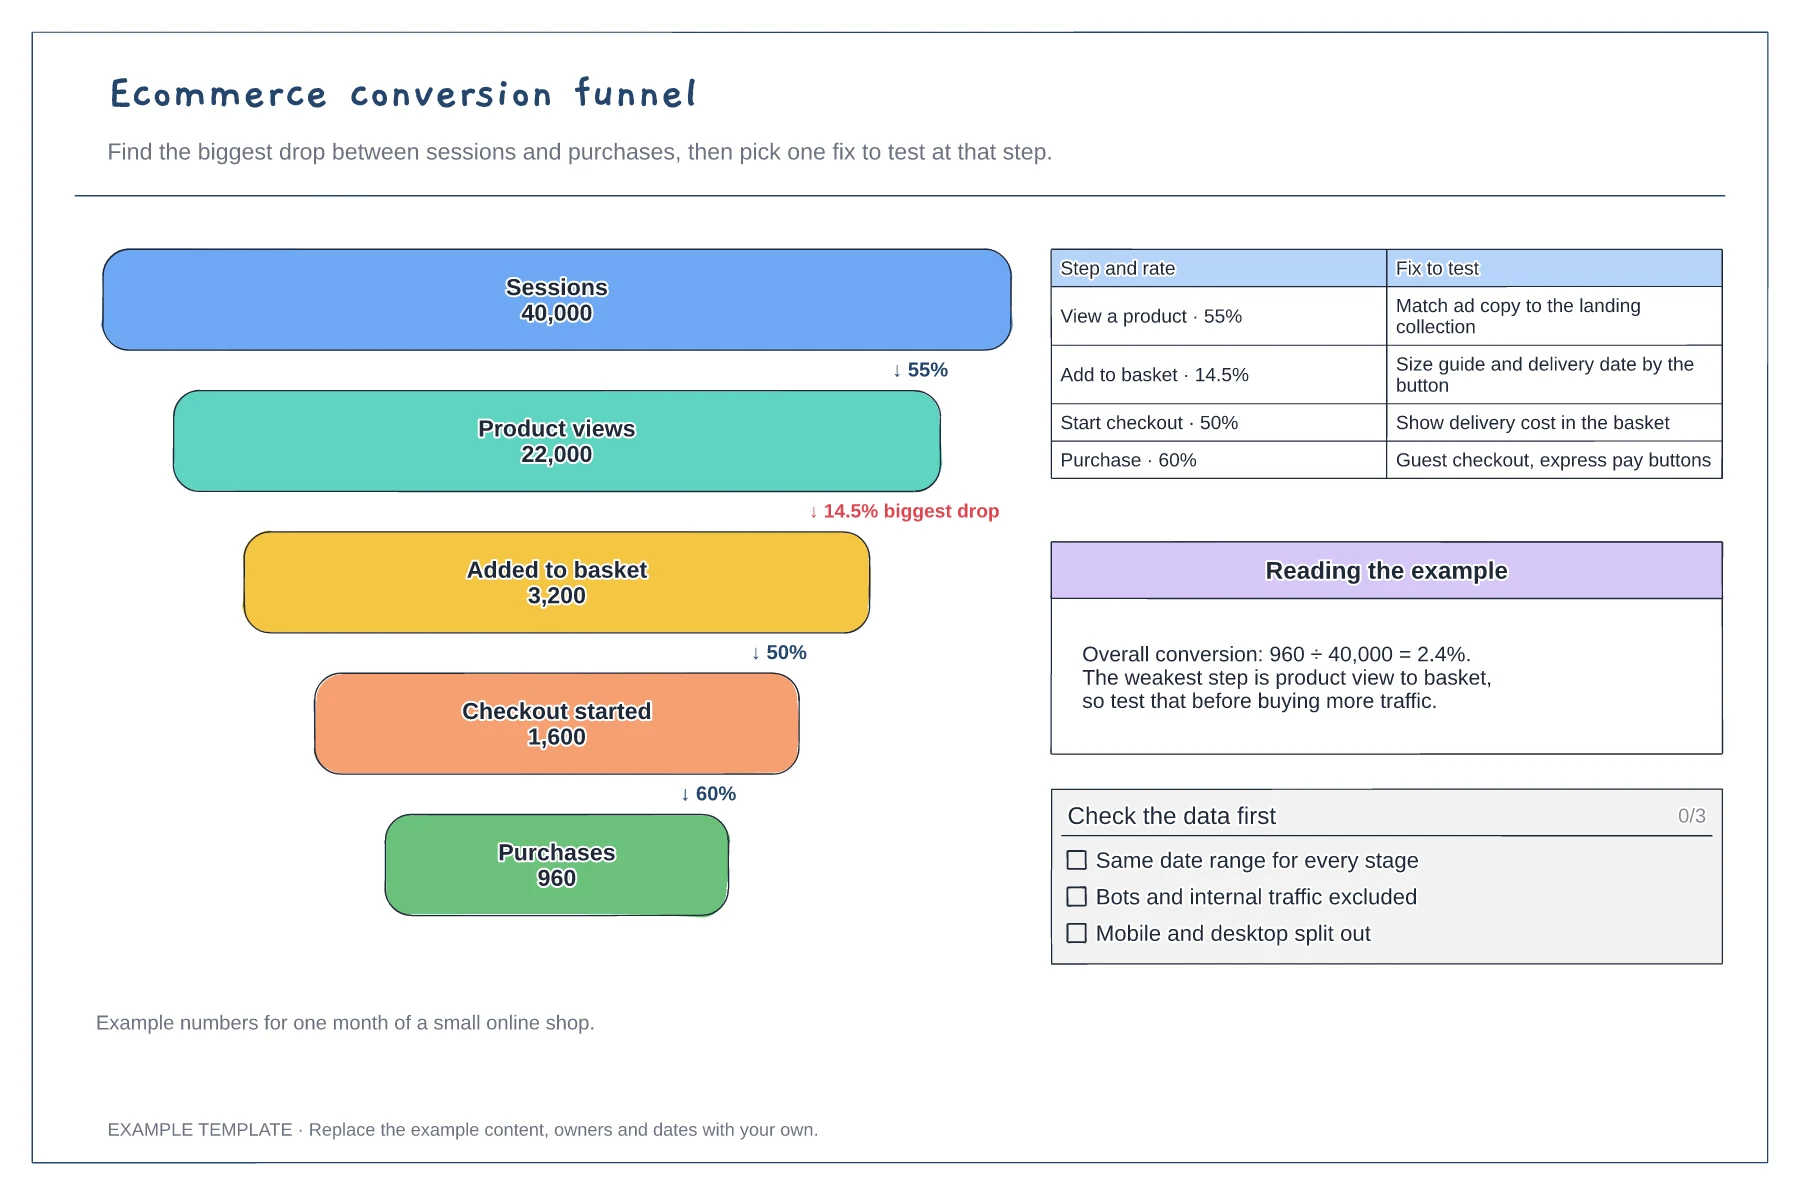
Five funnel stages with counts · Step rates and the biggest drop · A fix to test at each step
Preview and use template →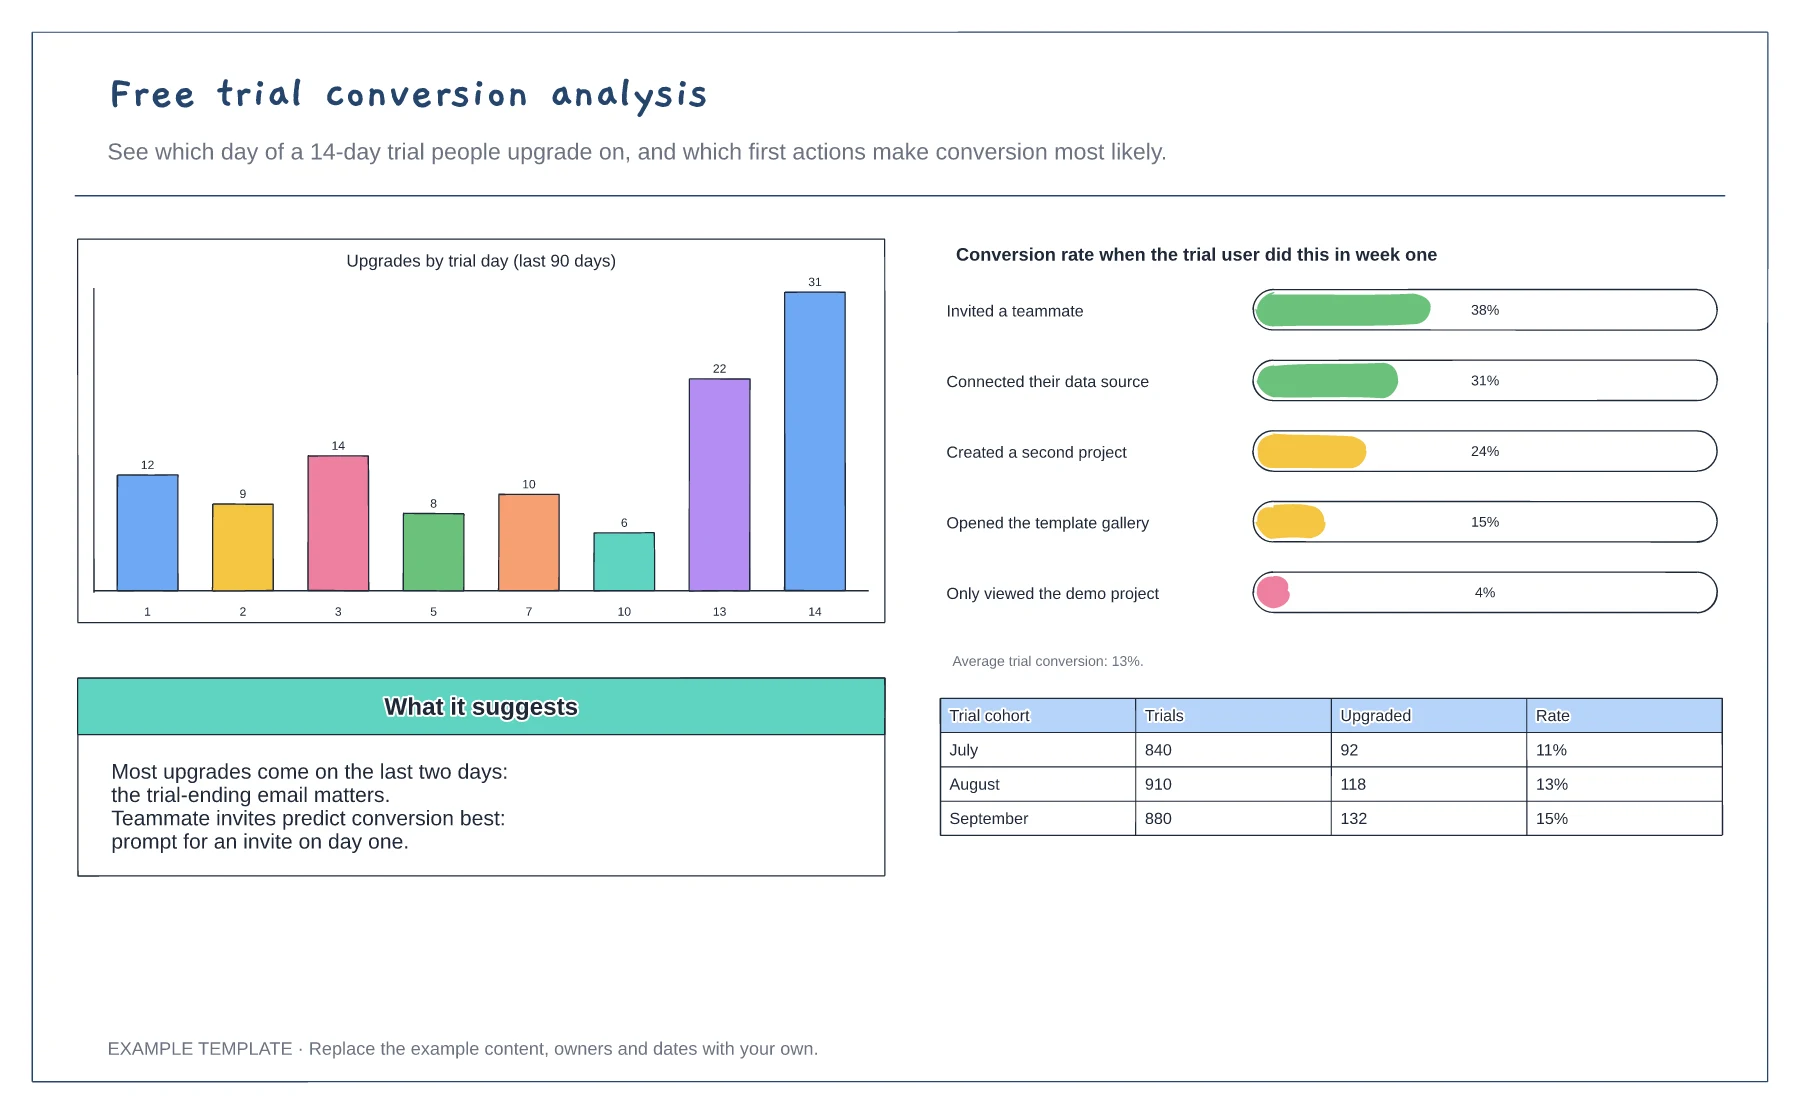
Upgrades by trial day · Conversion by first-week action · Monthly cohort table
Preview and use template →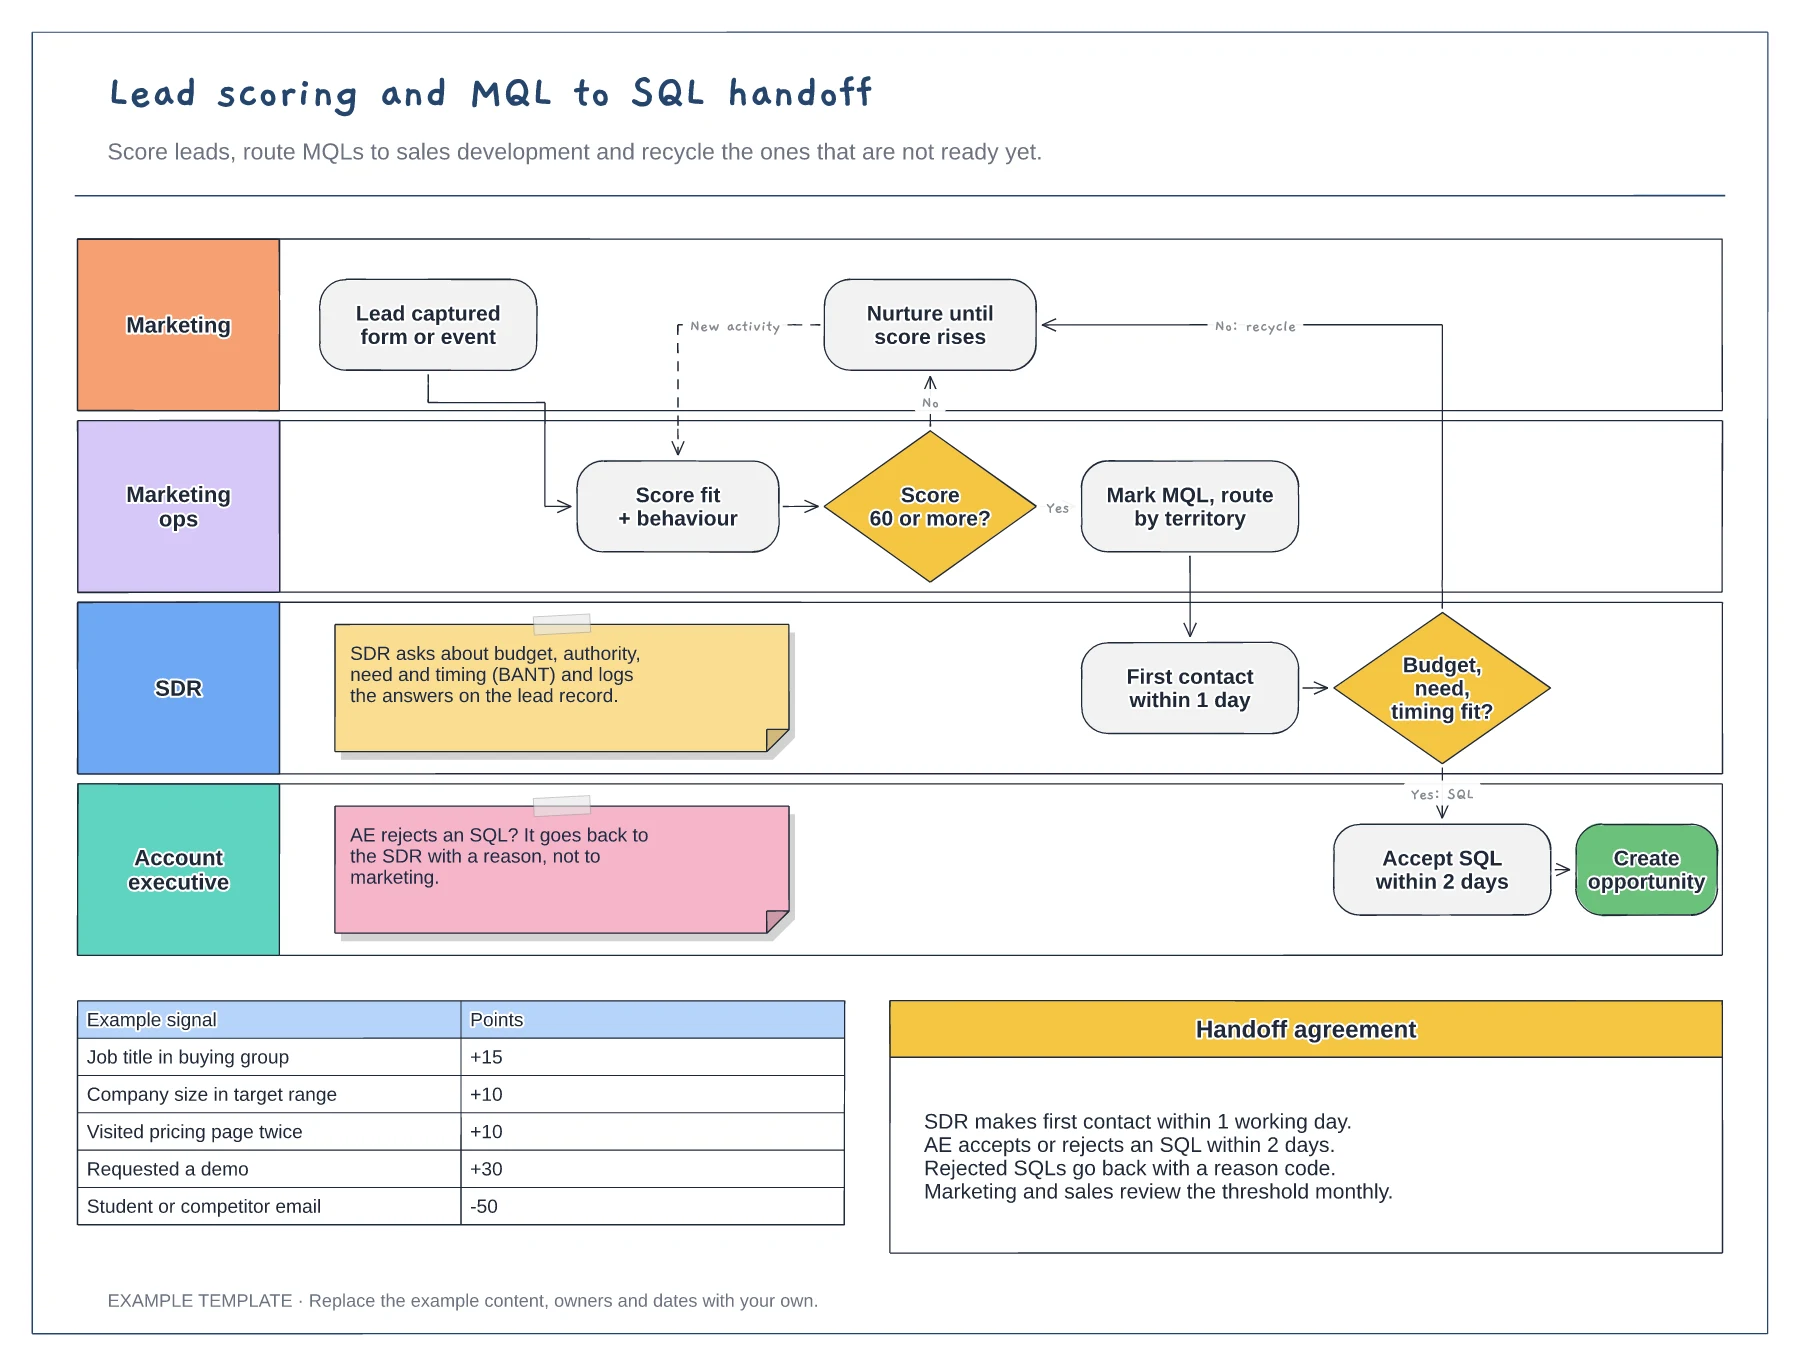
Swimlanes for marketing, marketing ops, SDR and AE · Example scoring model with points · Service-level agreement between the teams
Preview and use template →