Sales
Competitive battlecard template
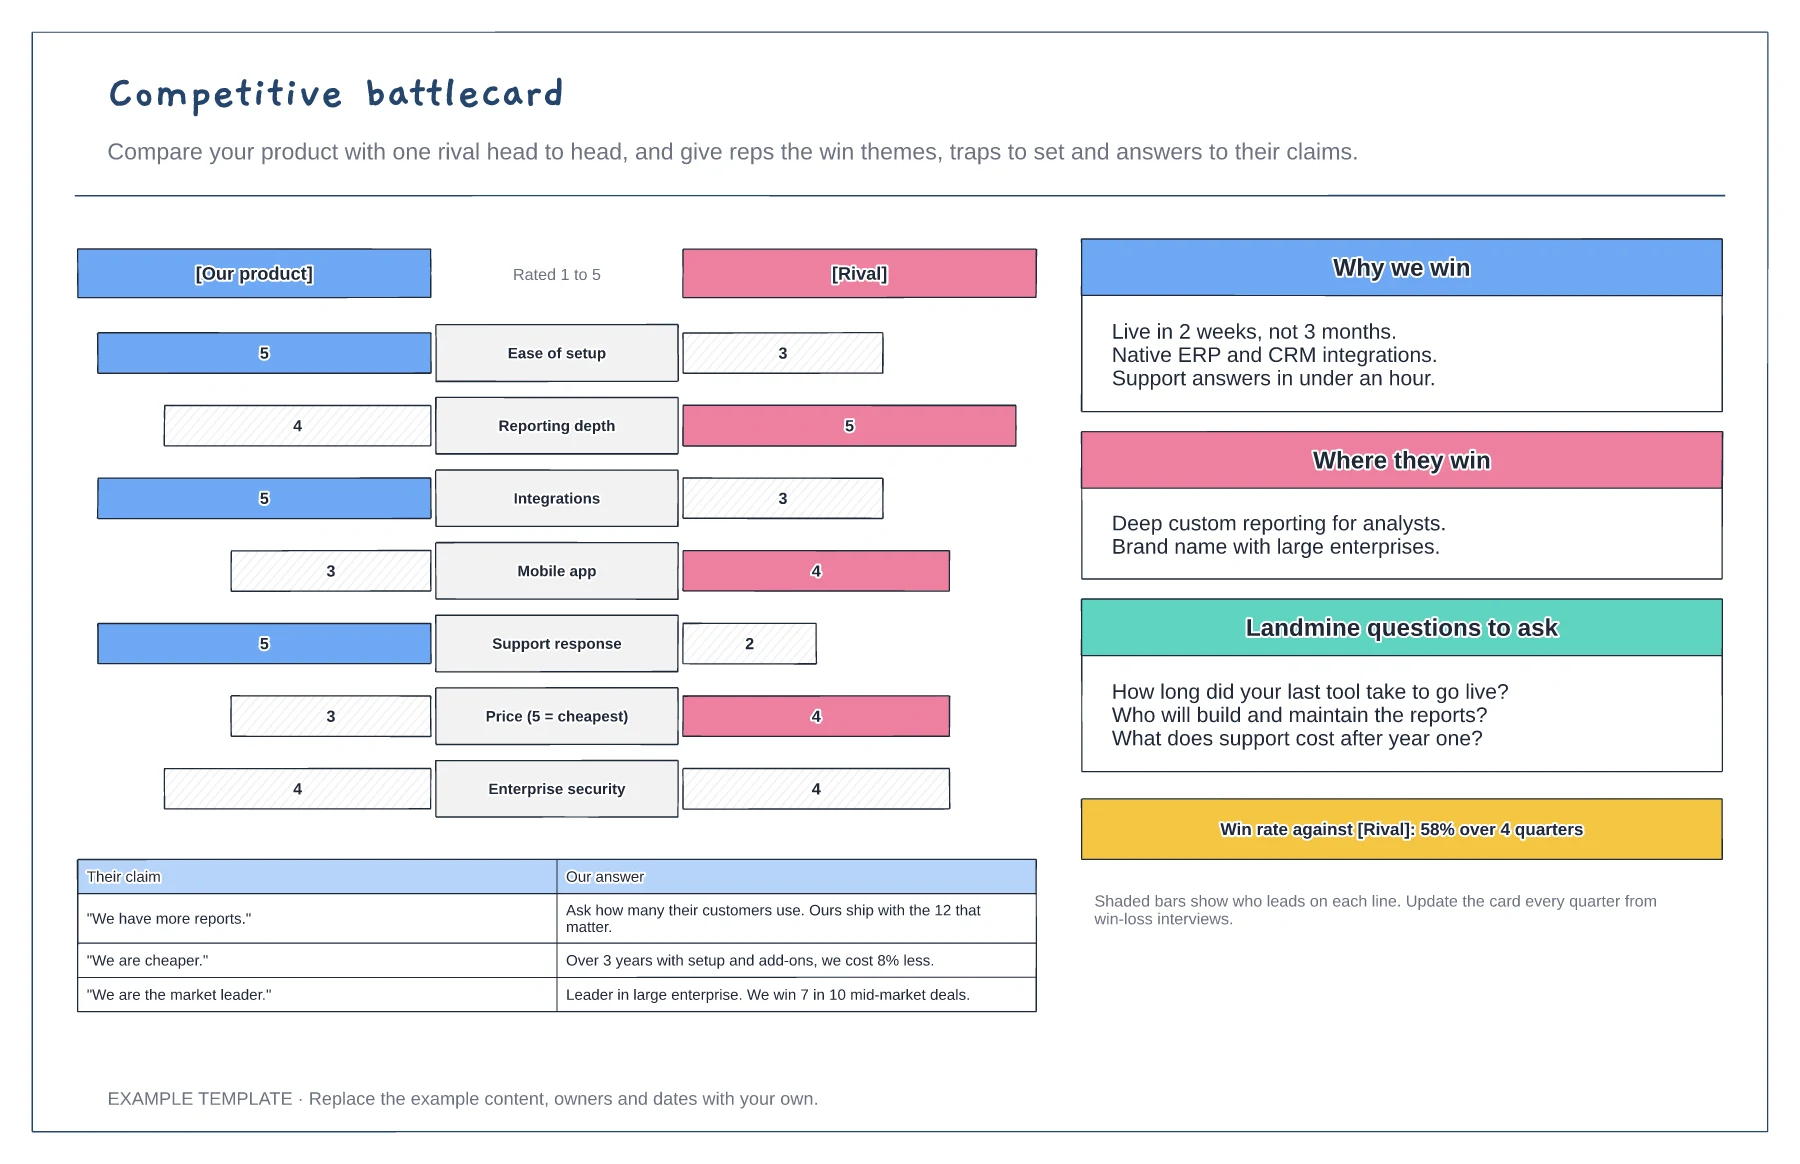
Head-to-head bar chart on seven criteria · Why we win and where they win · Landmine questions and claim answers
Preview and use template →Win-loss analysis looks back at deals you won and lost to find patterns you can act on. This example plots a year of deals by size and length of sales cycle, marked won or lost, and rings the cluster of large, slow deals that were lost. A chart shows the main loss reasons, sticky notes hold buyer quotes and a note sets out what to change.
No account needed · Opens as your own editable page
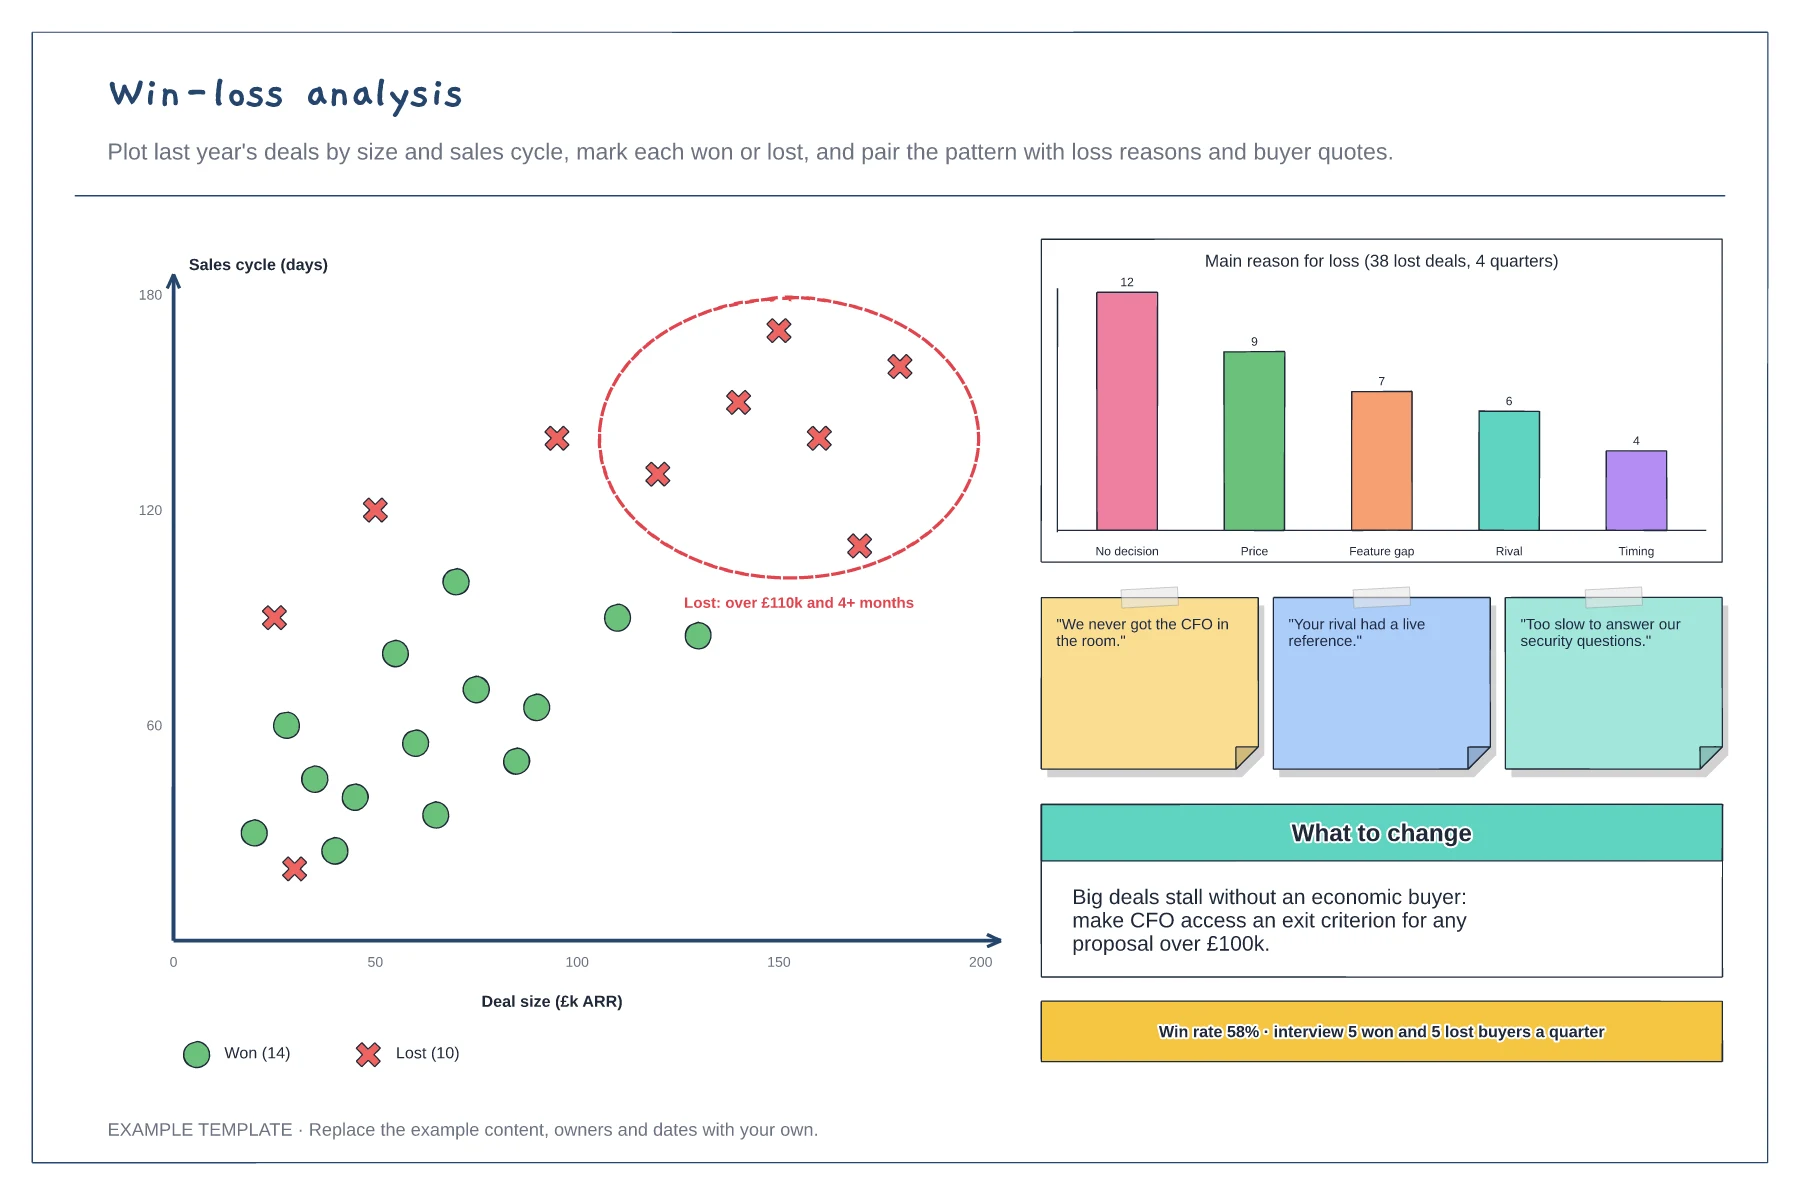
Plot each closed deal by value and days to close, marking whether it was won or lost. Look for clusters.
Record the main reason for each loss from the CRM and from buyer interviews, then count them.
Pick the pattern that costs the most and agree one change to the sales process or product to test next quarter.
Yes. Move or copy the won and lost dots so each sits at its deal size and sales cycle, then update the loss reason bars and buyer quotes.
No. Open the template and edit it in your browser. Your work saves on this device. An account is optional if you want to sync your workspace.
Yes. Use Export in the editor to save a PNG, SVG or PDF, or download an editable .epicdraw backup.
Head-to-head bar chart on seven criteria · Why we win and where they win · Landmine questions and claim answers
Preview and use template →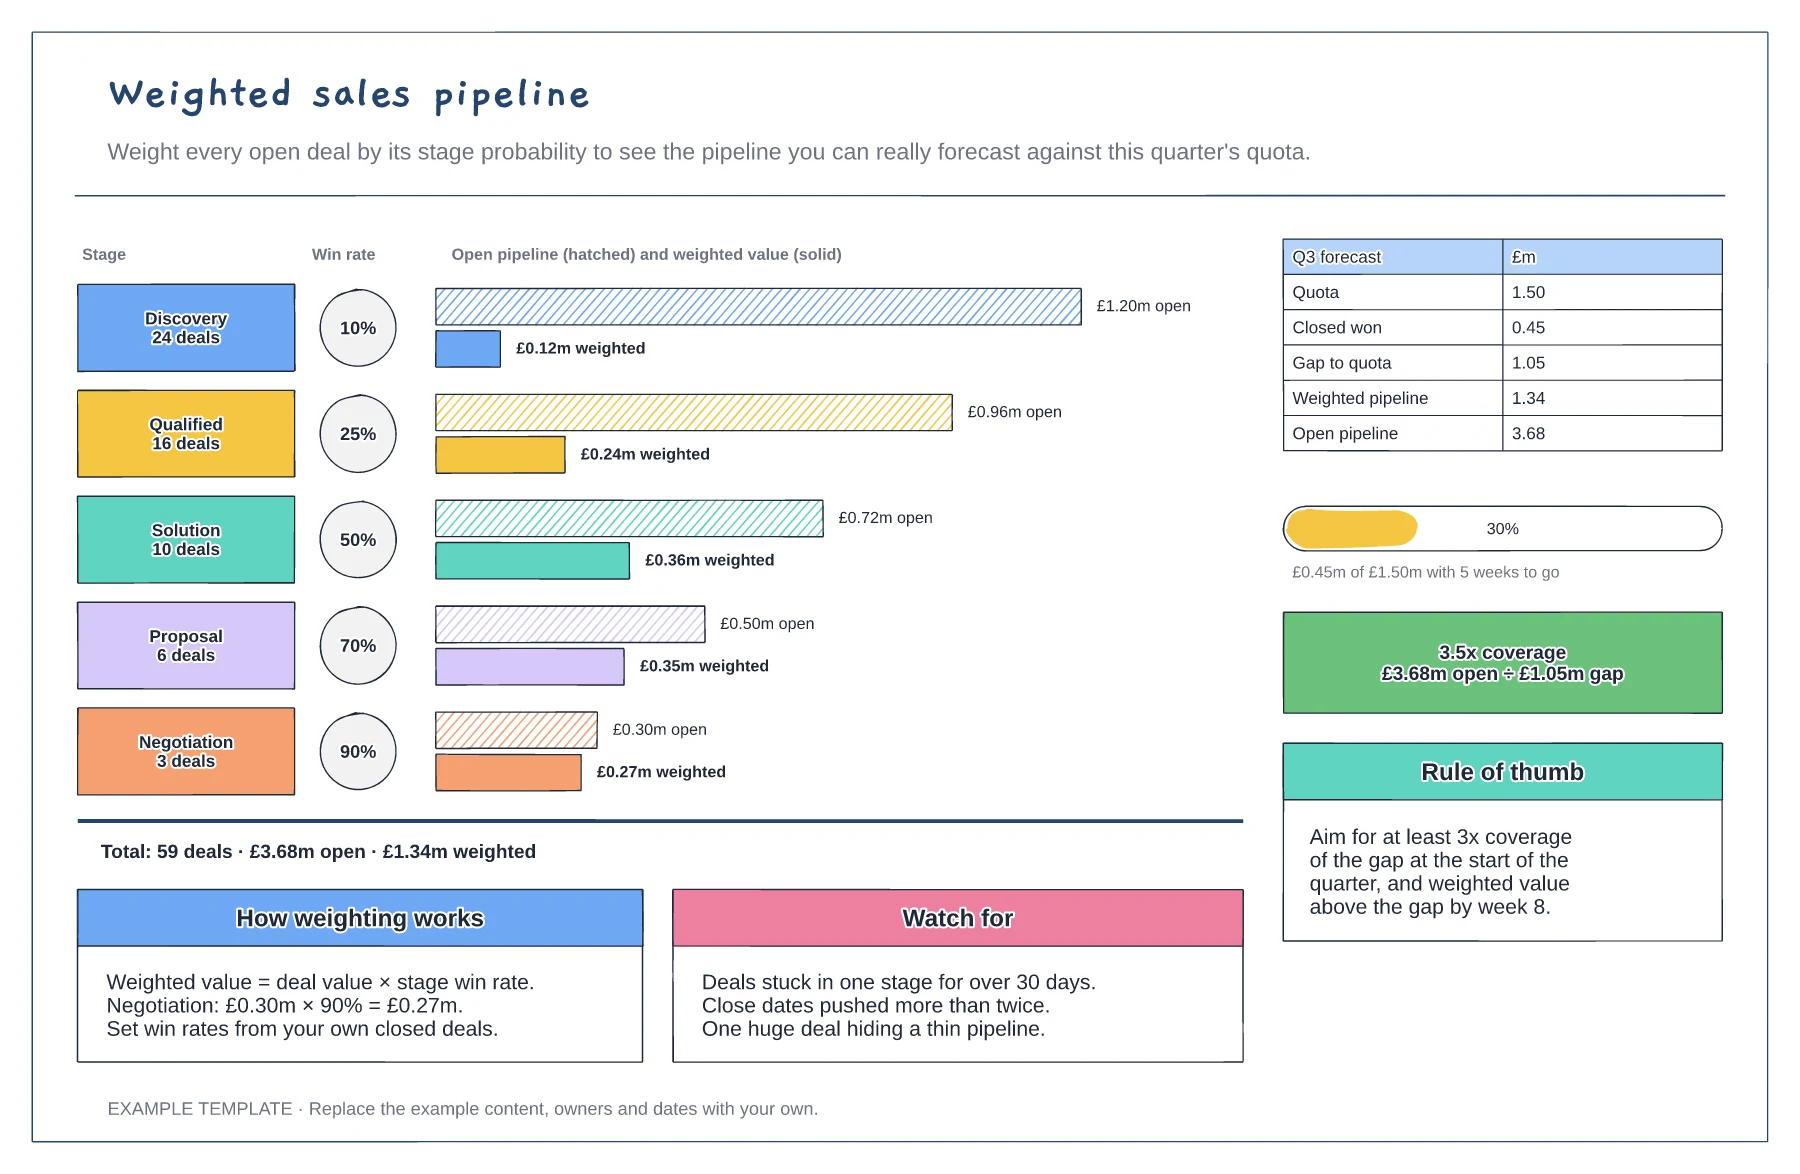
Open and weighted value for each stage · Stage win rates and deal counts · Quota gap, attainment and coverage
Preview and use template →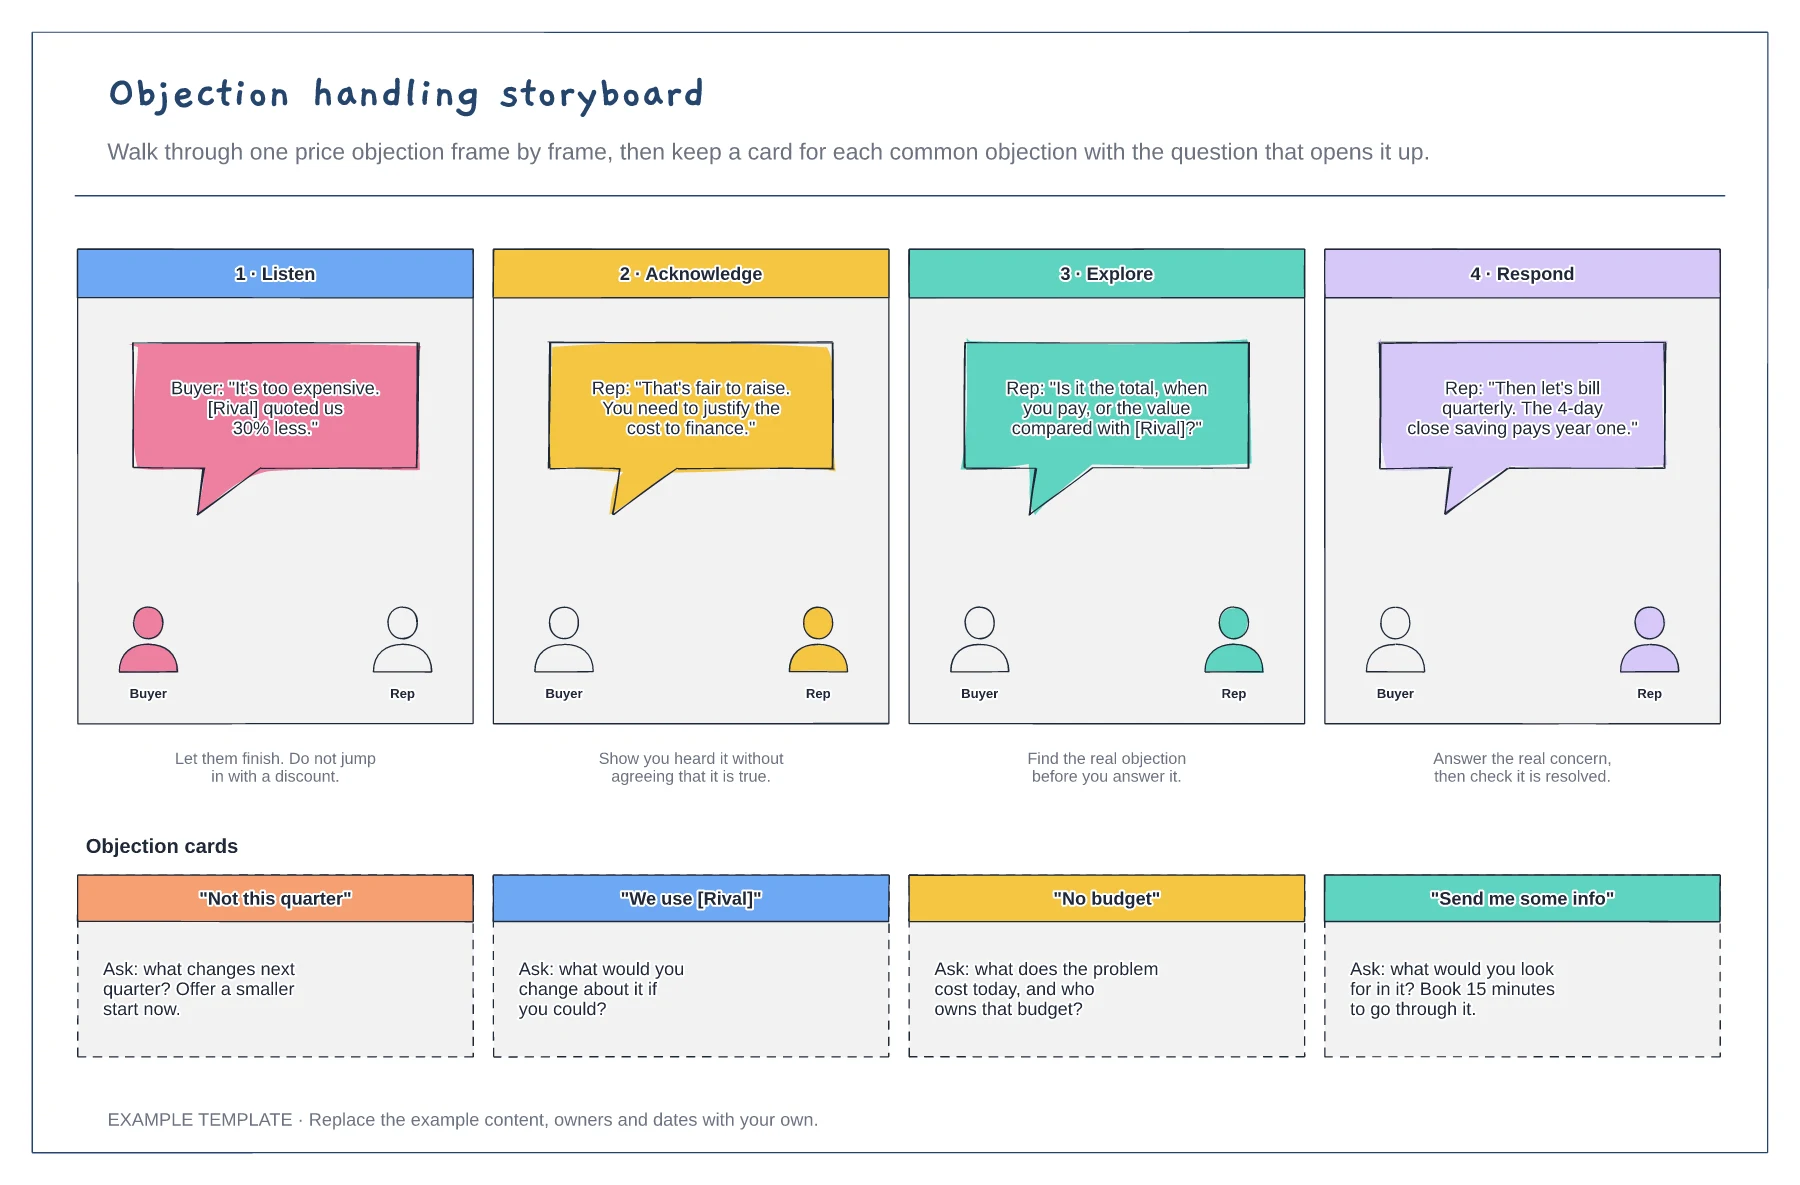
Four-frame storyboard of one objection · What the buyer and rep say · Cards for common objections
Preview and use template →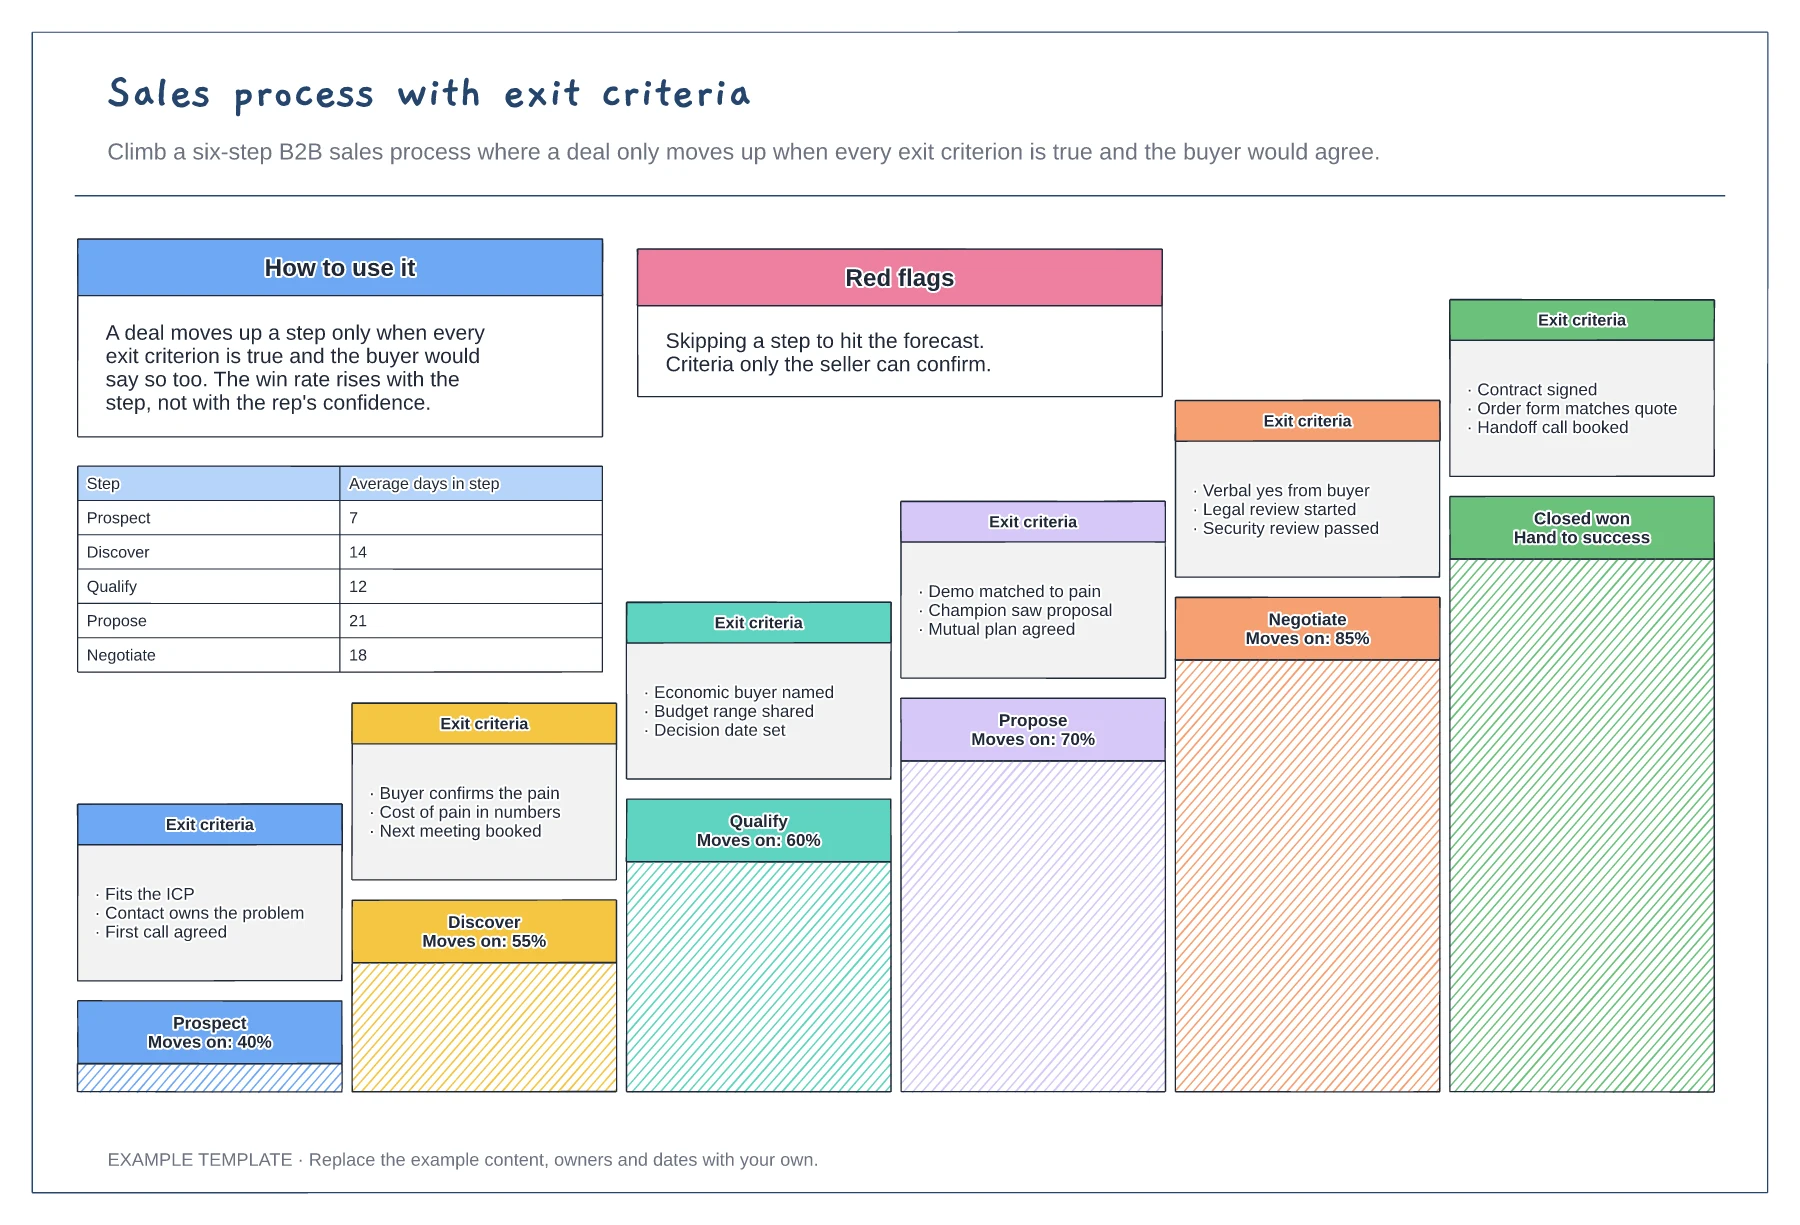
Six stages drawn as a staircase · Exit criteria the buyer could confirm · Conversion and days in each step
Preview and use template →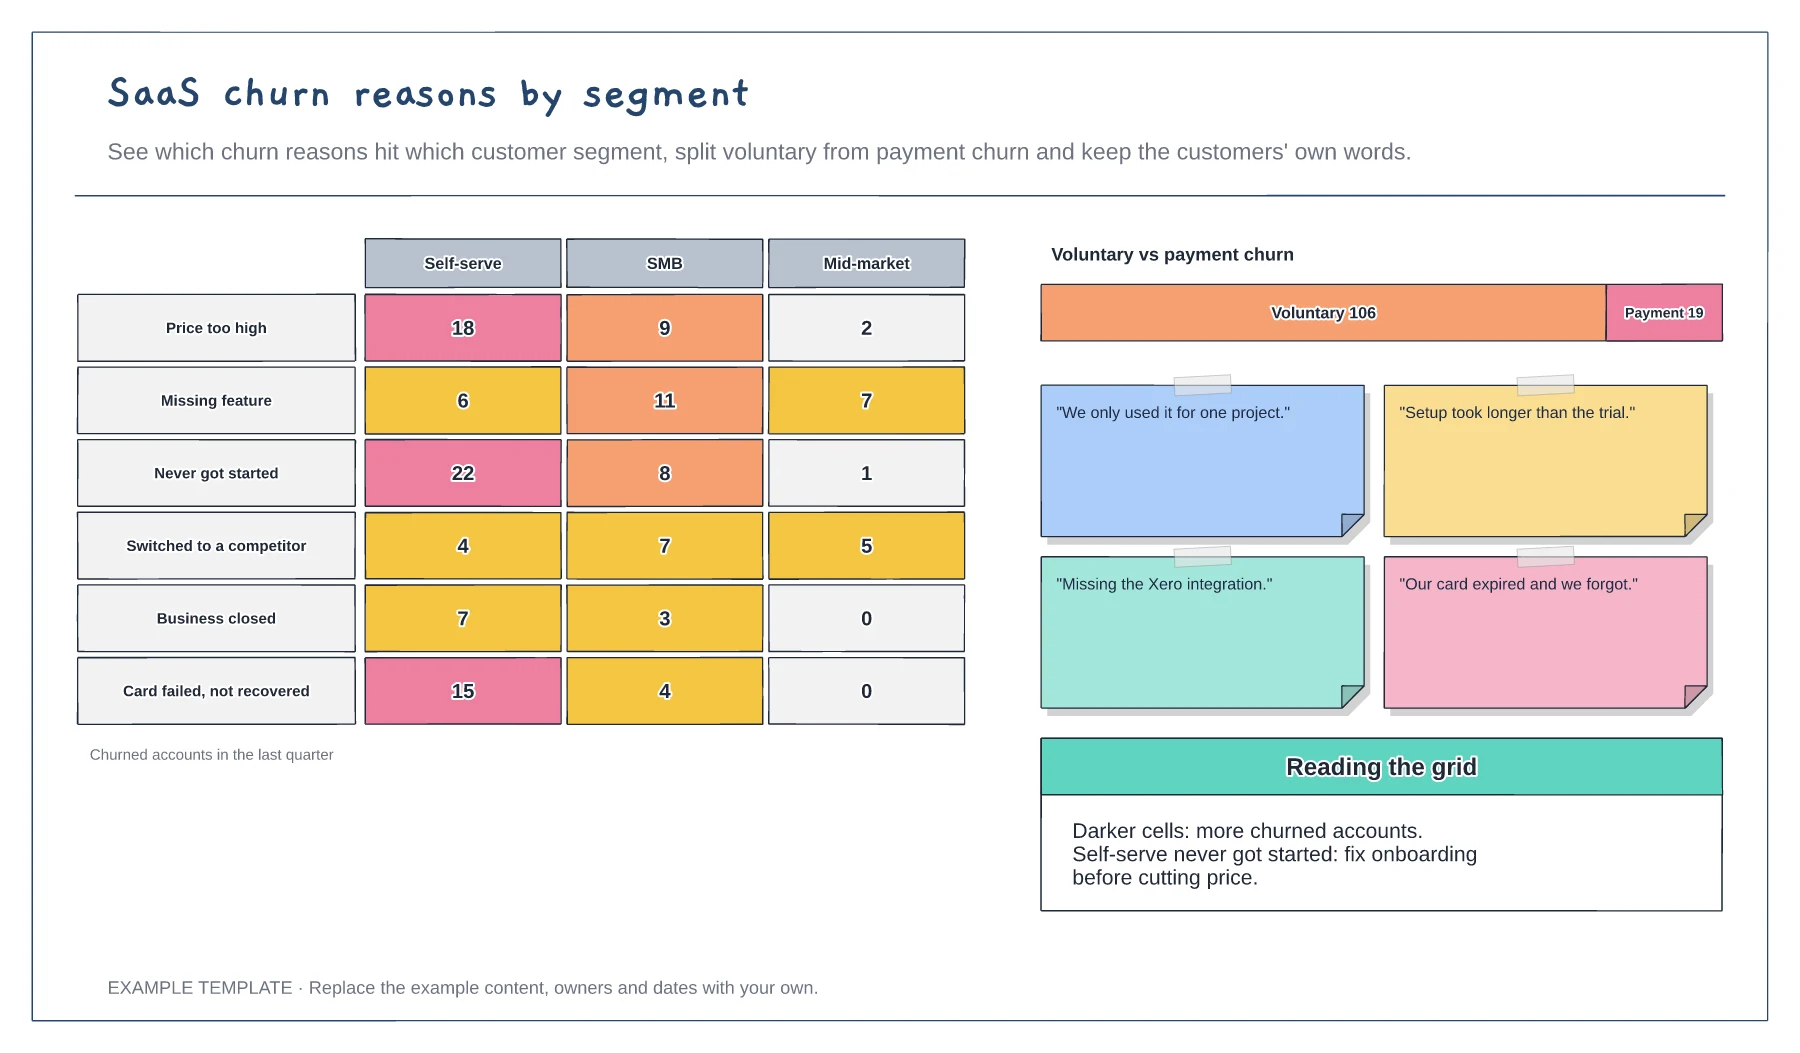
Heat grid of churn reasons by segment · Voluntary versus payment churn split · Customer quotes beside the data
Preview and use template →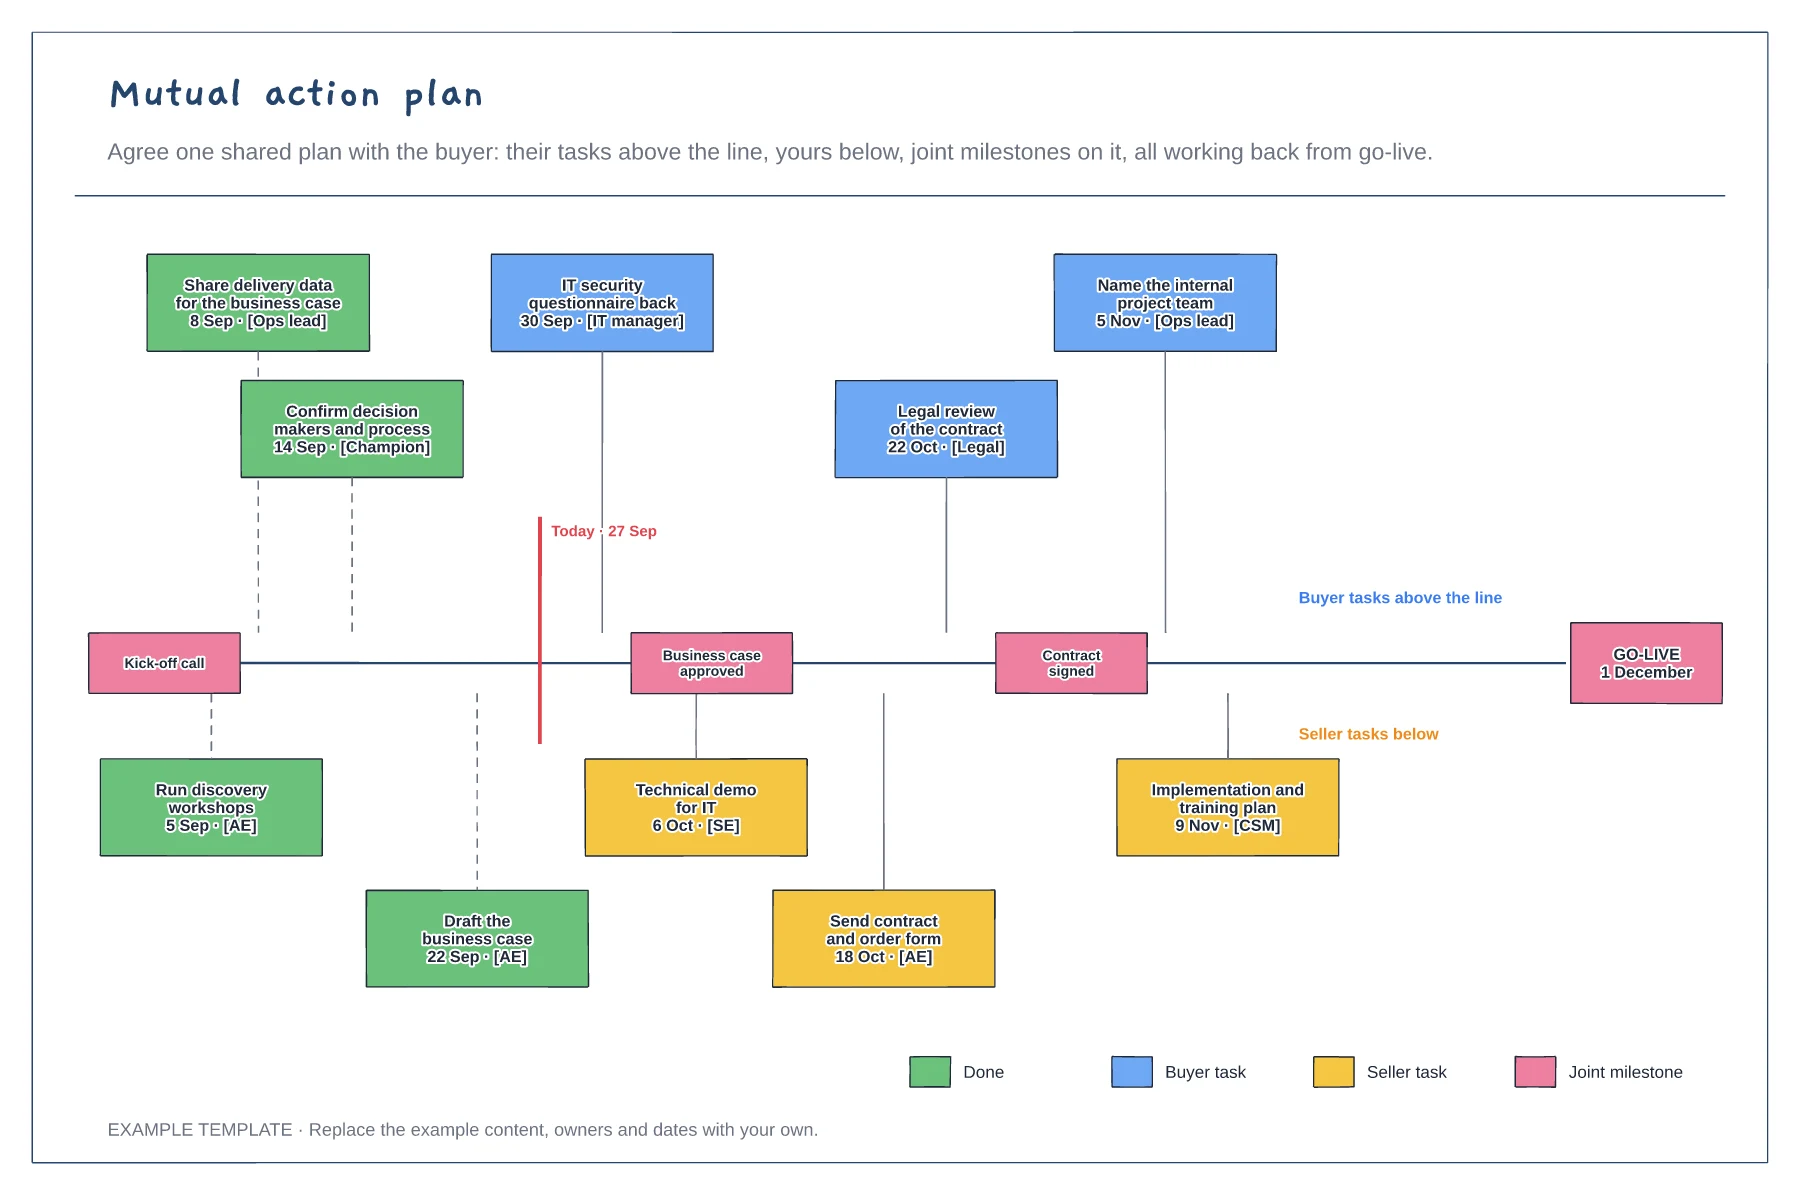
Buyer and seller tasks on one timeline · Joint milestones and a go-live date · Owners, dates and what is done
Preview and use template →