Sales
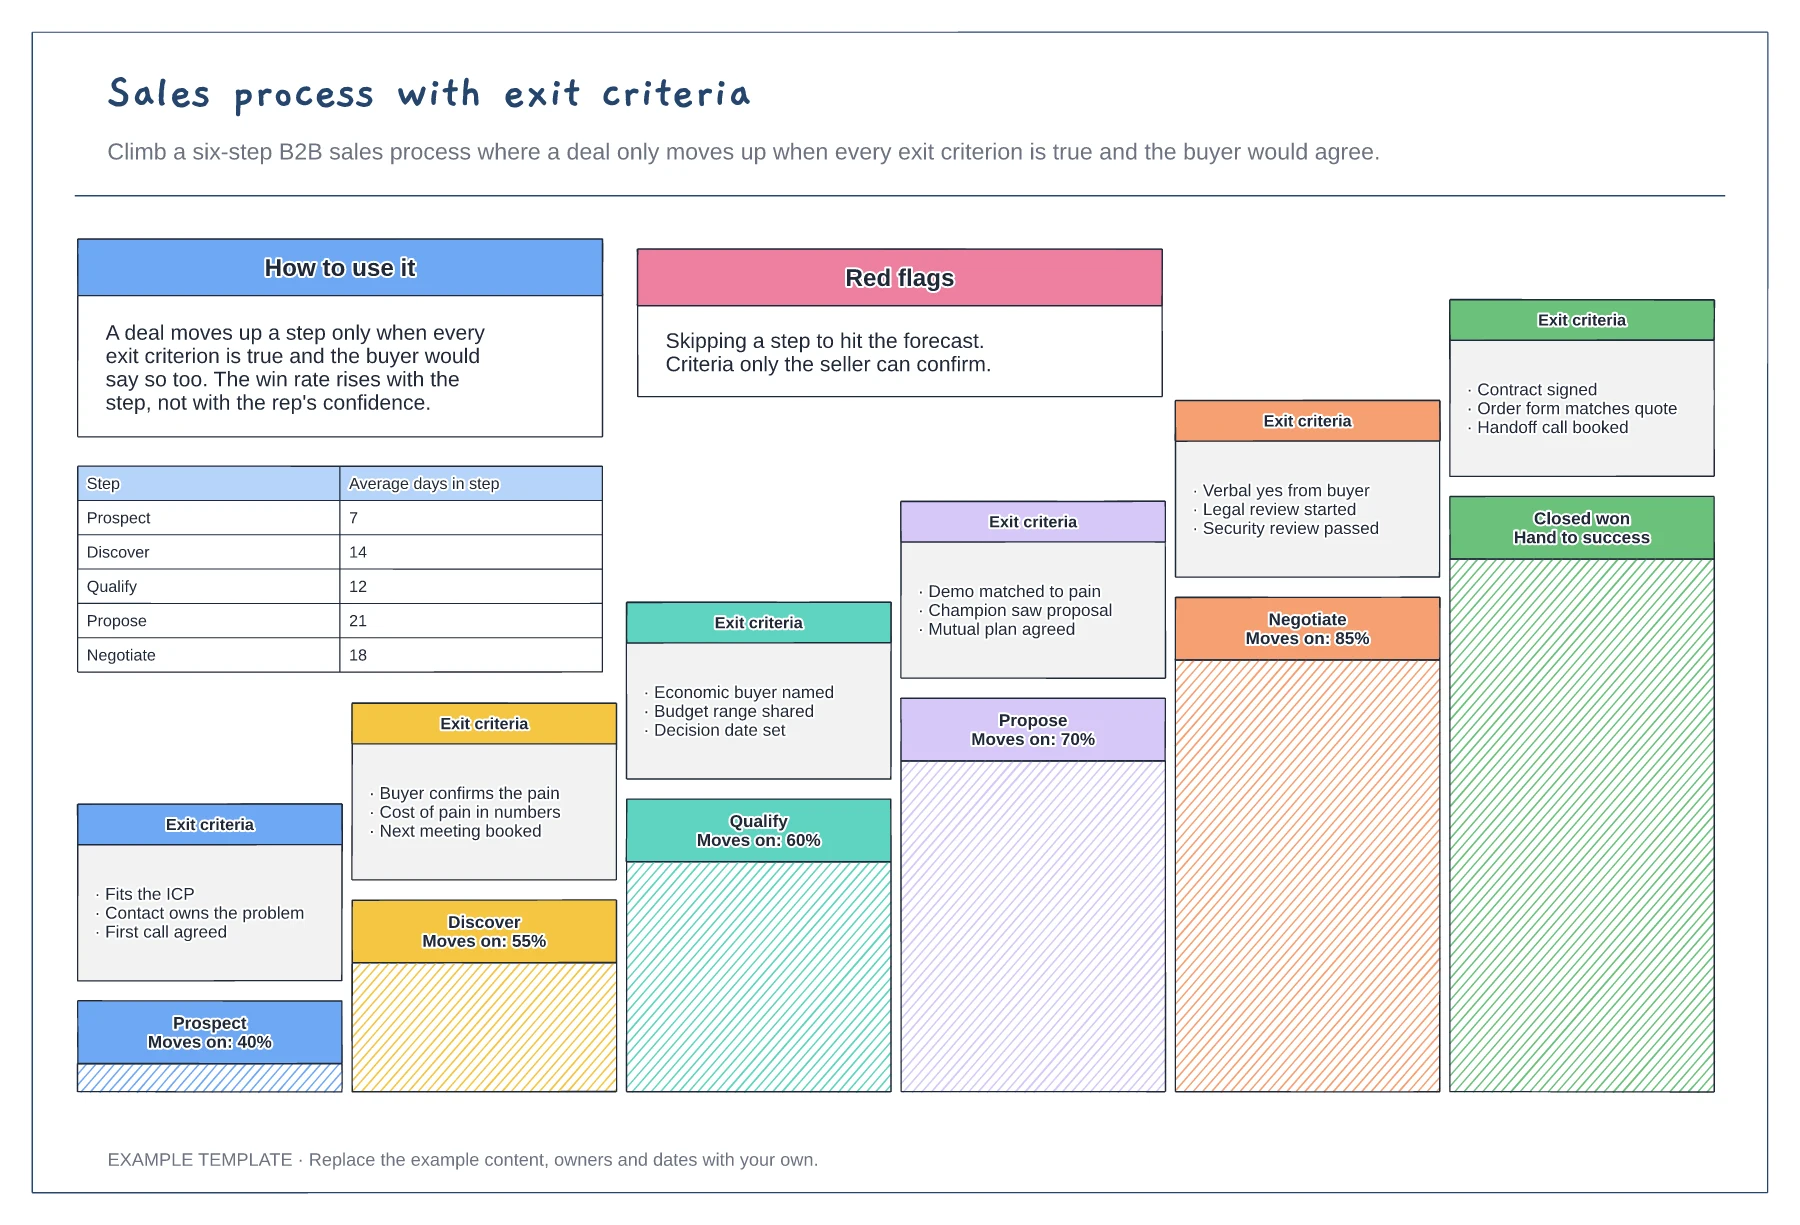
Sales process with exit criteria template
Six stages drawn as a staircase · Exit criteria the buyer could confirm · Conversion and days in each step
Preview and use template →A weighted sales pipeline multiplies every open deal by the win rate of its stage, so a pile of early-stage deals does not look like a safe forecast. This example shows five stages with their deal counts and win rates, open value beside weighted value for each stage, the gap to the quarterly quota and how many times the pipeline covers that gap.
No account needed · Opens as your own editable page
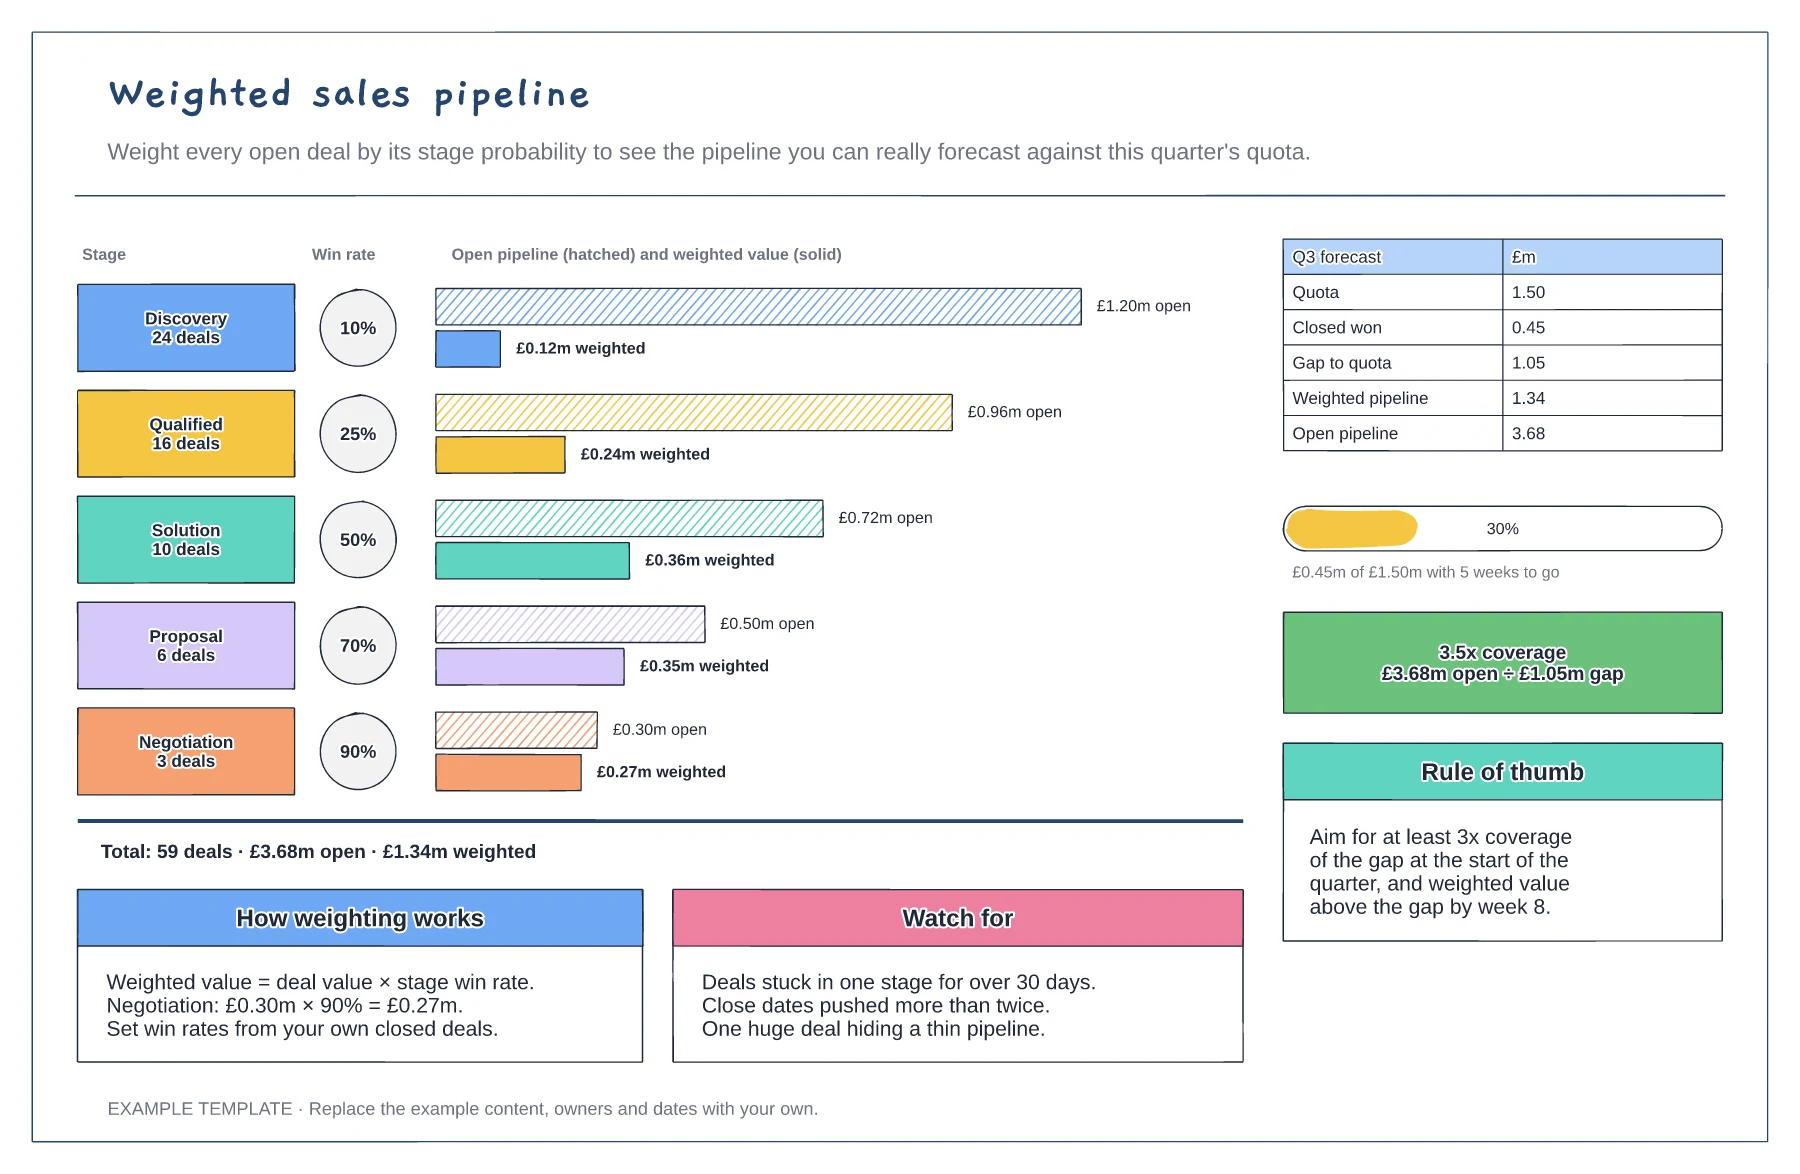
Use your own closed deals from the last four quarters to find how often a deal in each stage goes on to close. Avoid round guesses.
Multiply each deal by its stage win rate and add them up by stage. Draw open and weighted value side by side so the drop is obvious.
Subtract closed won from the quota to find the gap, then check weighted value and coverage against it each week.
The hatched bar is the open pipeline value at each stage and the solid bar is the weighted value: the open value multiplied by that stage's win rate.
No. Open the template and edit it in your browser. Your work saves on this device. An account is optional if you want to sync your workspace.
Yes. Use Export in the editor to save a PNG, SVG or PDF, or download an editable .epicdraw backup.
Six stages drawn as a staircase · Exit criteria the buyer could confirm · Conversion and days in each step
Preview and use template →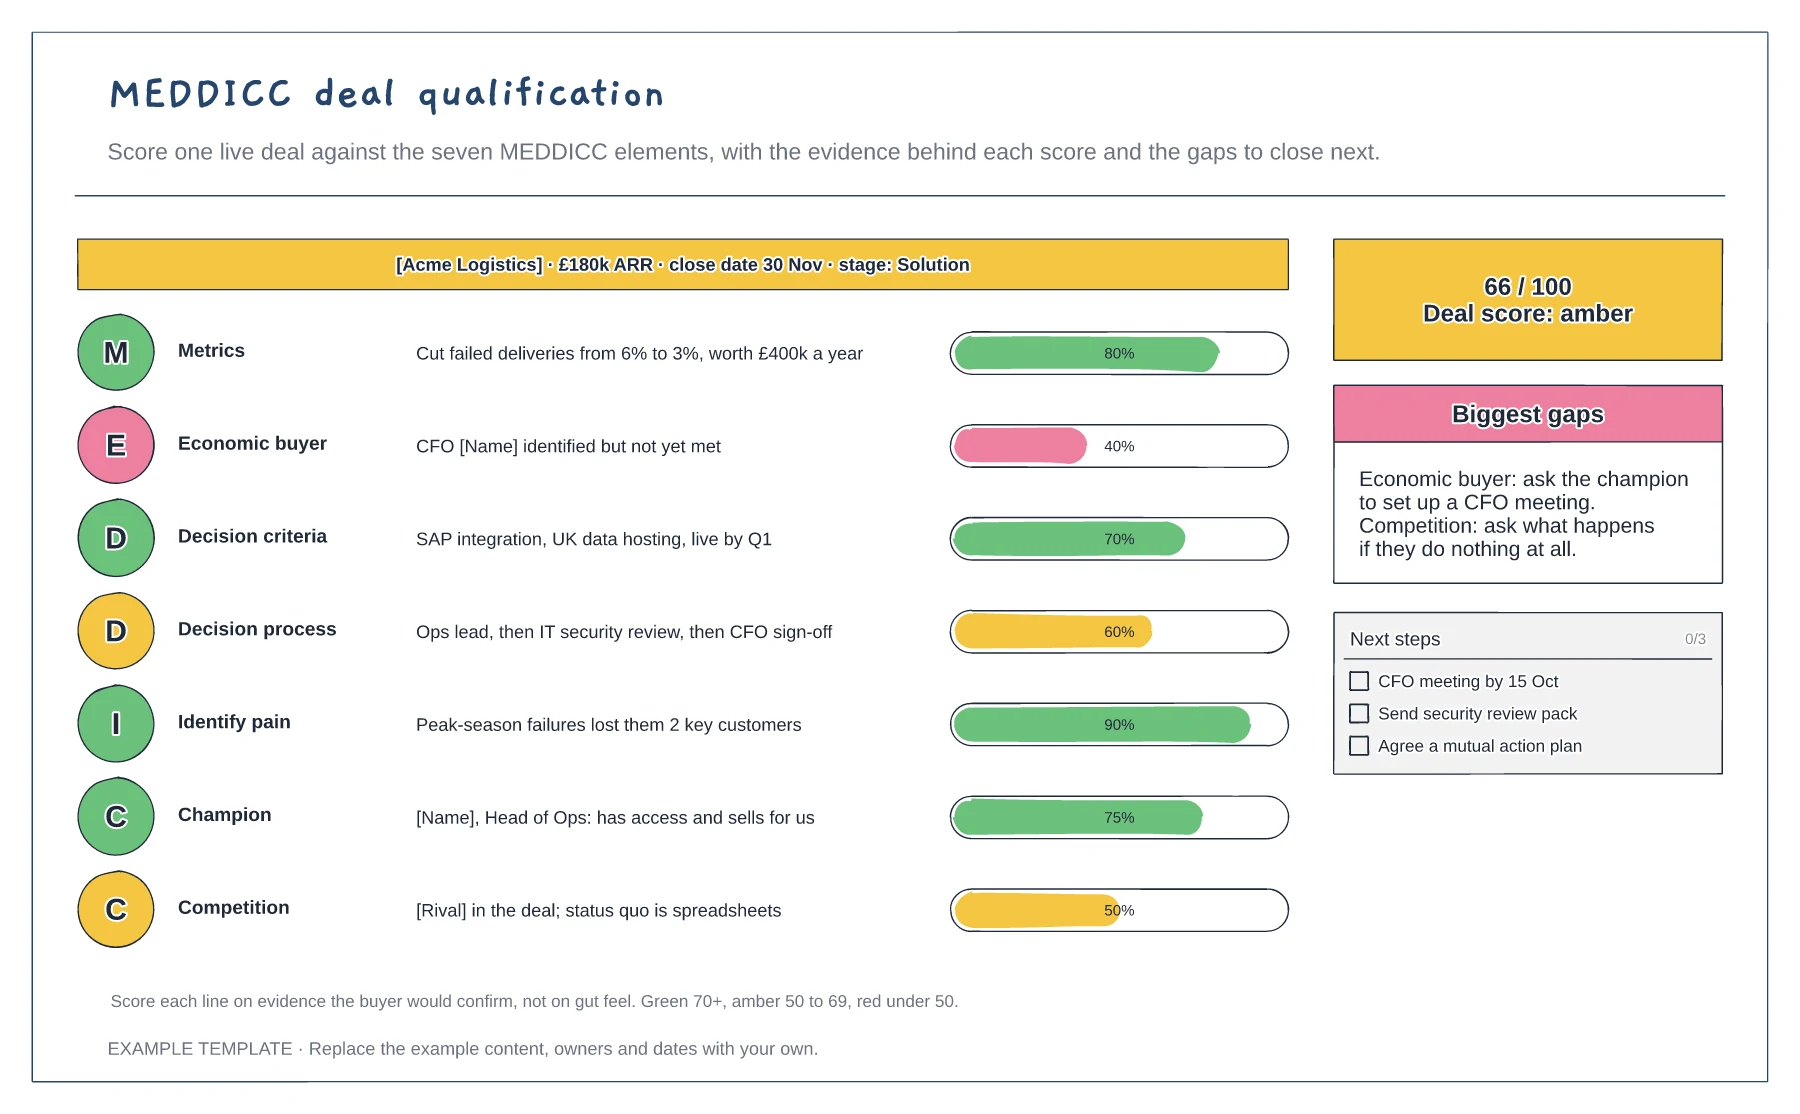
One row for each MEDDICC element · Evidence and a scored bar for each · Overall score, gaps and next steps
Preview and use template →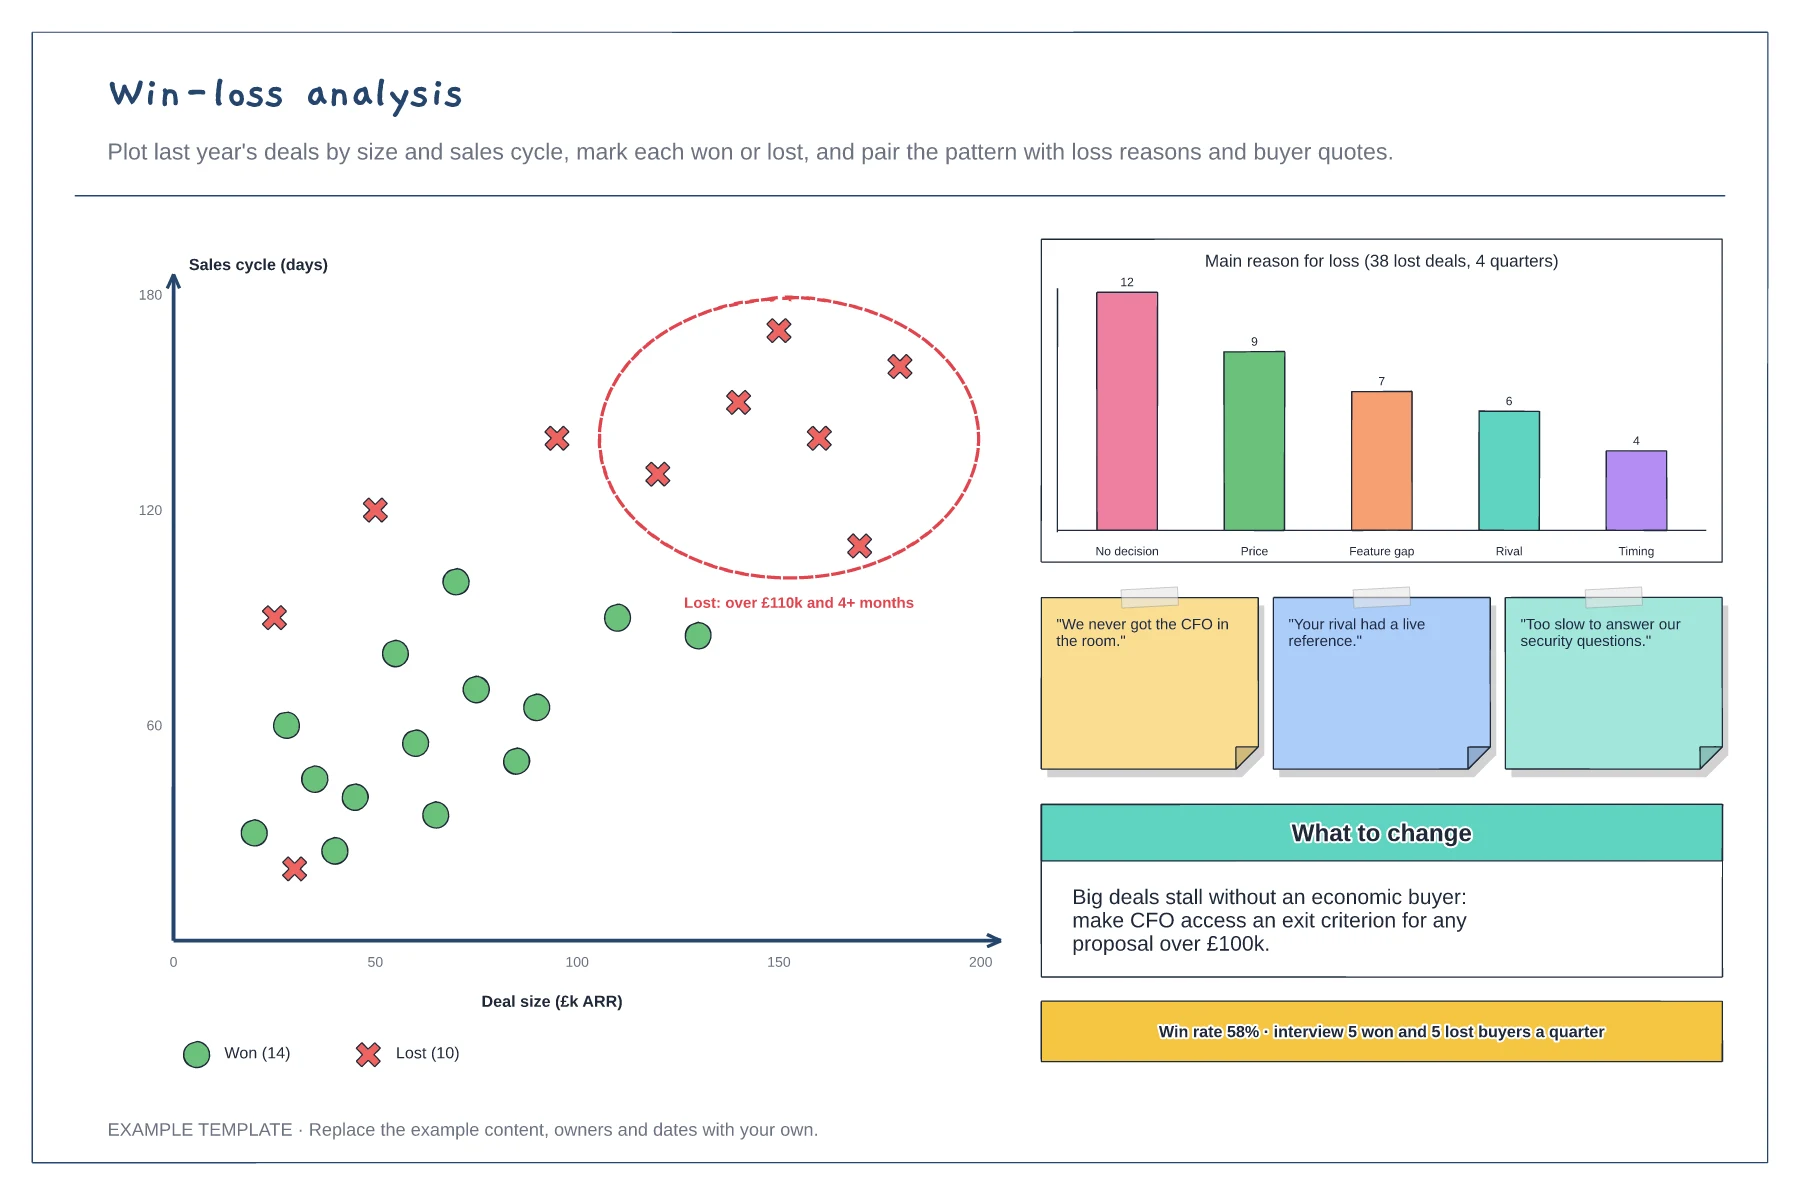
Scatter plot of won and lost deals · Main reasons for loss · Buyer quotes and the change to make
Preview and use template →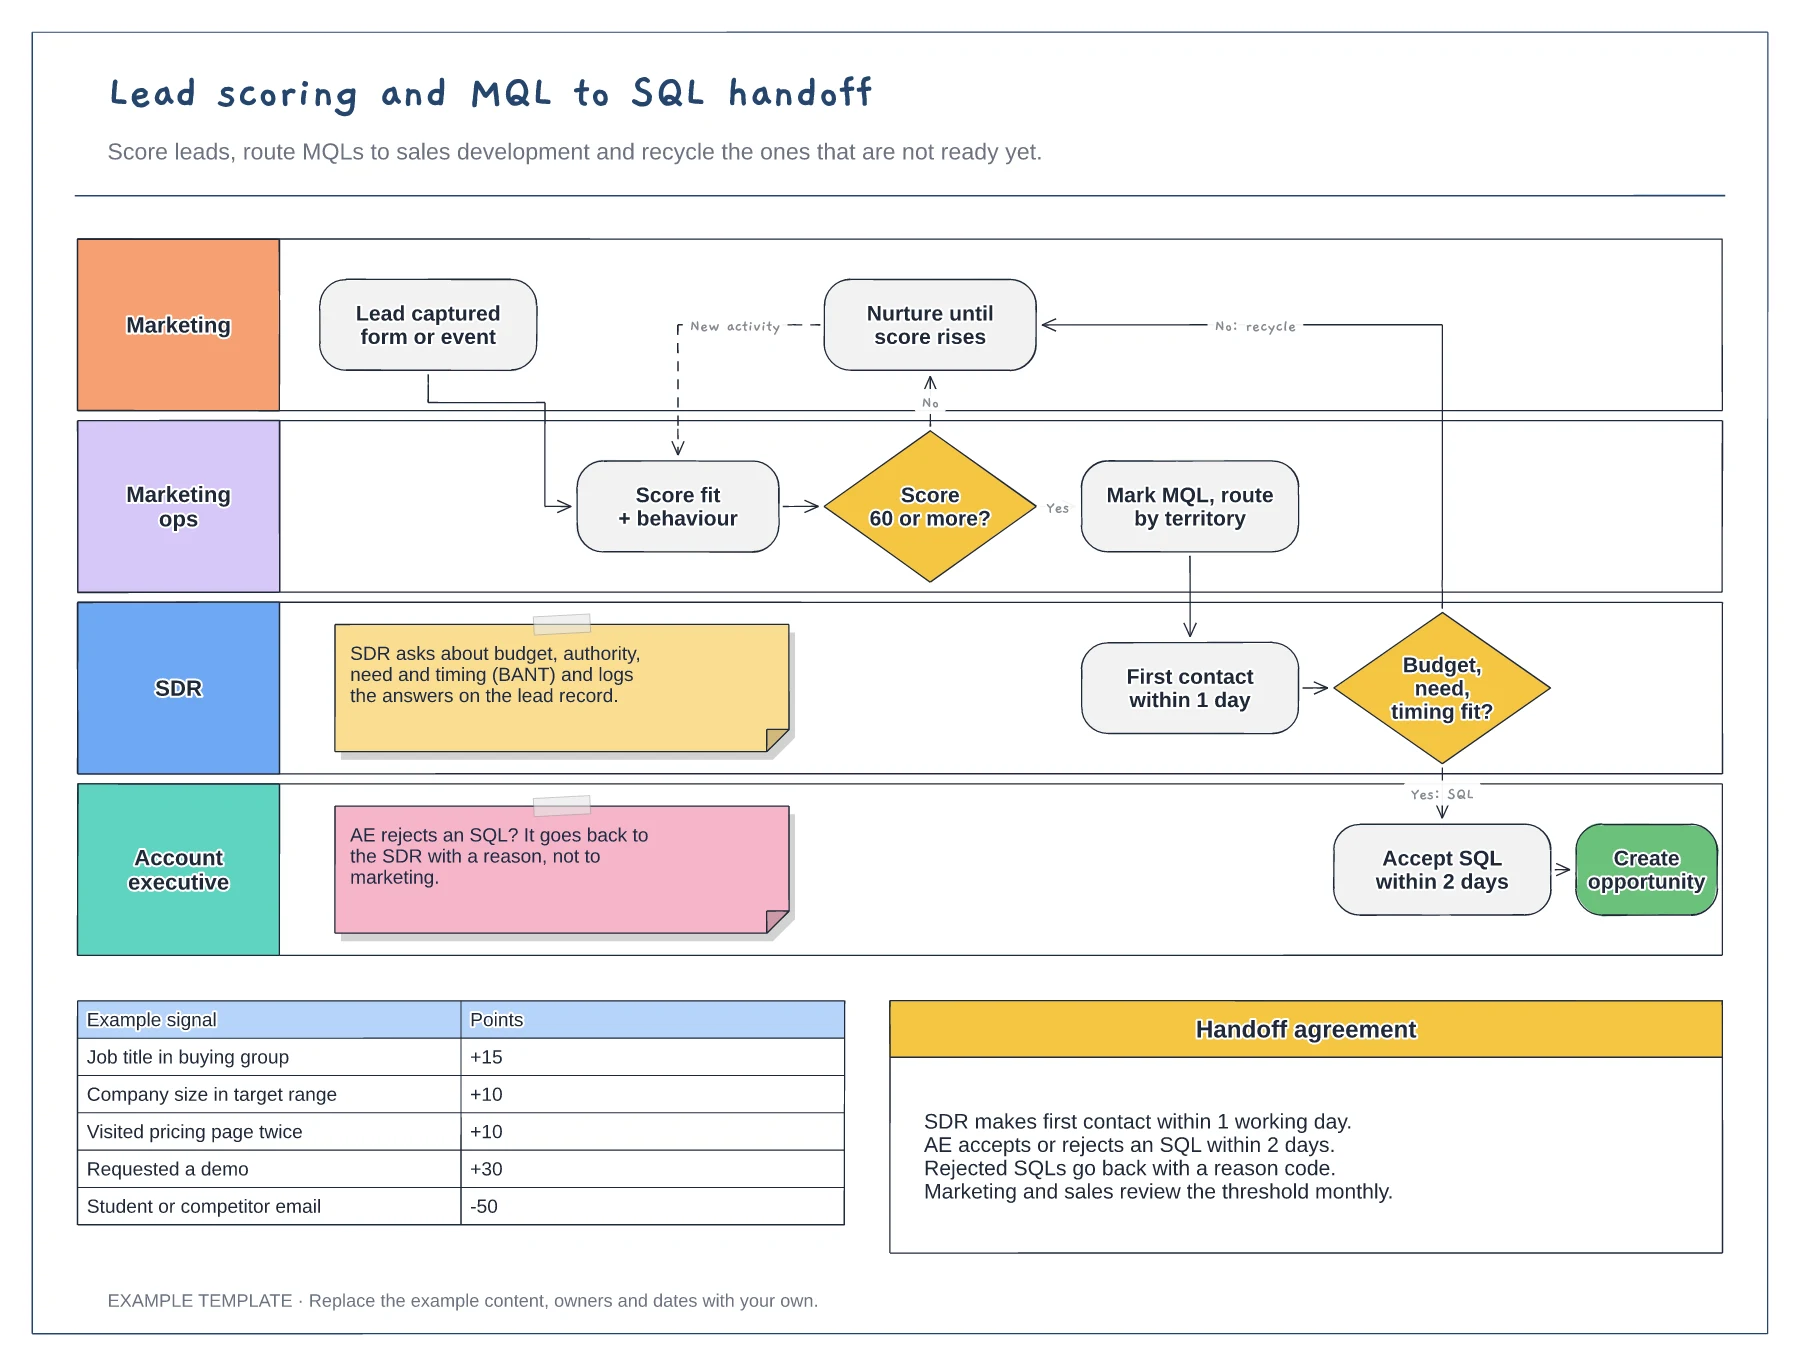
Swimlanes for marketing, marketing ops, SDR and AE · Example scoring model with points · Service-level agreement between the teams
Preview and use template →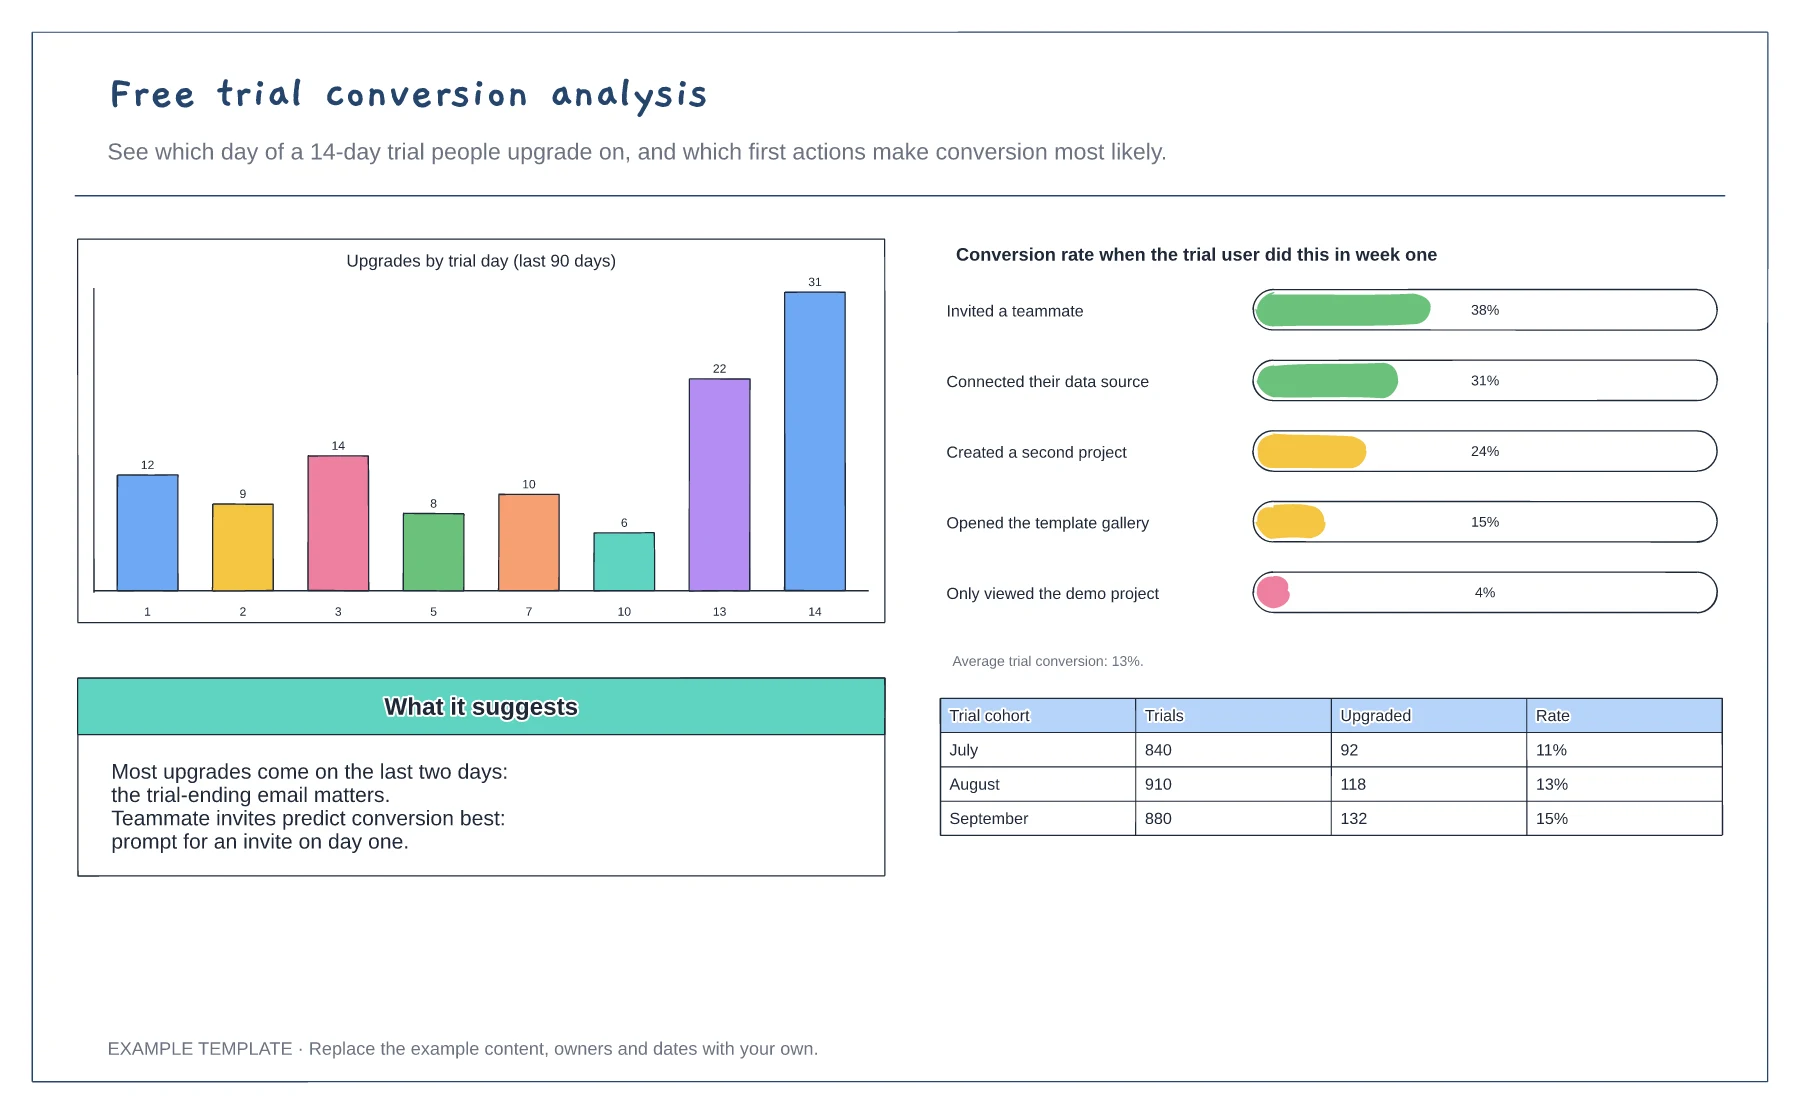
Upgrades by trial day · Conversion by first-week action · Monthly cohort table
Preview and use template →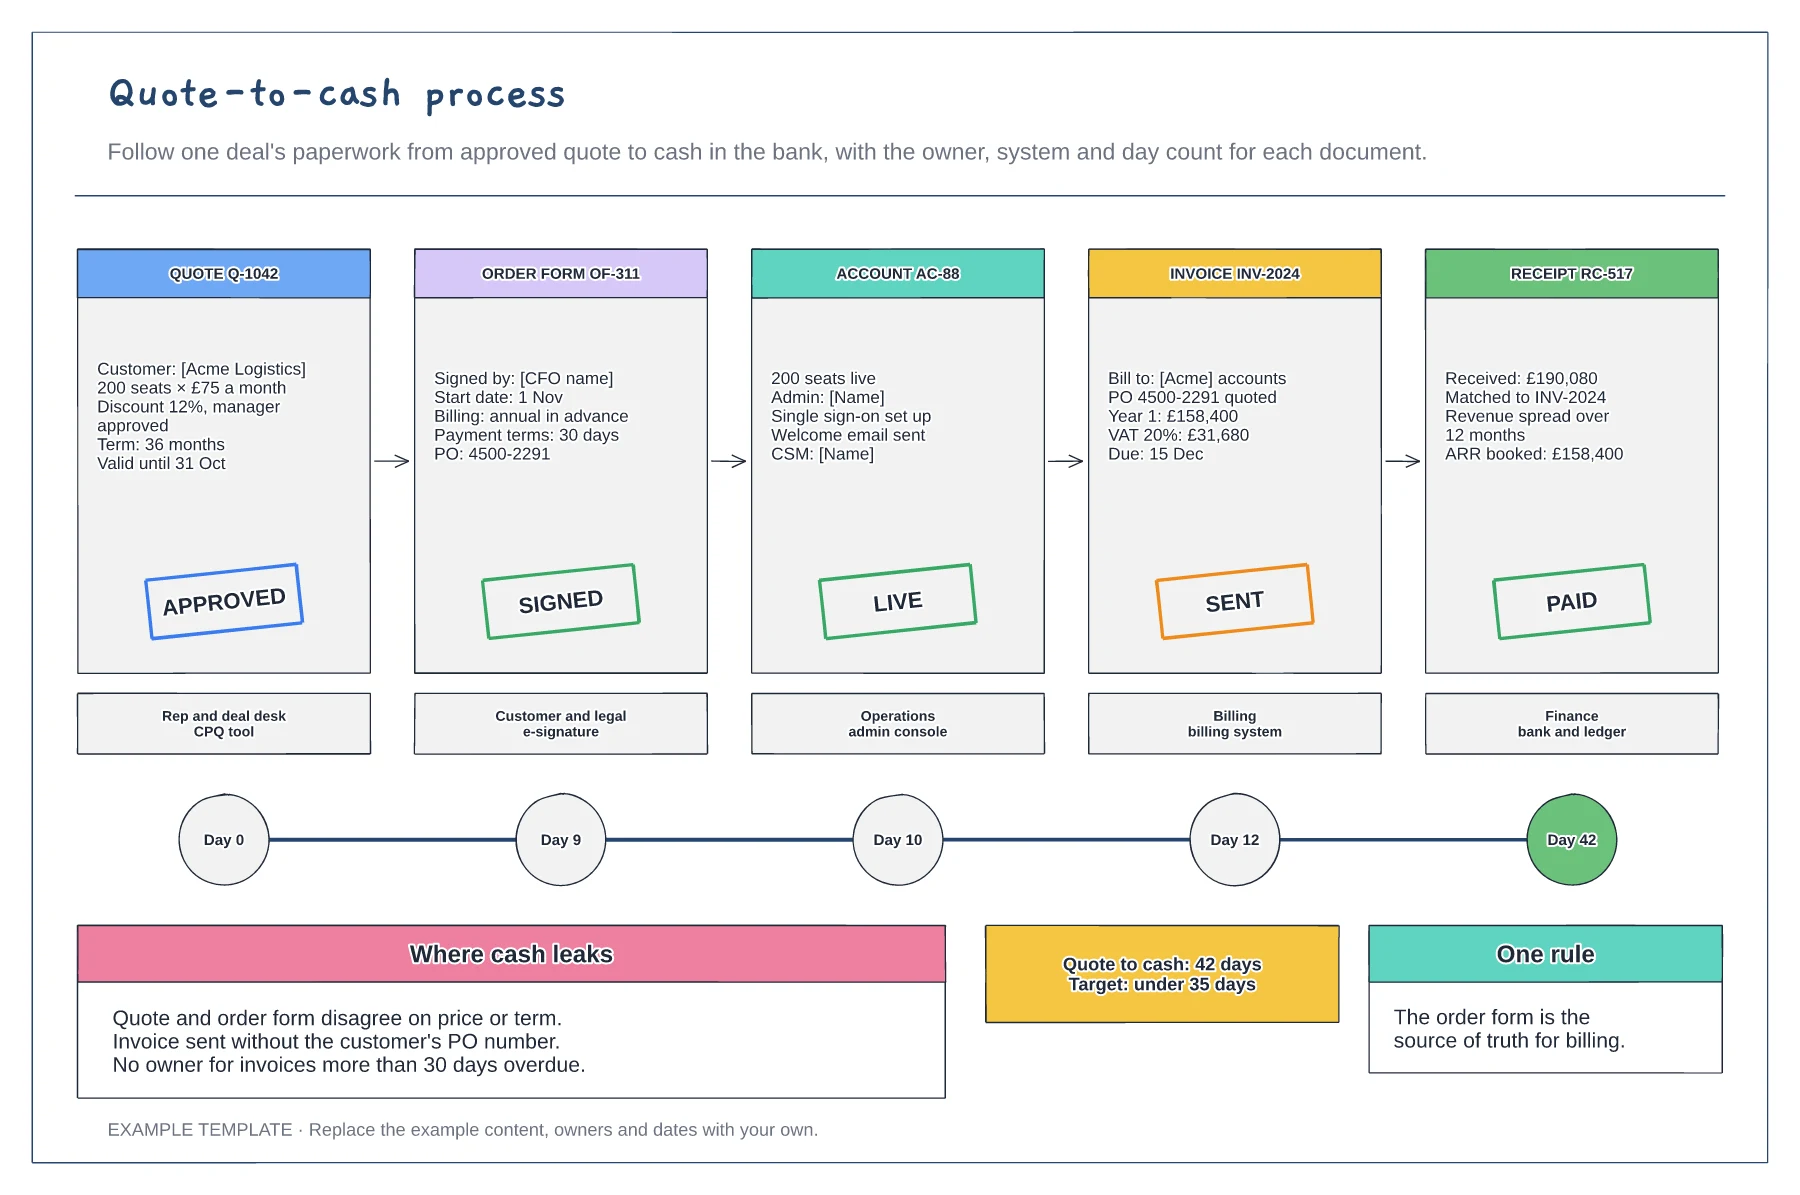
Five documents with their stamps · Owner and system for each step · Days from quote to cash and common leaks
Preview and use template →