Manufacturing
SMED changeover analysis template
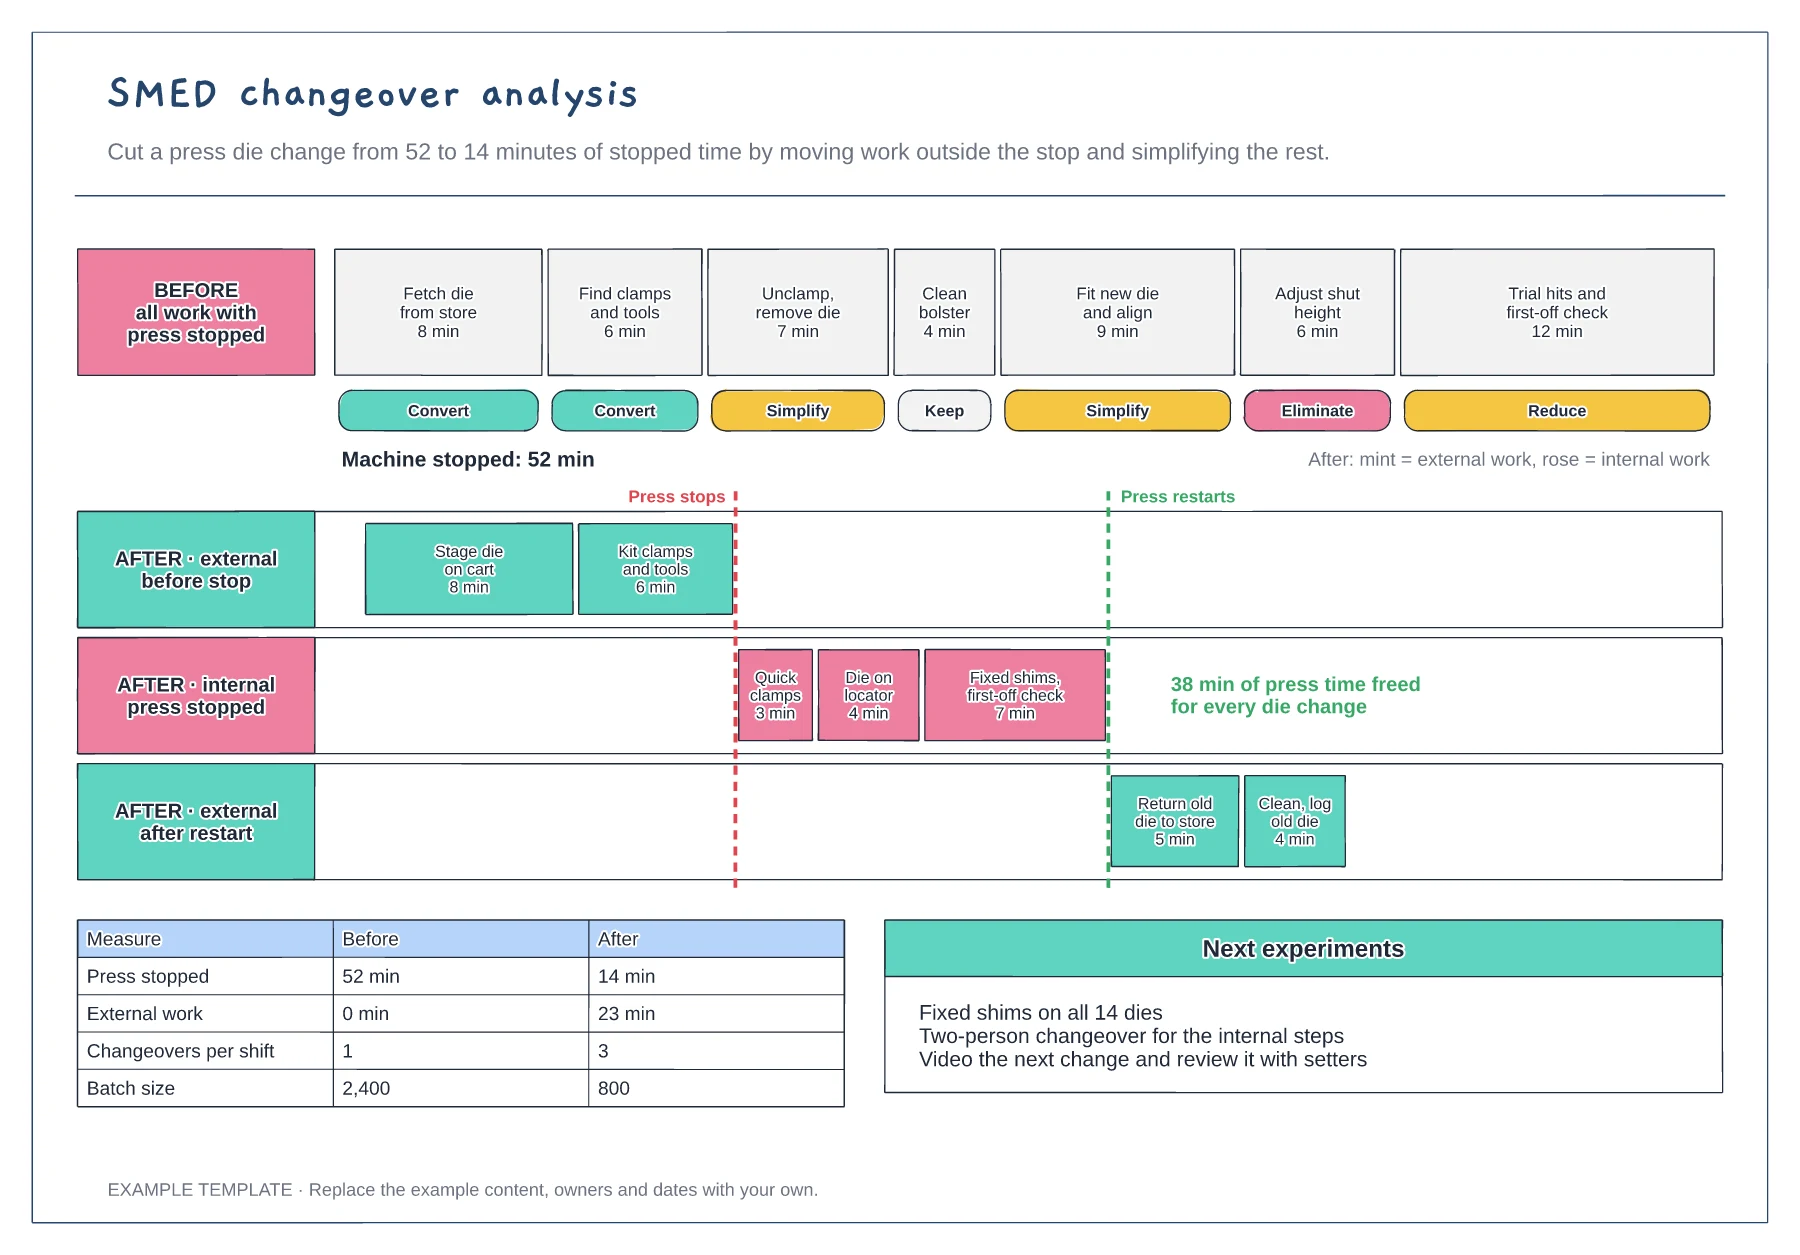
Before timeline with each step timed · After swimlanes for internal and external work · Before and after results table
Preview and use template →A production schedule gantt chart shows which work order runs on which line, when, and what has to happen around it. This example plans two weeks across a press, moulding and weld cell, with changeovers and planned maintenance as their own bars, milestones for steel arrival and shipment, and a capacity check that shows the weld cell as the constraint.
No account needed · Opens as your own editable page
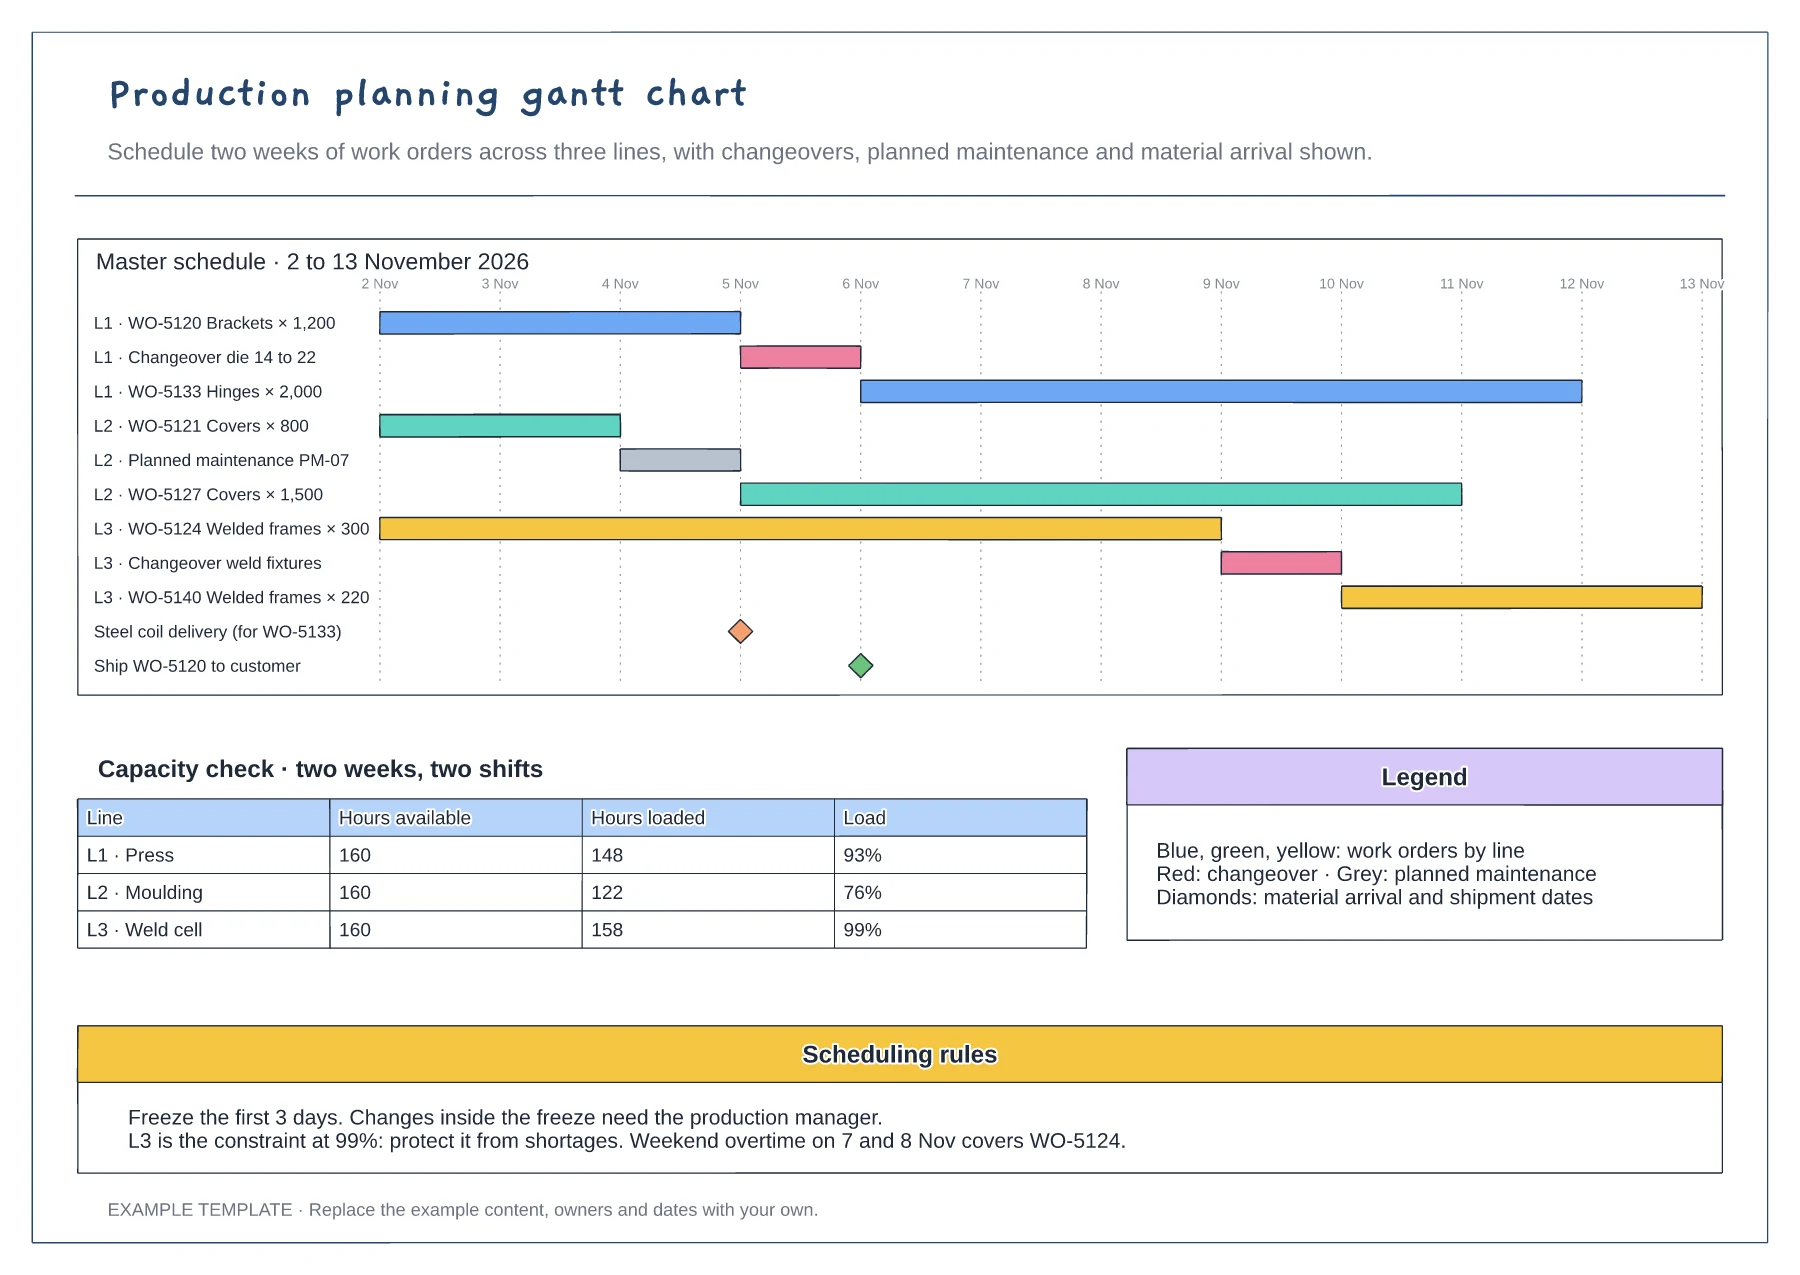
Replace the rows with your work orders, prefixed by the line or machine. Grouping by line makes clashes and idle gaps obvious at a glance.
Give changeovers and planned maintenance their own bars on each line. A schedule that leaves them out looks achievable on paper and falls behind on the first day.
Total the hours loaded on each line against hours available. Protect the most heavily loaded line from shortages, because time lost there is lost for the whole plant.
Extend its bar on the gantt, push back the bars after it on that line and check the capacity table still shows enough hours.
No. Open the template and edit it in your browser. Your work saves on this device. An account is optional if you want to sync your workspace.
Yes. Use Export in the editor to save a PNG, SVG or PDF, or download an editable .epicdraw backup.
Before timeline with each step timed · After swimlanes for internal and external work · Before and after results table
Preview and use template →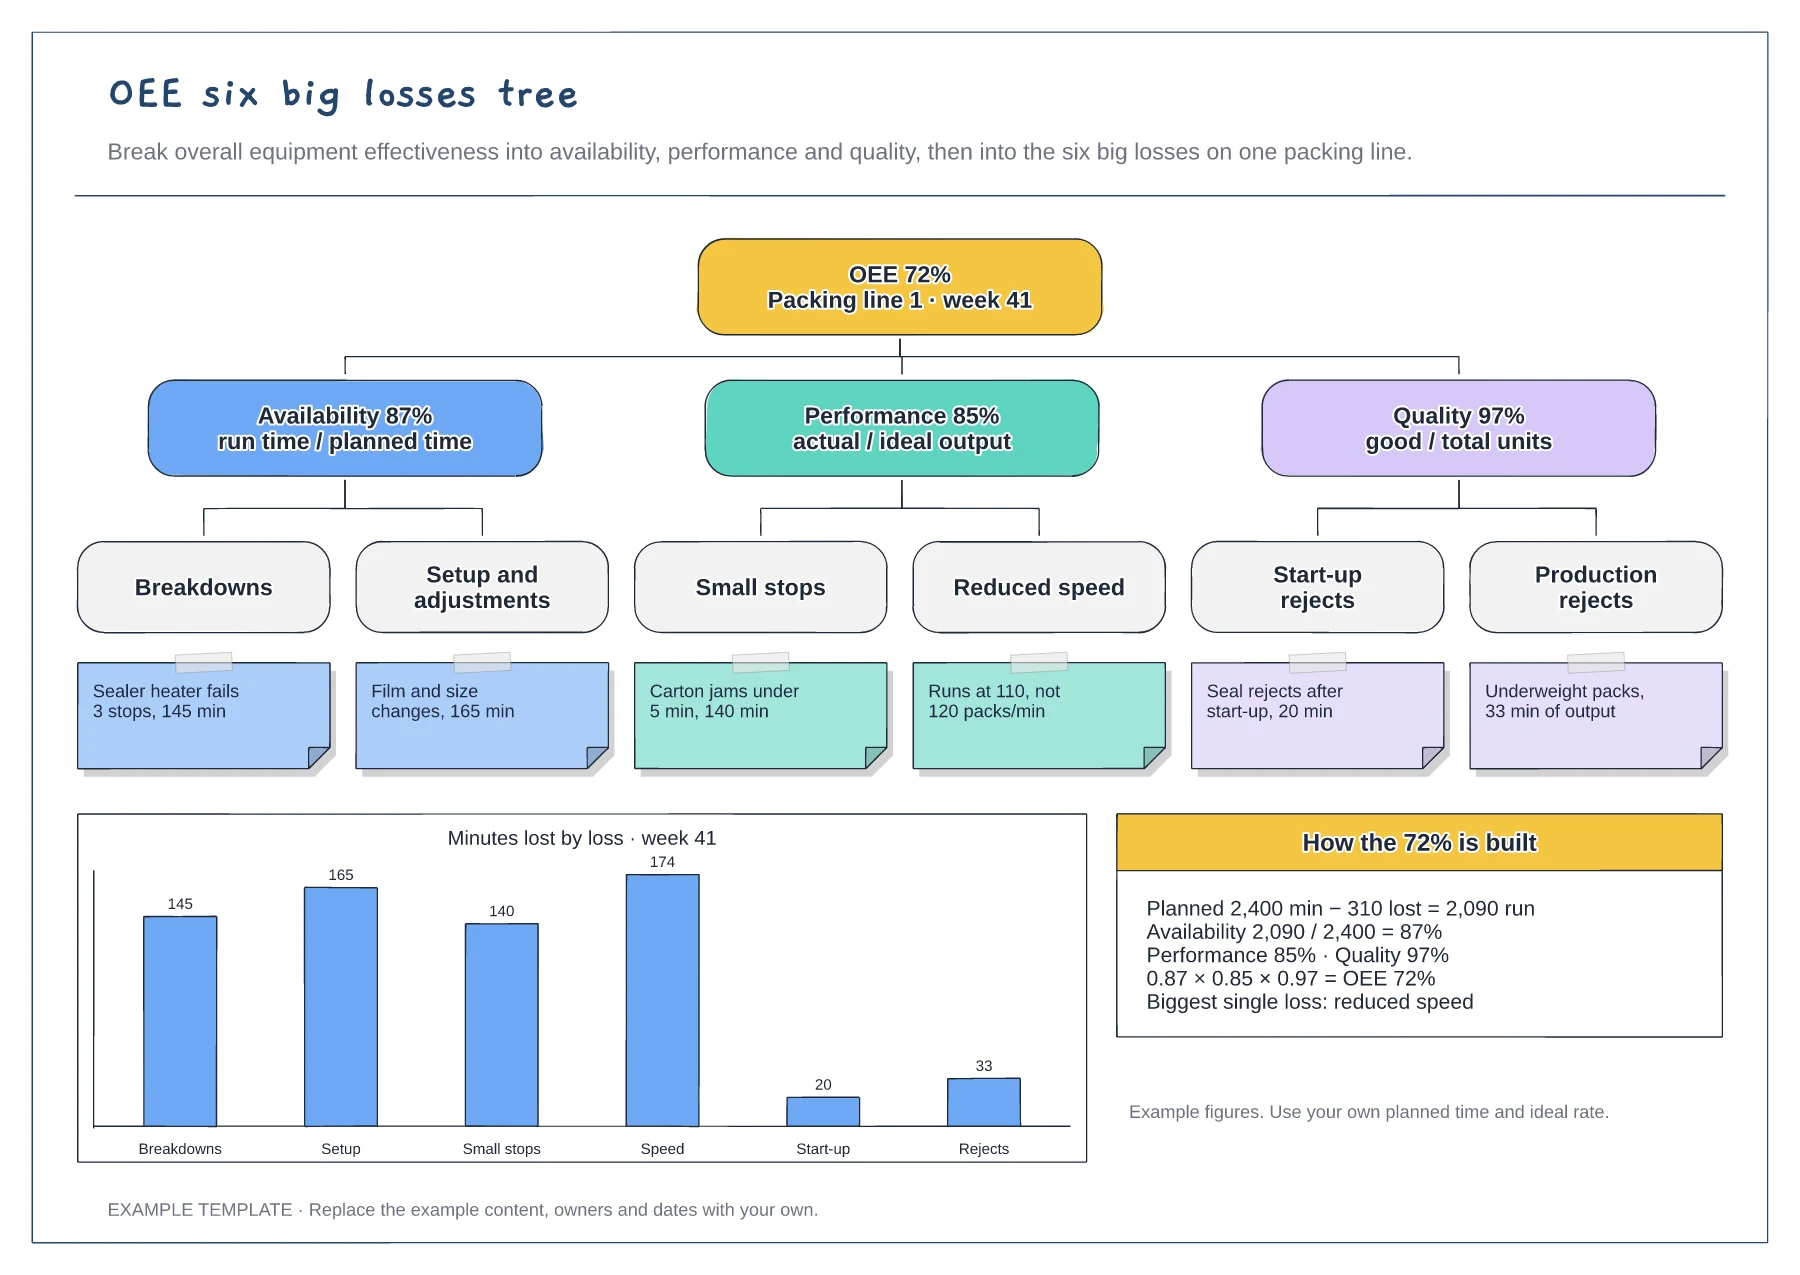
Tree from OEE to the six big losses · Example cause under each loss · Minutes-lost chart and the OEE calculation
Preview and use template →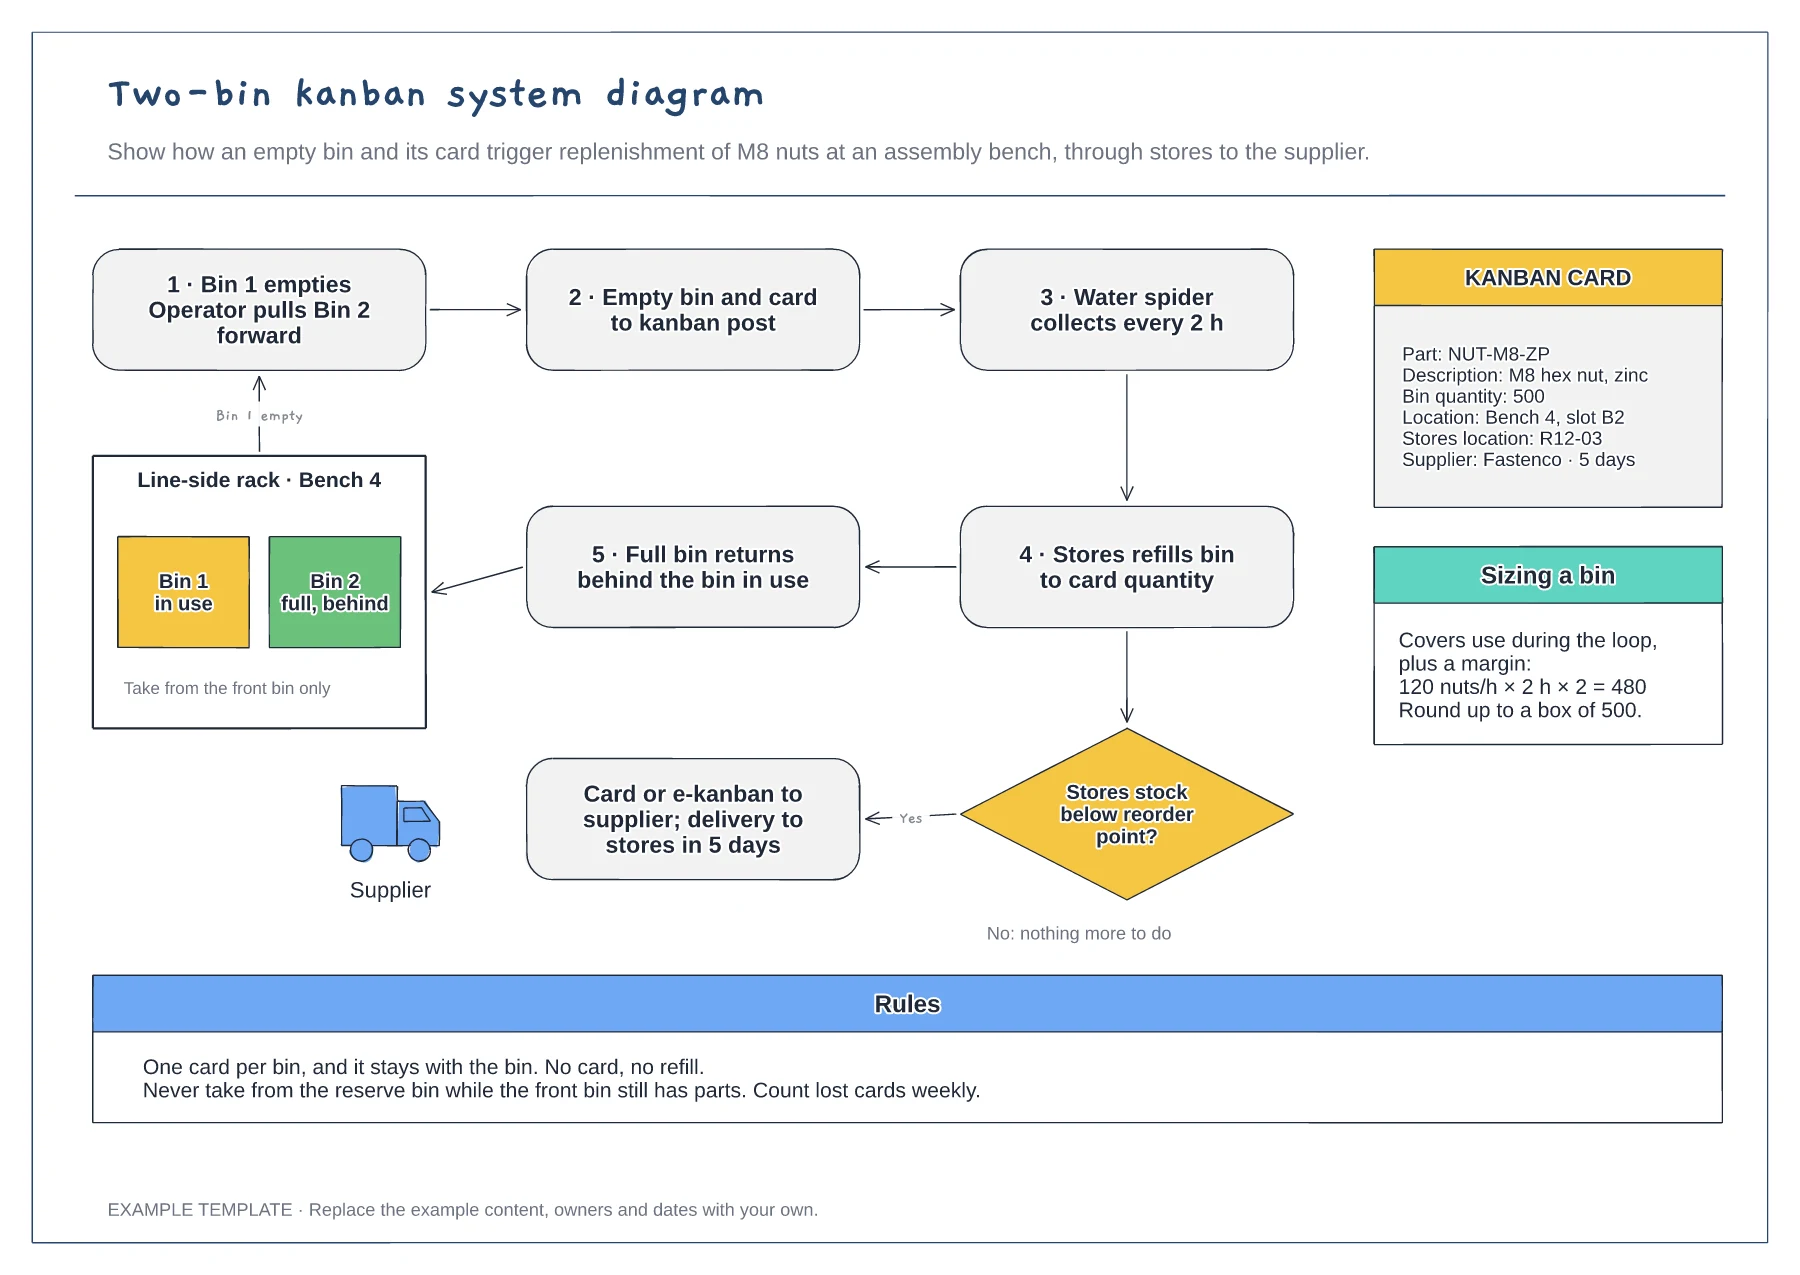
Replenishment loop from bench to stores · Reorder decision and supplier trigger · Kanban card fields and bin sizing
Preview and use template →
Discovery and URL mapping · Build, QA and launch gates · Post-launch monitoring and ownership
Preview and use template →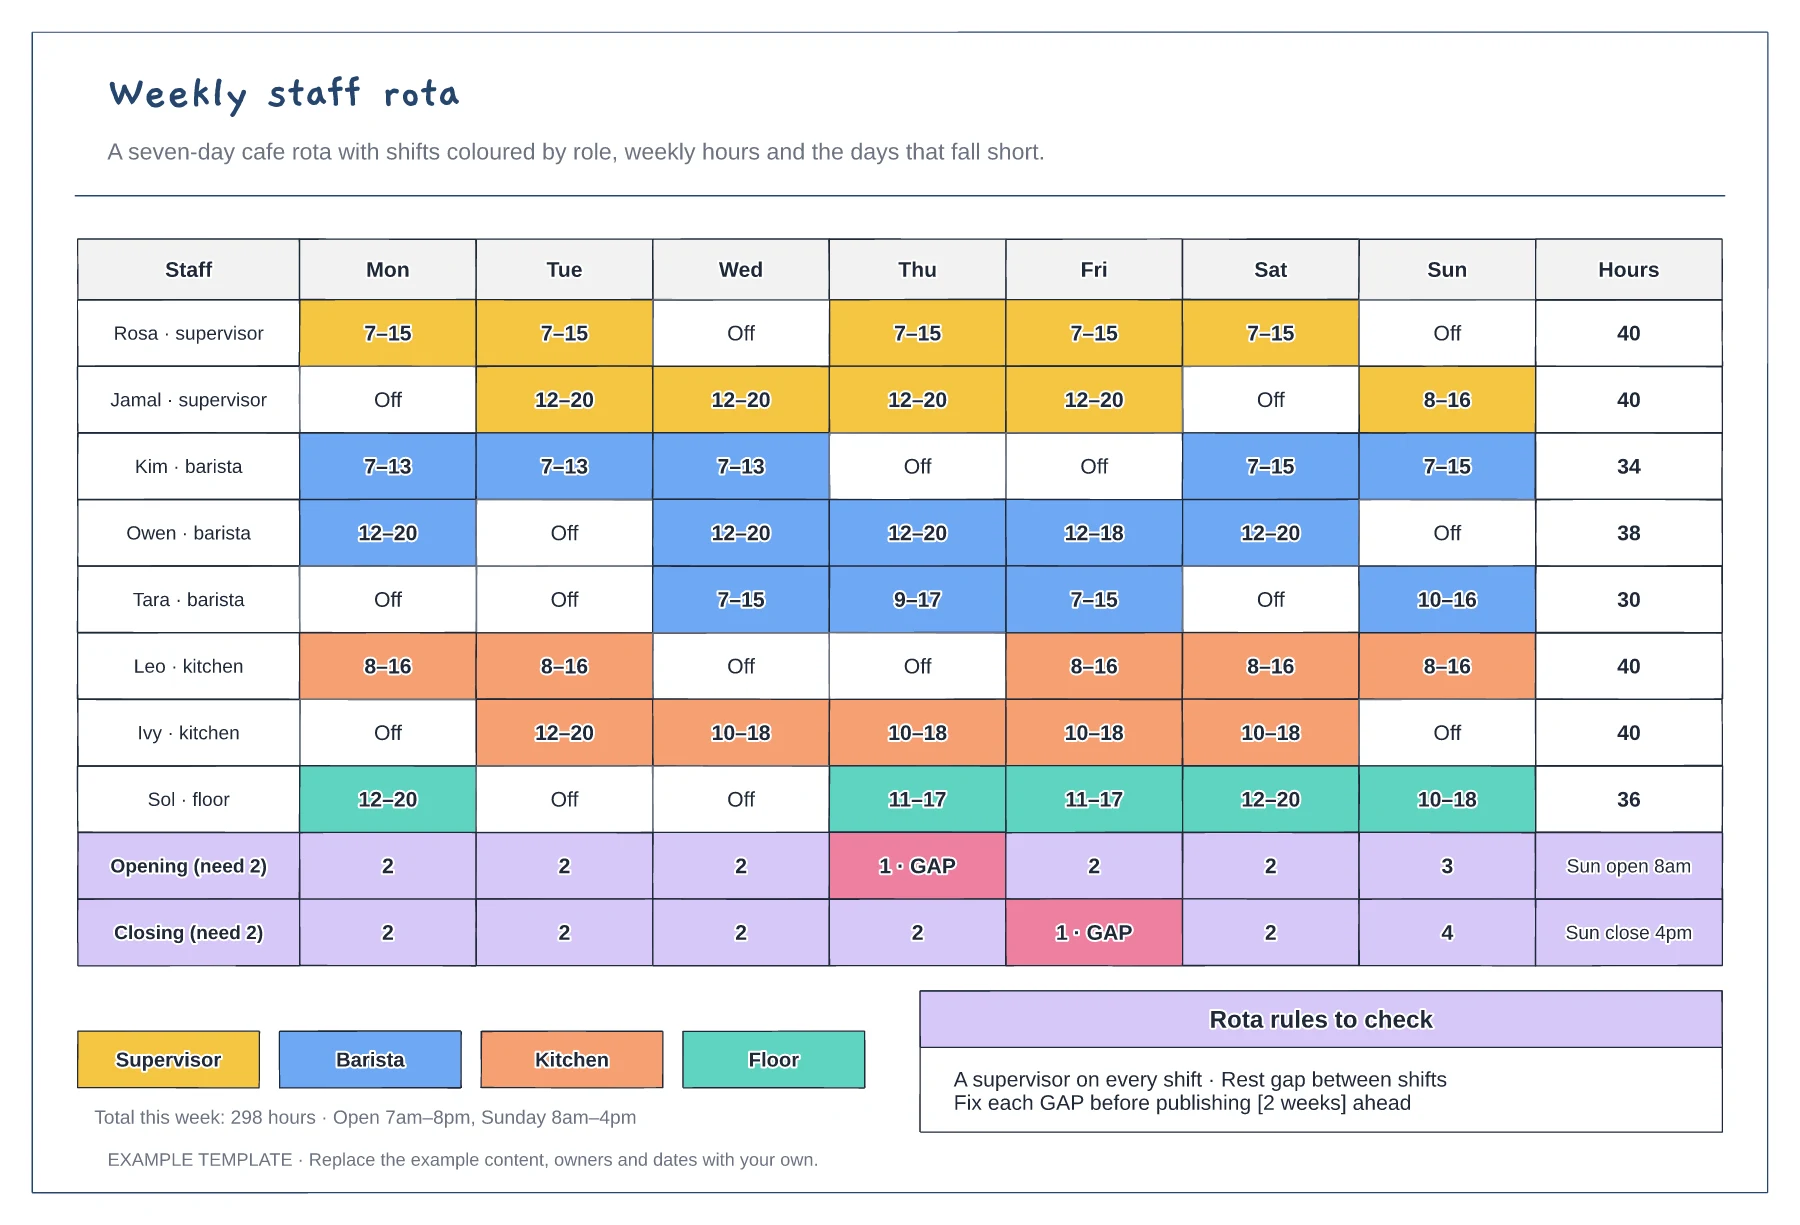
Mon to Sun shifts coloured by role · Weekly hours per person · Opening and closing cover with gaps flagged
Preview and use template →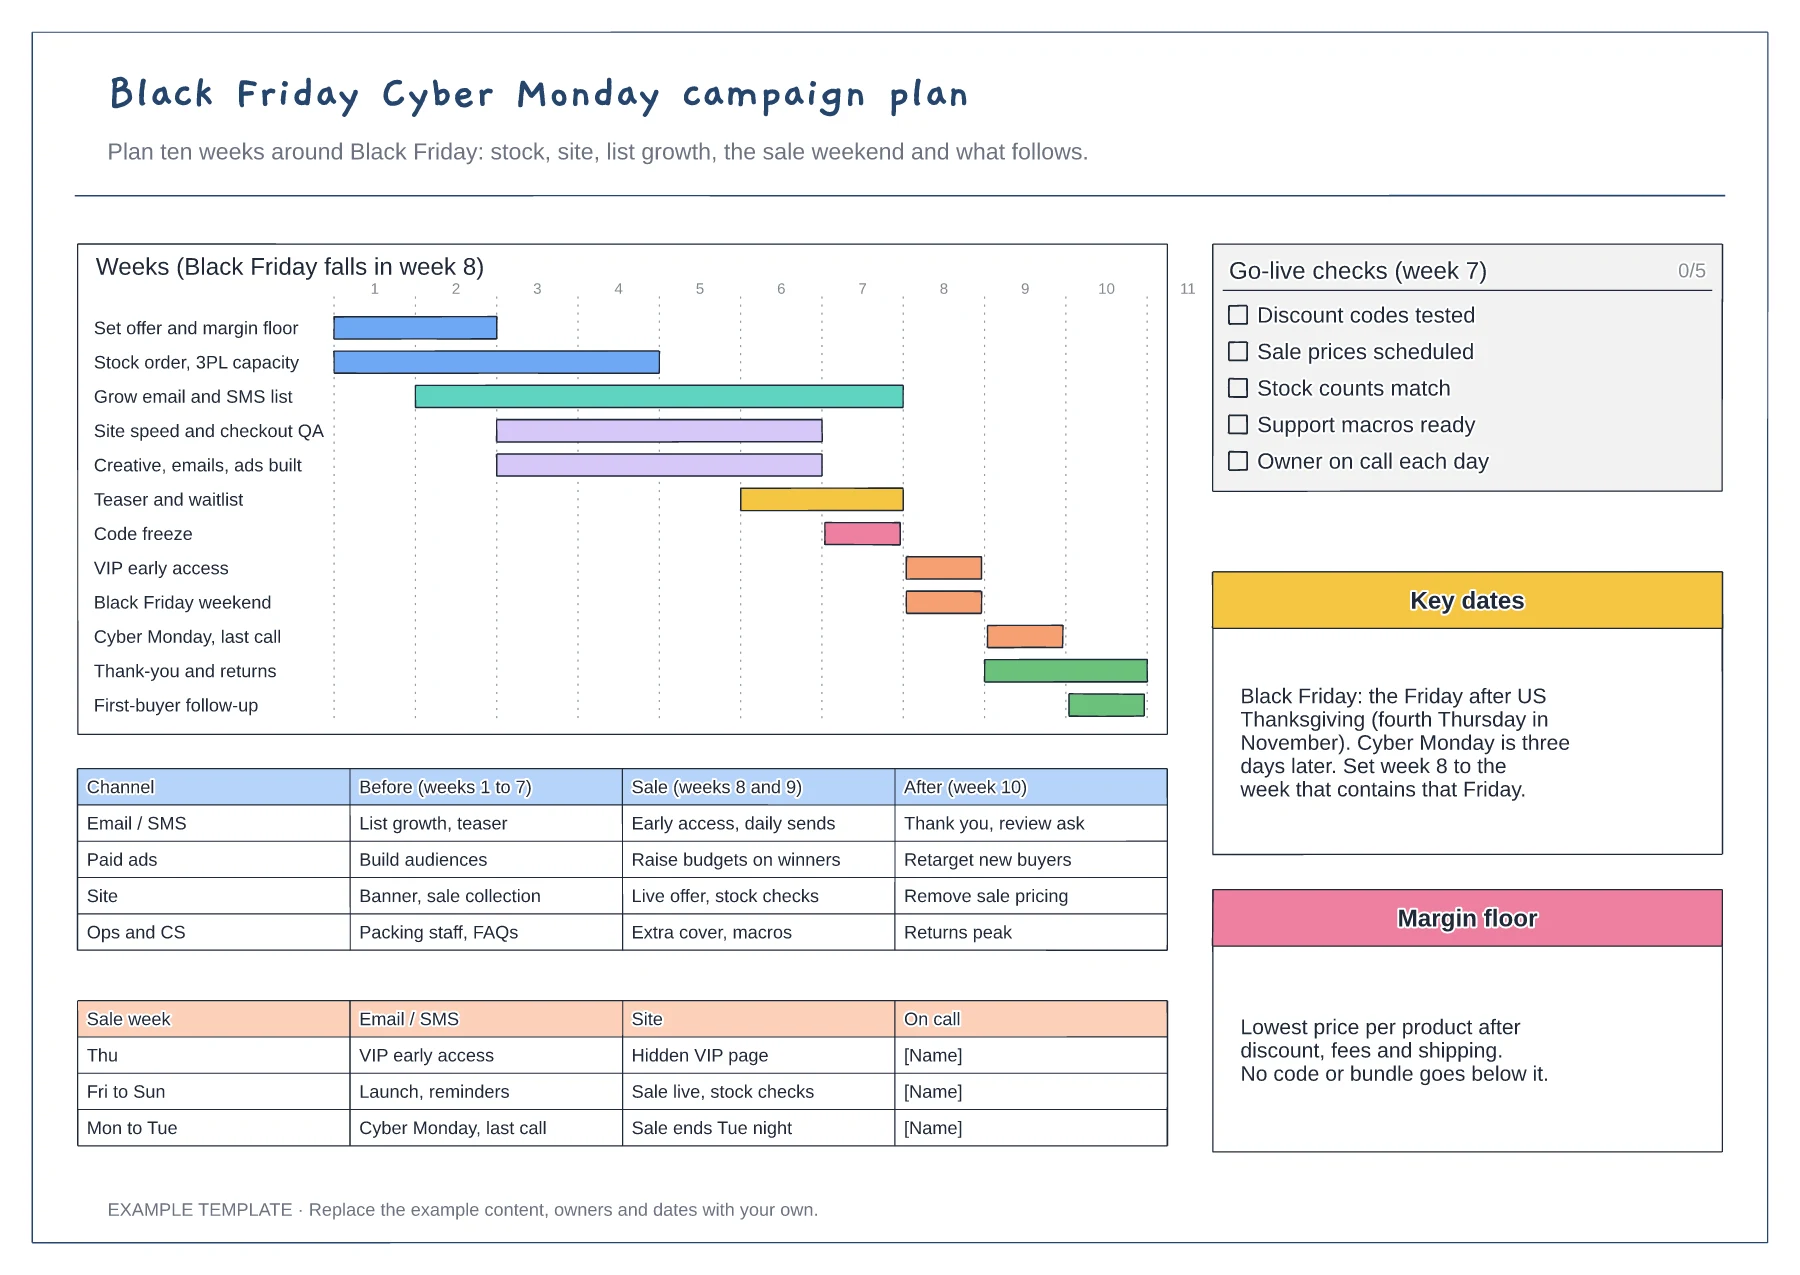
Ten-week gantt by workstream · Channel plan before, during and after · Go-live checks and sale-week rota
Preview and use template →