Manufacturing
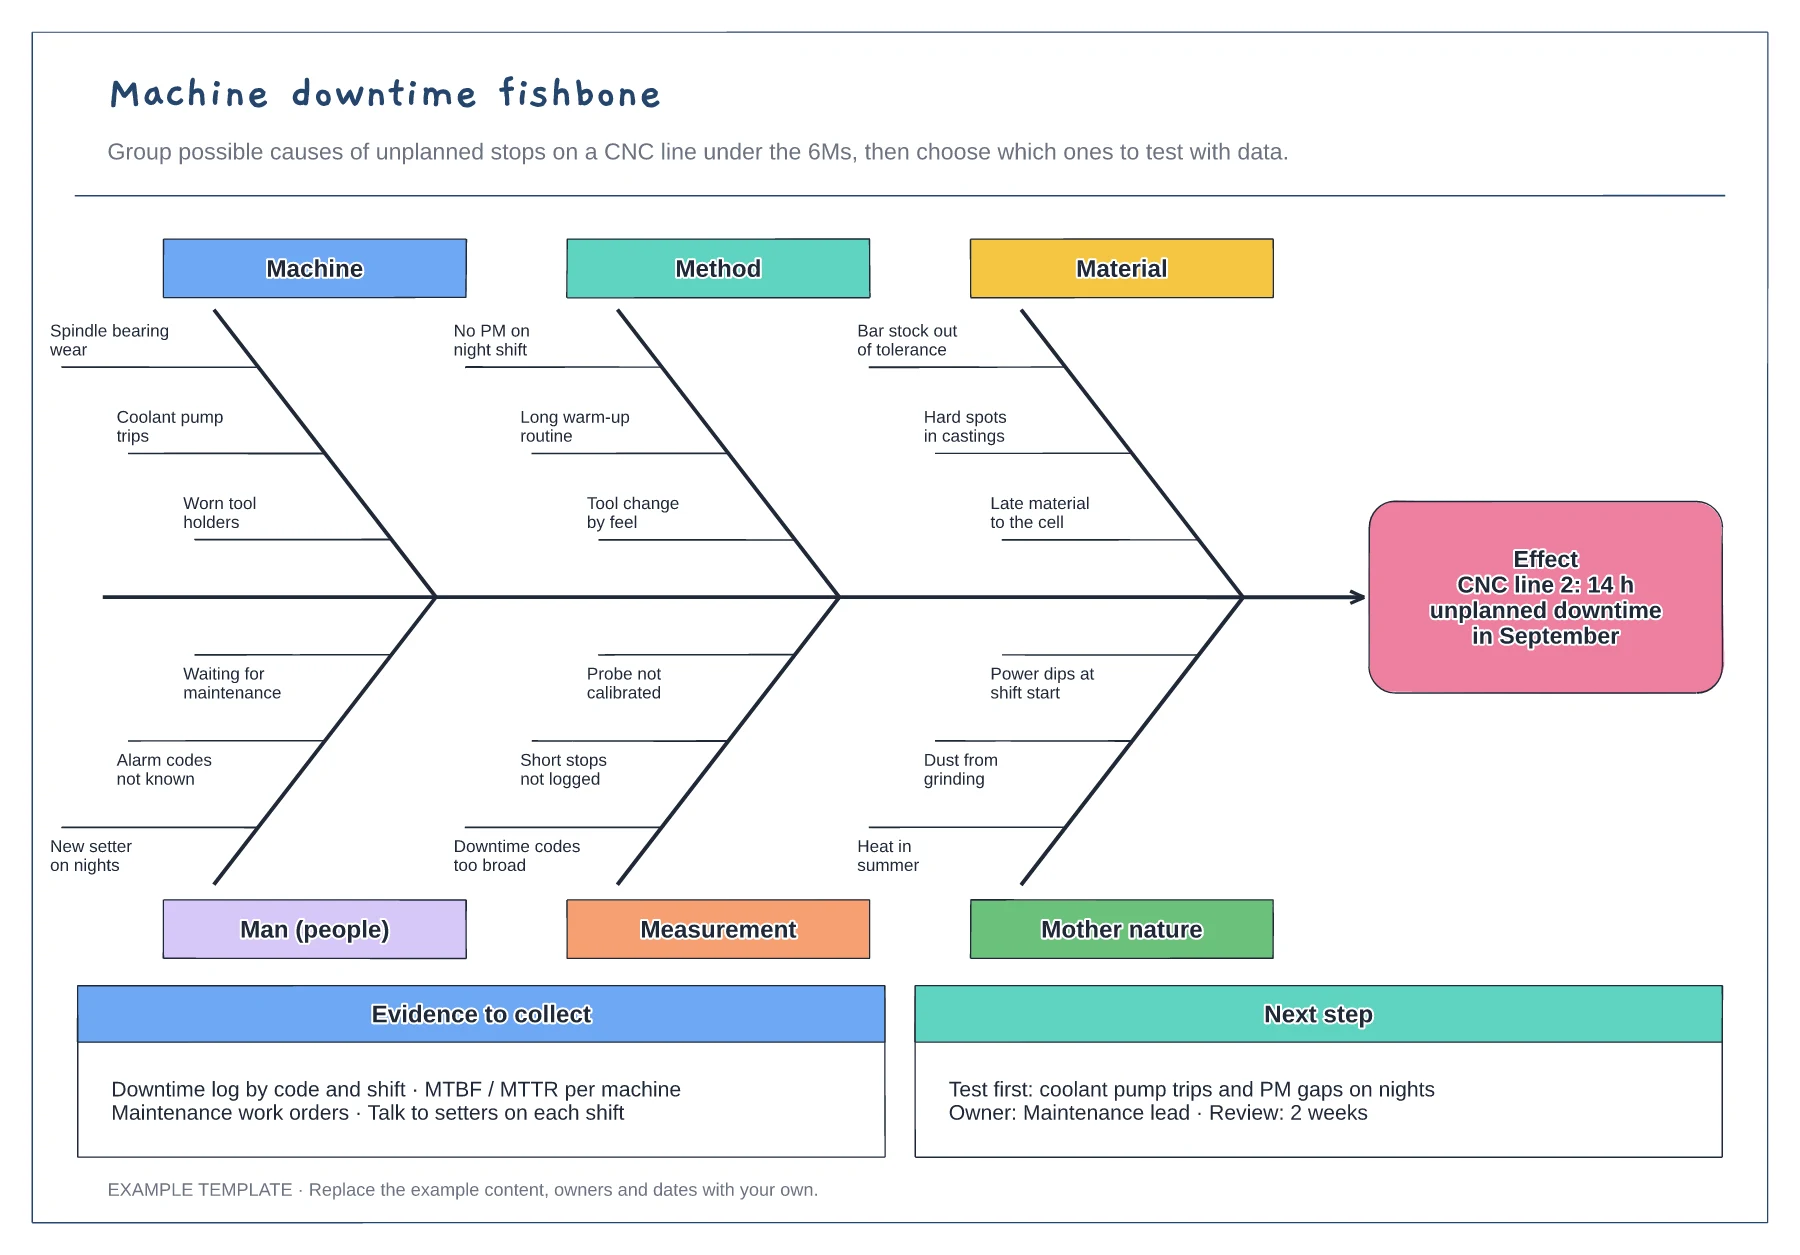
Machine downtime fishbone diagram template
6M fishbone with three causes per bone · Downtime effect stated with hours lost · Evidence list and next test with an owner
Preview and use template →Overall equipment effectiveness (OEE) shows how much of planned time produces good output, and the six big losses show where the rest goes. This example breaks a packing line's 72% OEE into availability, performance and quality, then into breakdowns, setups, small stops, reduced speed and two kinds of reject, each with a cause and the minutes lost.
No account needed · Opens as your own editable page
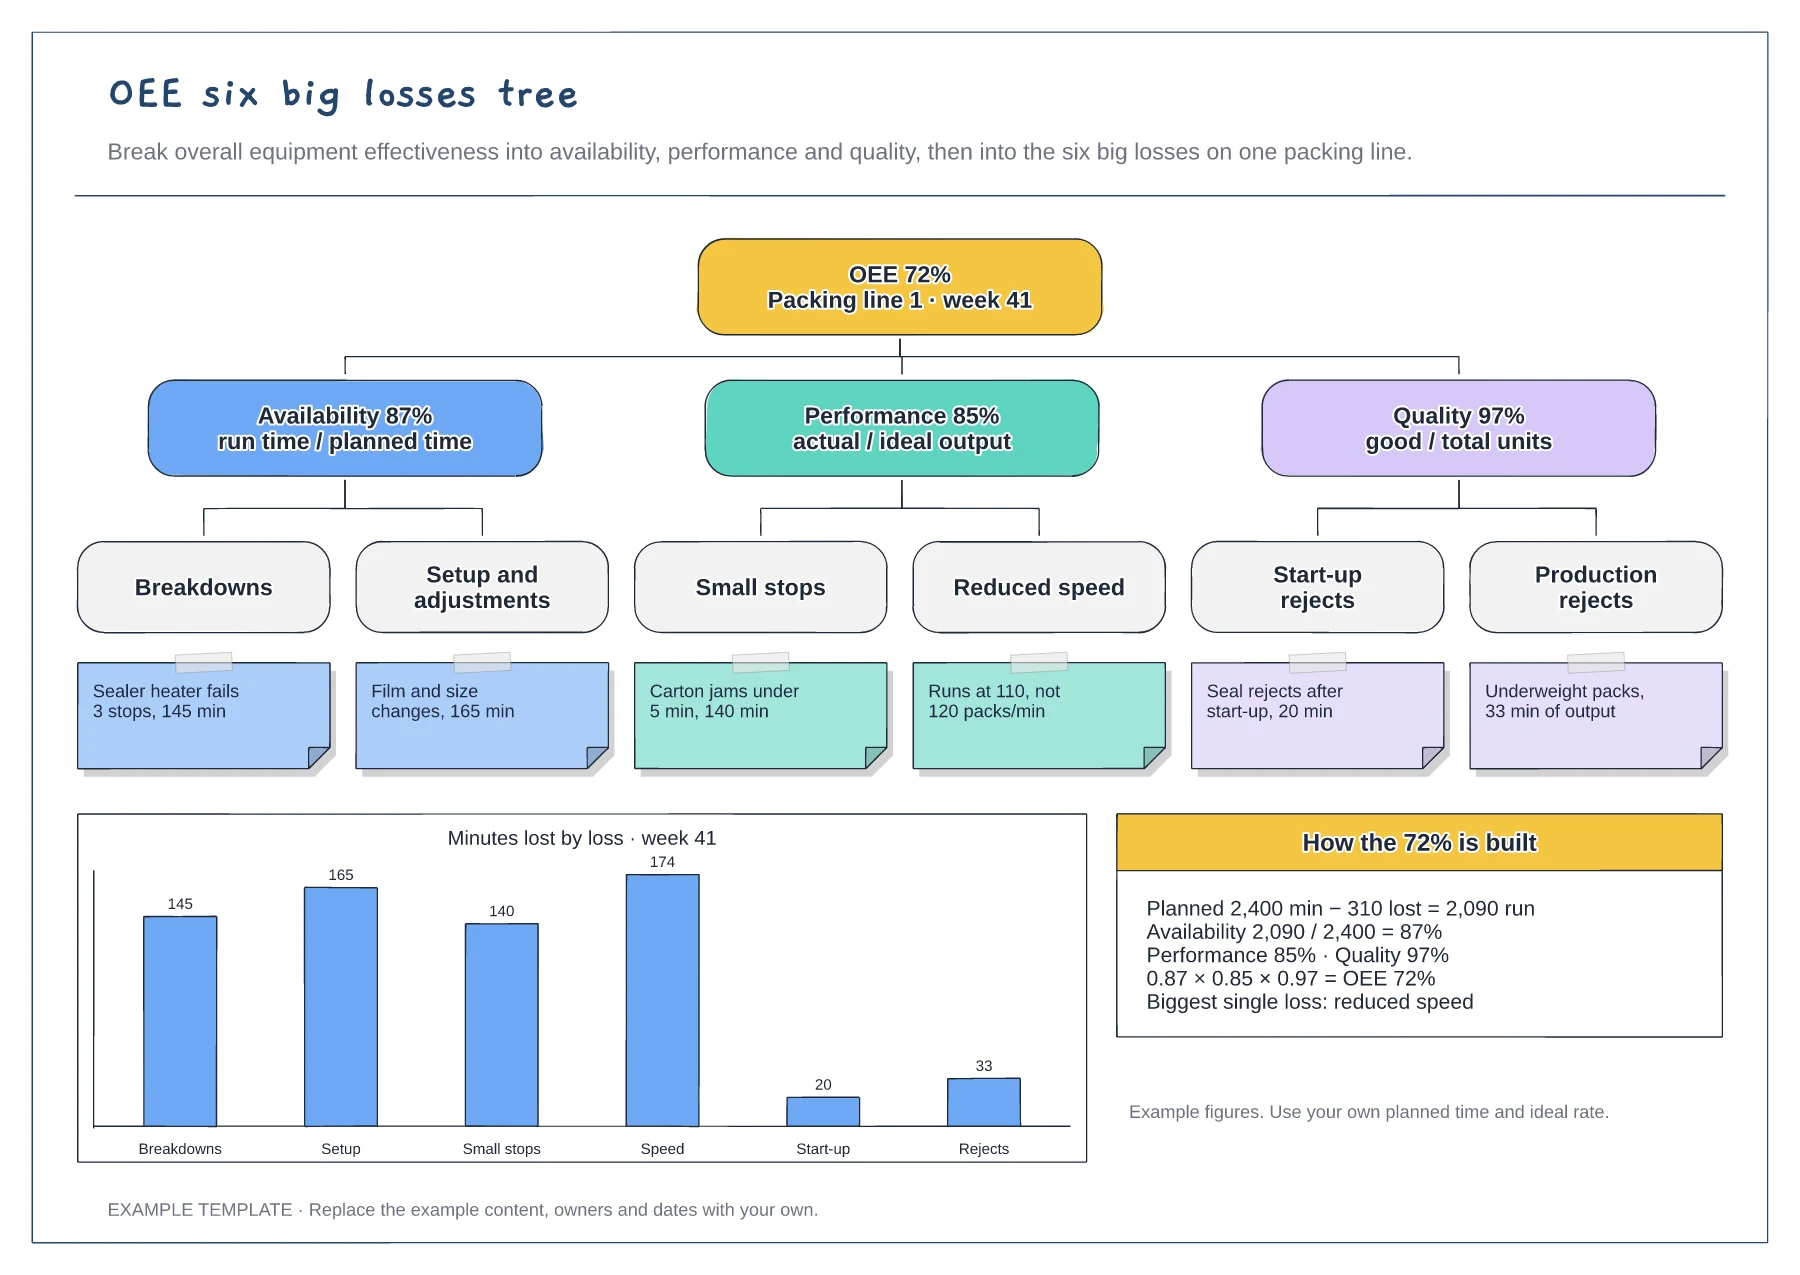
Replace the planned minutes and ideal packs per minute with your own. OEE is only comparable week to week if these two numbers stay fixed.
Convert each loss to minutes so they can be compared on one chart. Speed losses and small stops are often bigger than breakdowns but rarely logged.
Use the chart to choose which loss to work on, then hand it to a fishbone or SMED session. Improving a small loss moves OEE very little.
Yes. Edit the availability, performance and quality figures in the OEE calculation, then update the minutes lost for each of the six losses in the chart.
No. Open the template and edit it in your browser. Your work saves on this device. An account is optional if you want to sync your workspace.
Yes. Use Export in the editor to save a PNG, SVG or PDF, or download an editable .epicdraw backup.
6M fishbone with three causes per bone · Downtime effect stated with hours lost · Evidence list and next test with an owner
Preview and use template →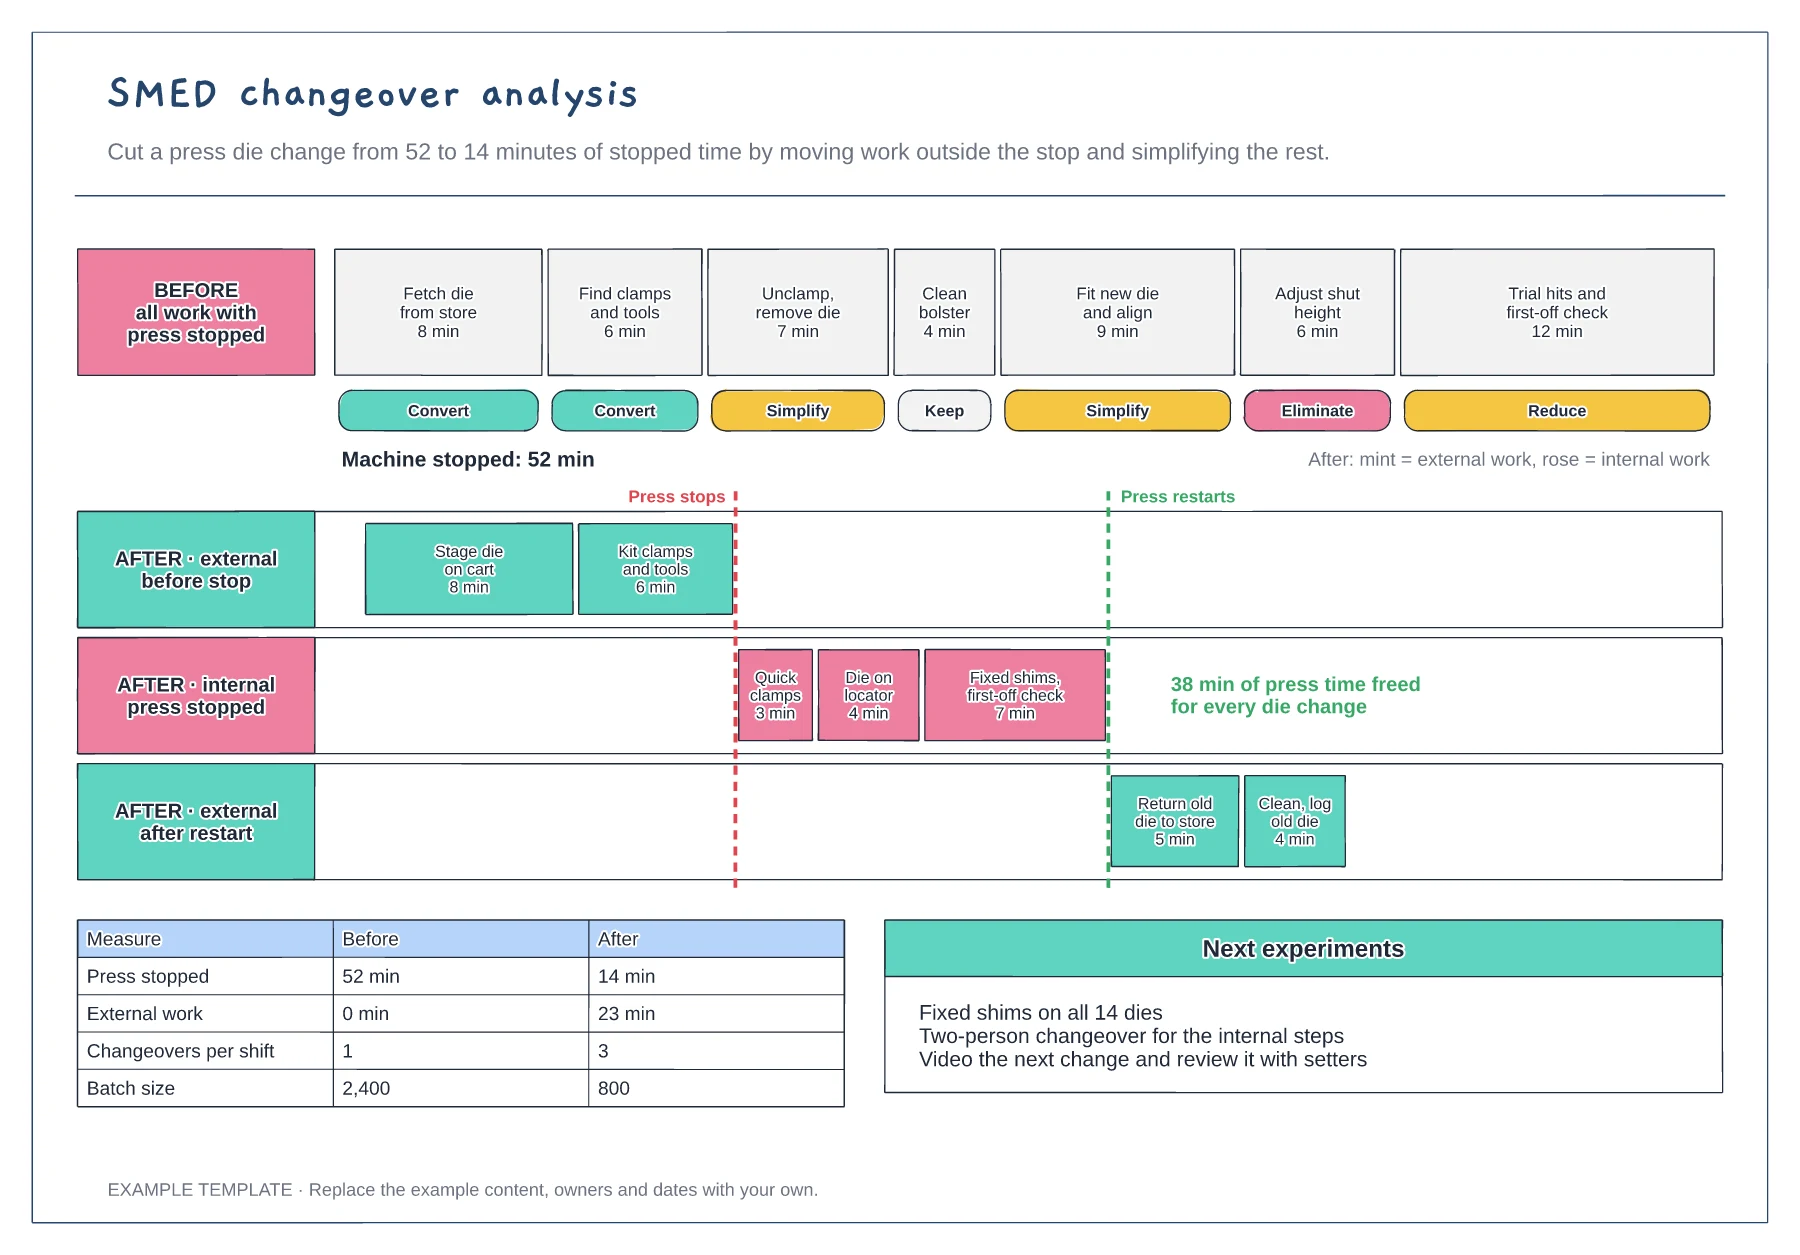
Before timeline with each step timed · After swimlanes for internal and external work · Before and after results table
Preview and use template →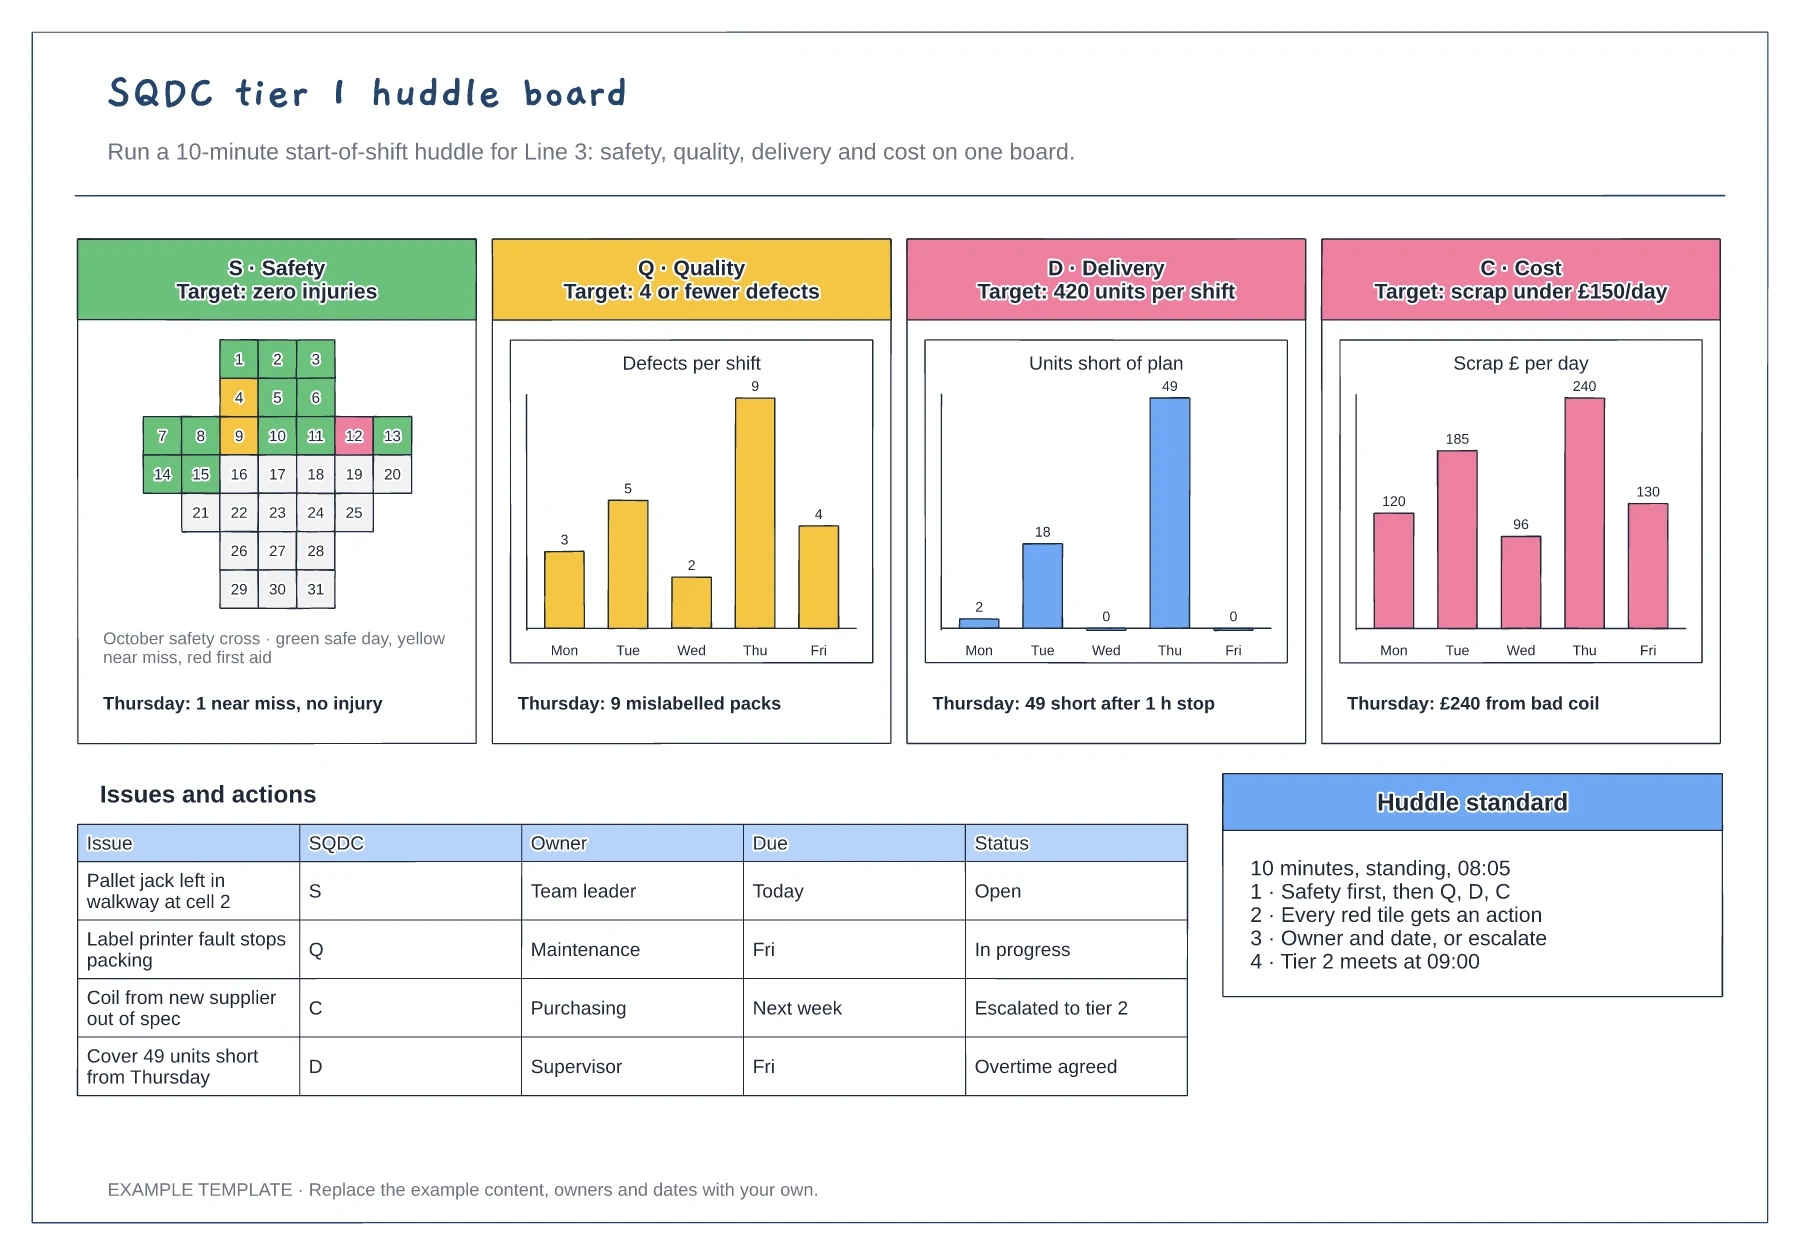
Safety cross for the month · Quality, delivery and cost charts by day · Issues and actions table with escalation
Preview and use template →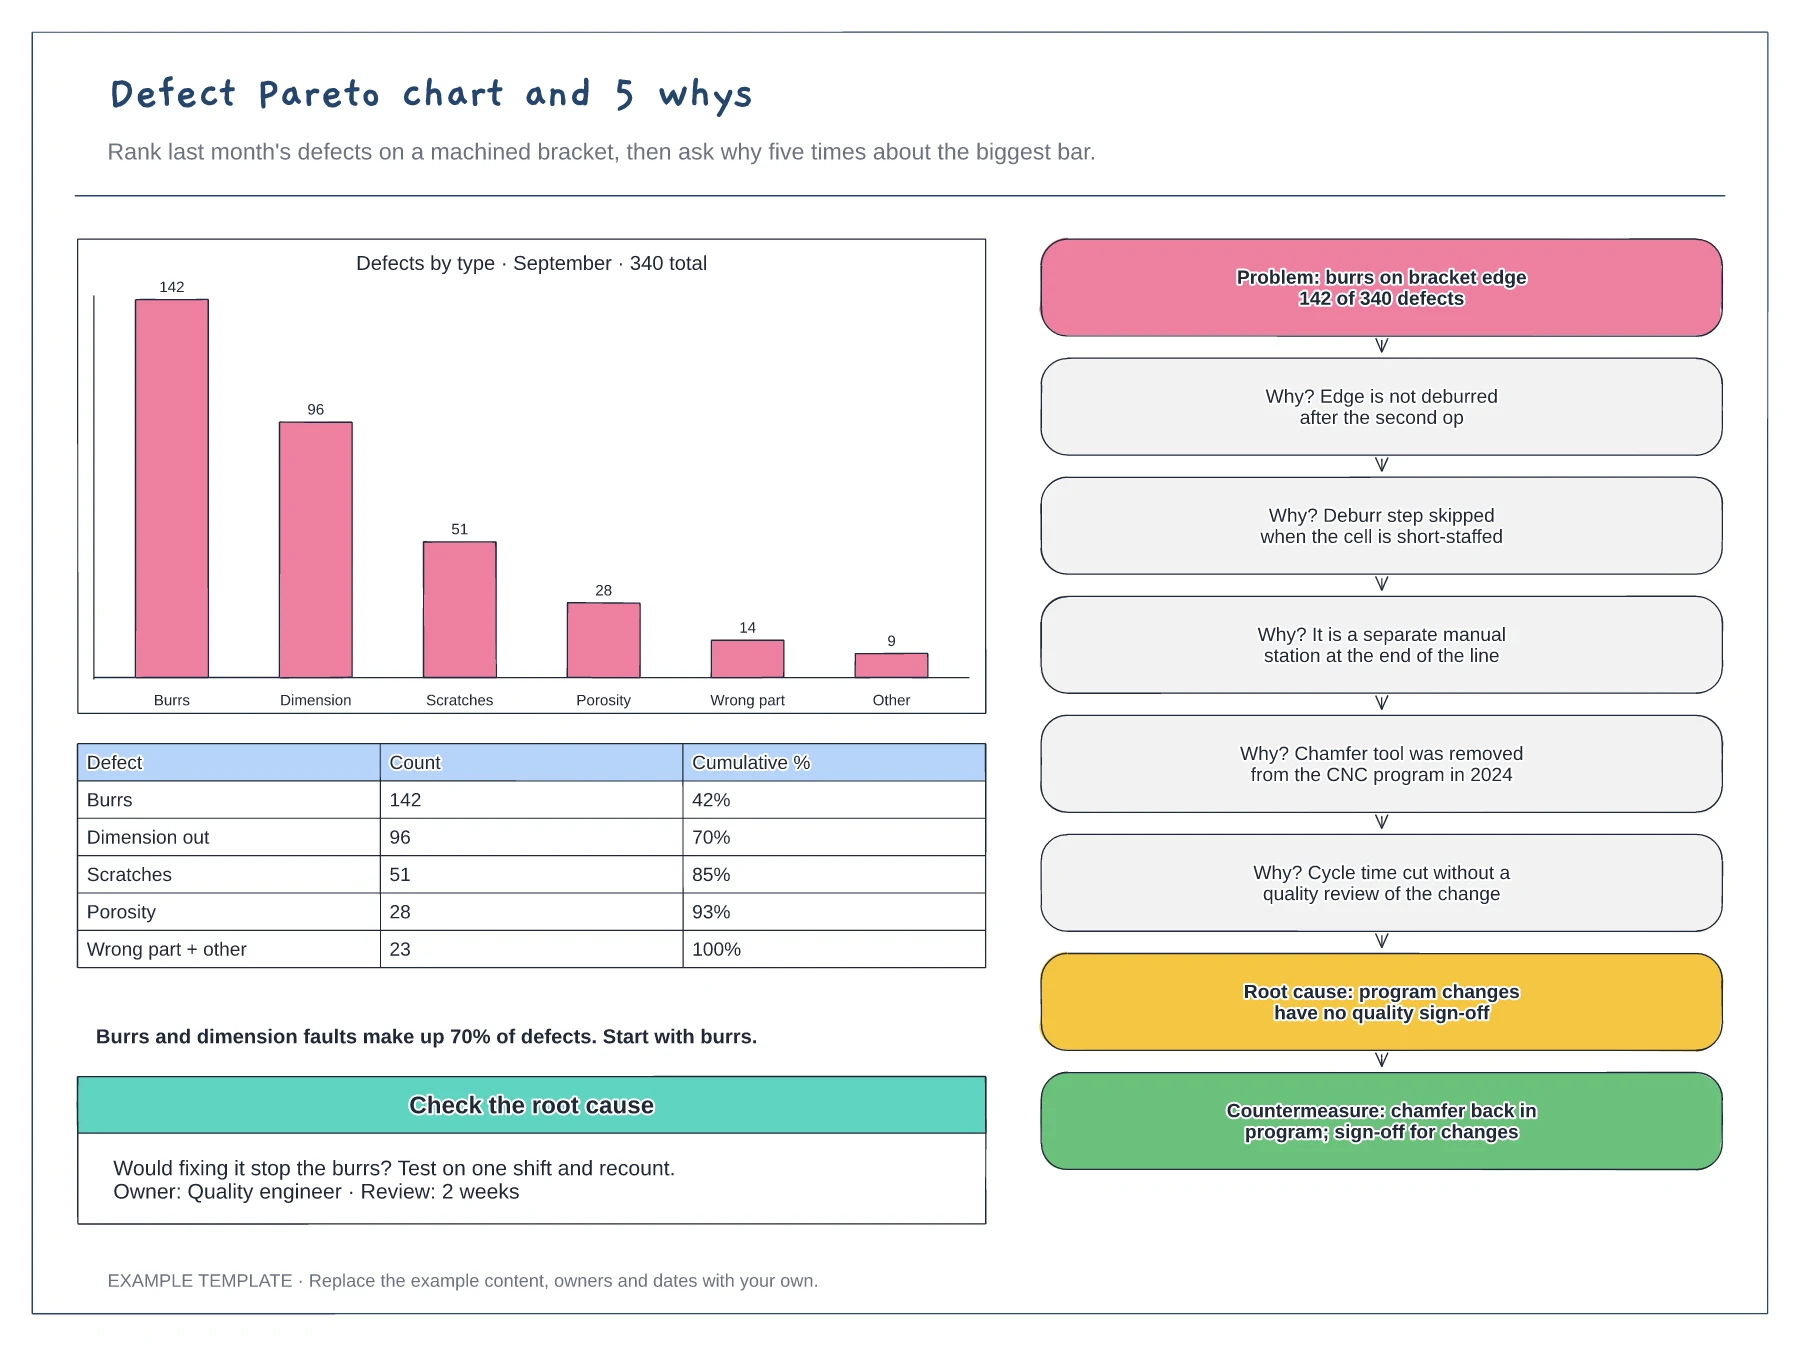
Pareto bar chart and cumulative table · 5 whys ladder from problem to root cause · Countermeasure and a check of the cause
Preview and use template →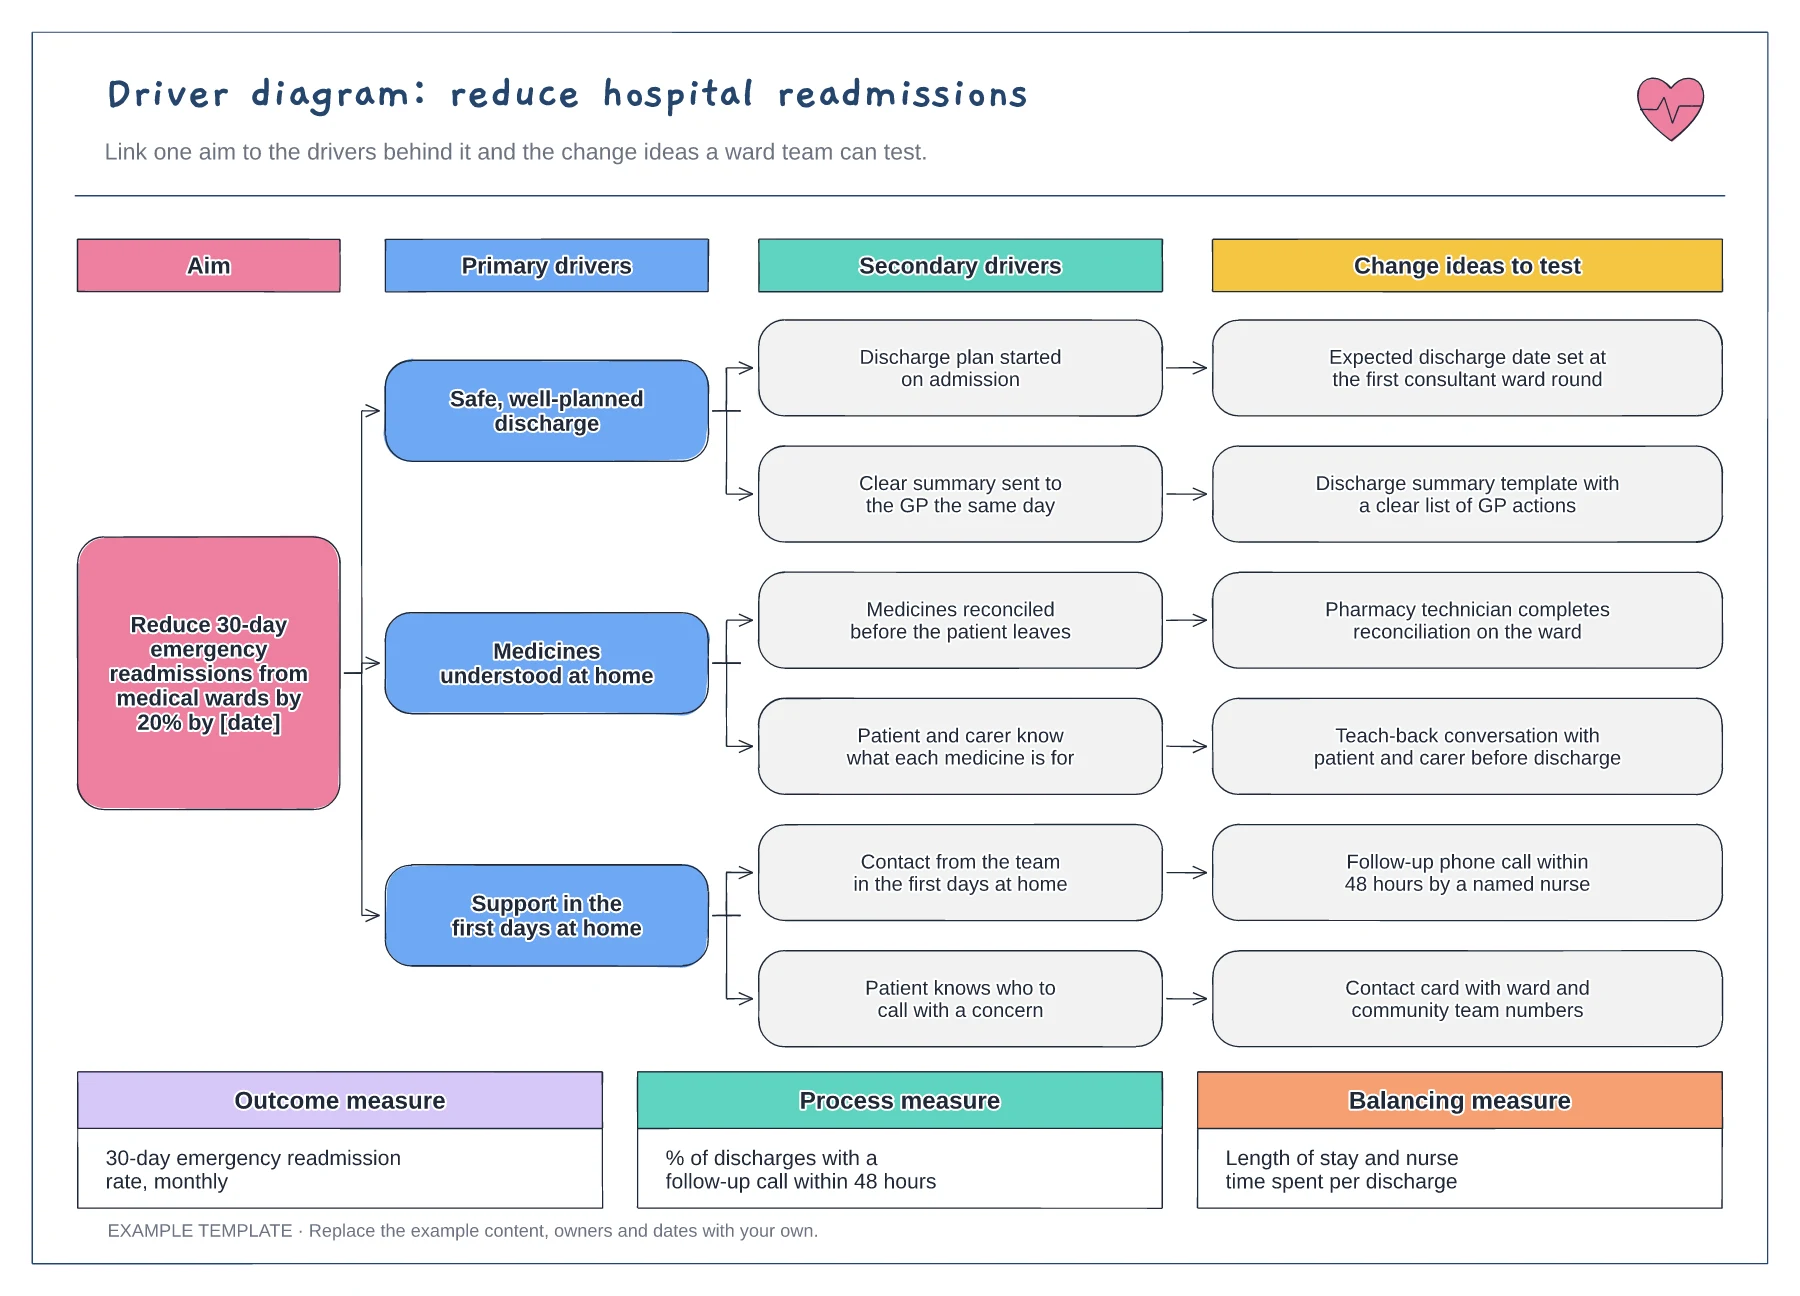
Aim with a target and date · Primary and secondary drivers · Change ideas and three types of measure
Preview and use template →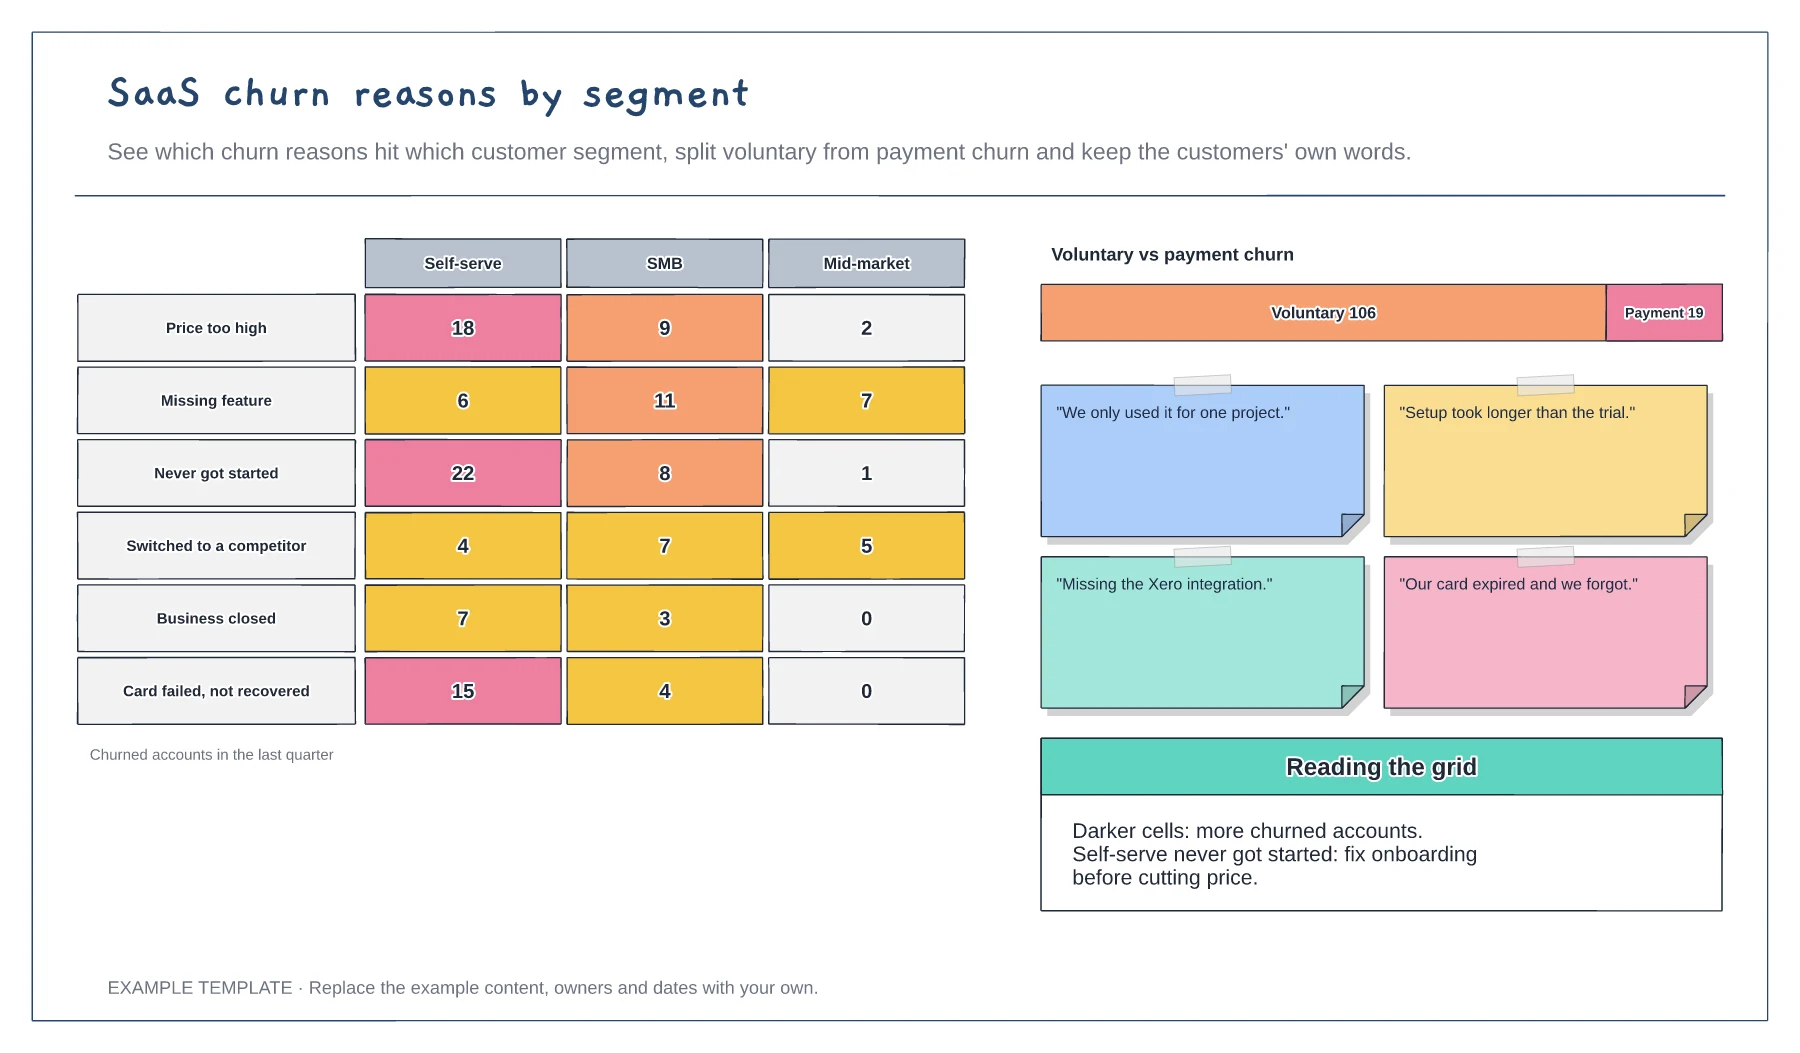
Heat grid of churn reasons by segment · Voluntary versus payment churn split · Customer quotes beside the data
Preview and use template →