Finance
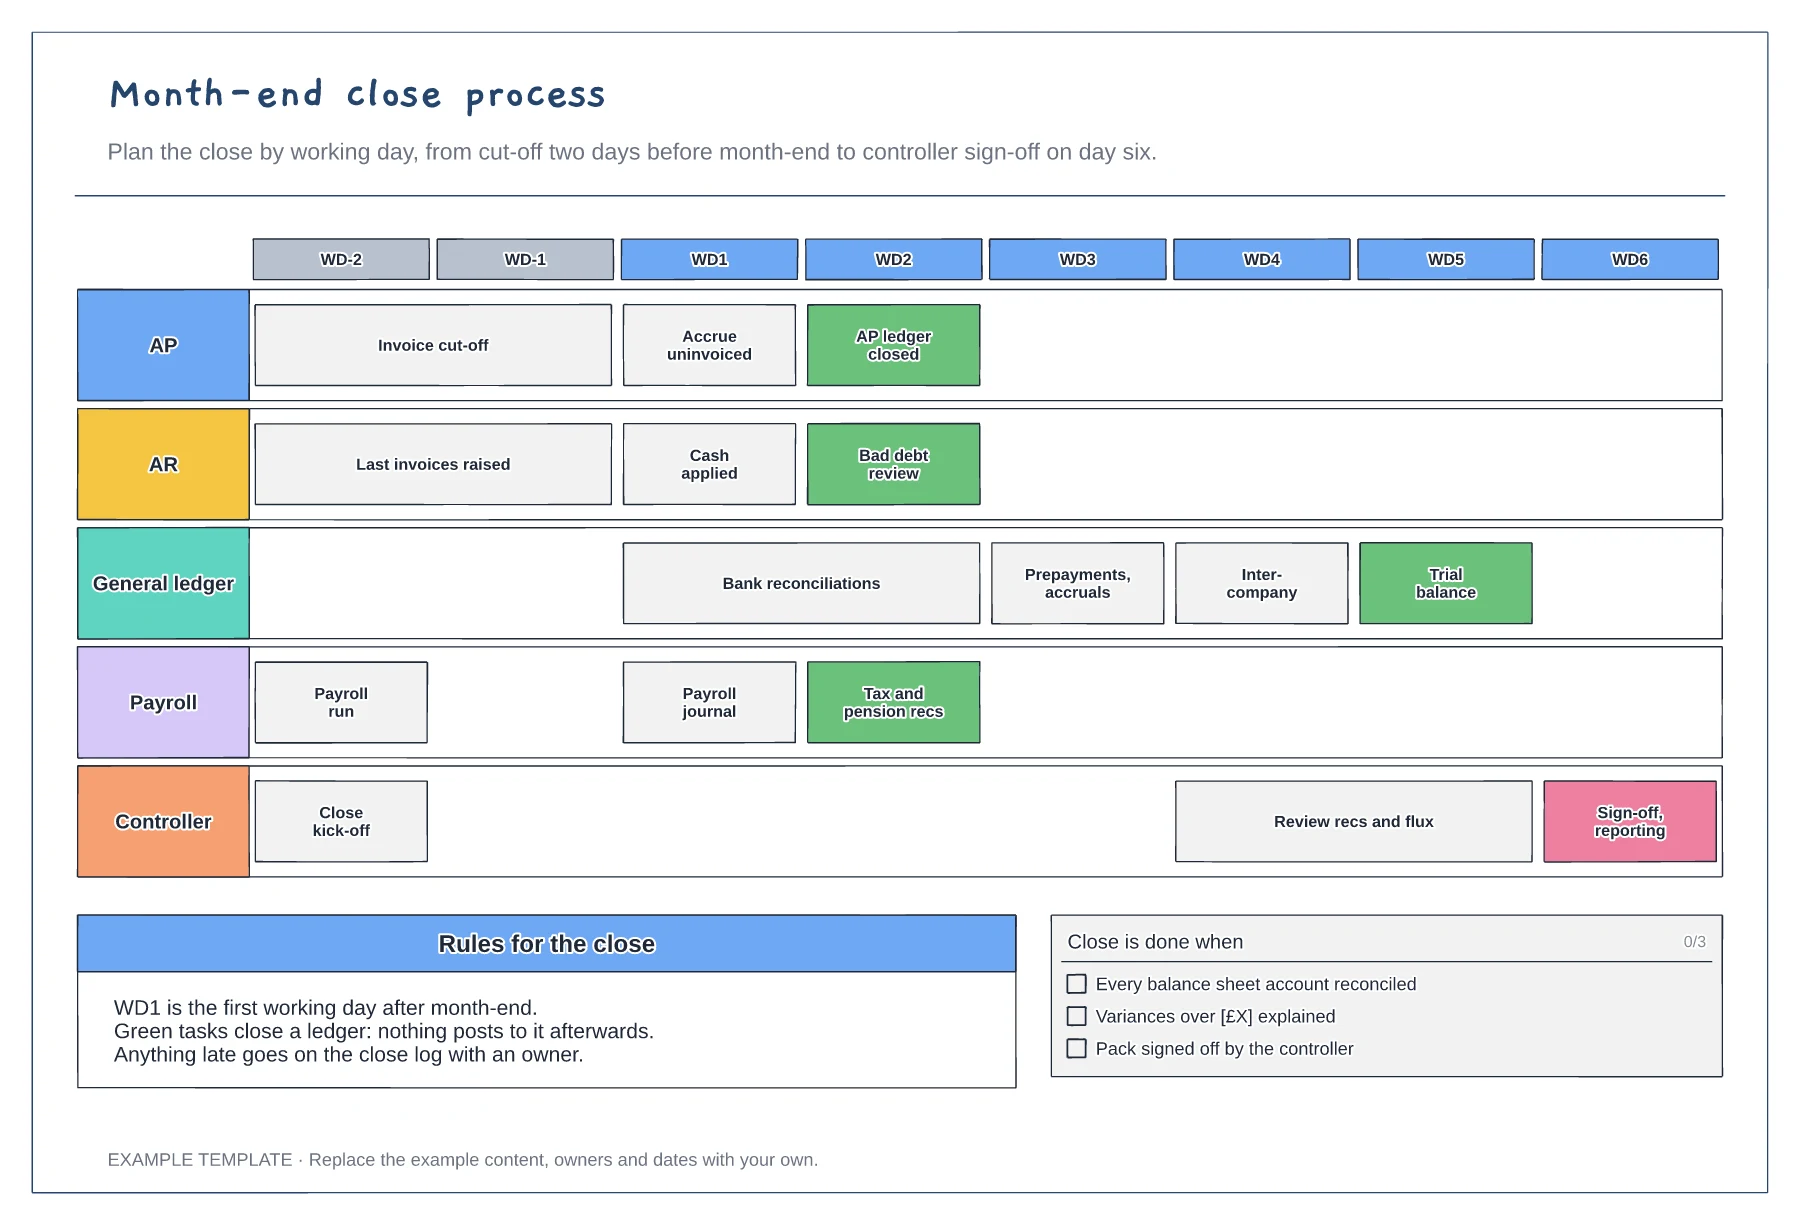
Month-end close process template
Working-day grid from WD-2 to WD6 · Tasks for five teams · Ledger close points and a done checklist
Preview and use template →A burndown chart shows at a glance whether the month-end close is on track. This example counts the close tasks still open at the end of each working day as bars, plots the planned burndown as a line, and marks the blockers that held the close up, such as a failed bank feed and unagreed intercompany balances.
This is a planning example, not financial, accounting, tax or legal advice. Check your own policies, auditors and local rules.
No account needed · Opens as your own editable page
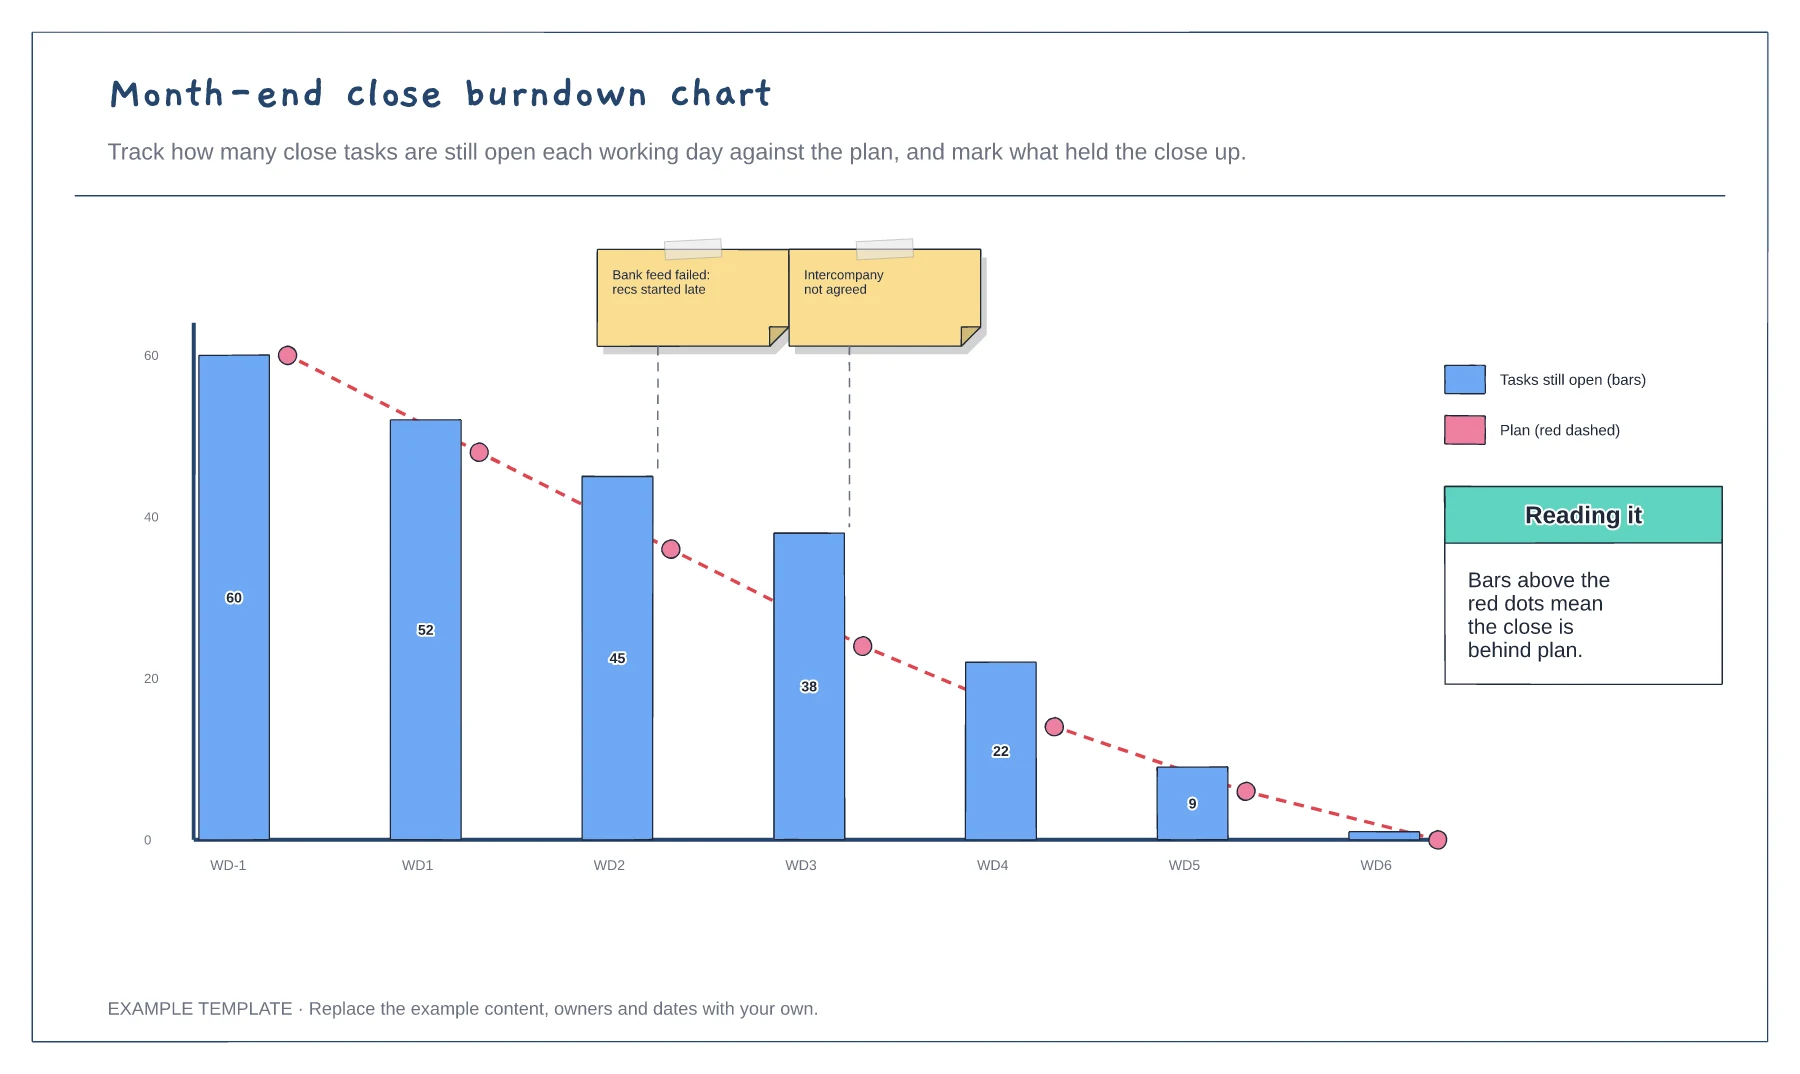
Count your close tasks and plan how many should be finished by the end of each working day.
At the end of each day, count the tasks still open and add the bar.
When a bar sits above the plan, note why on the chart. Review the notes after the close.
Enter the number of close tasks still open at the end of each working day. The gap to the planned line shows whether the close is on track.
No. Open the template and edit it in your browser. Your work saves on this device. An account is optional if you want to sync your workspace.
Yes. Use Export in the editor to save a PNG, SVG or PDF, or download an editable .epicdraw backup.
Working-day grid from WD-2 to WD6 · Tasks for five teams · Ledger close points and a done checklist
Preview and use template →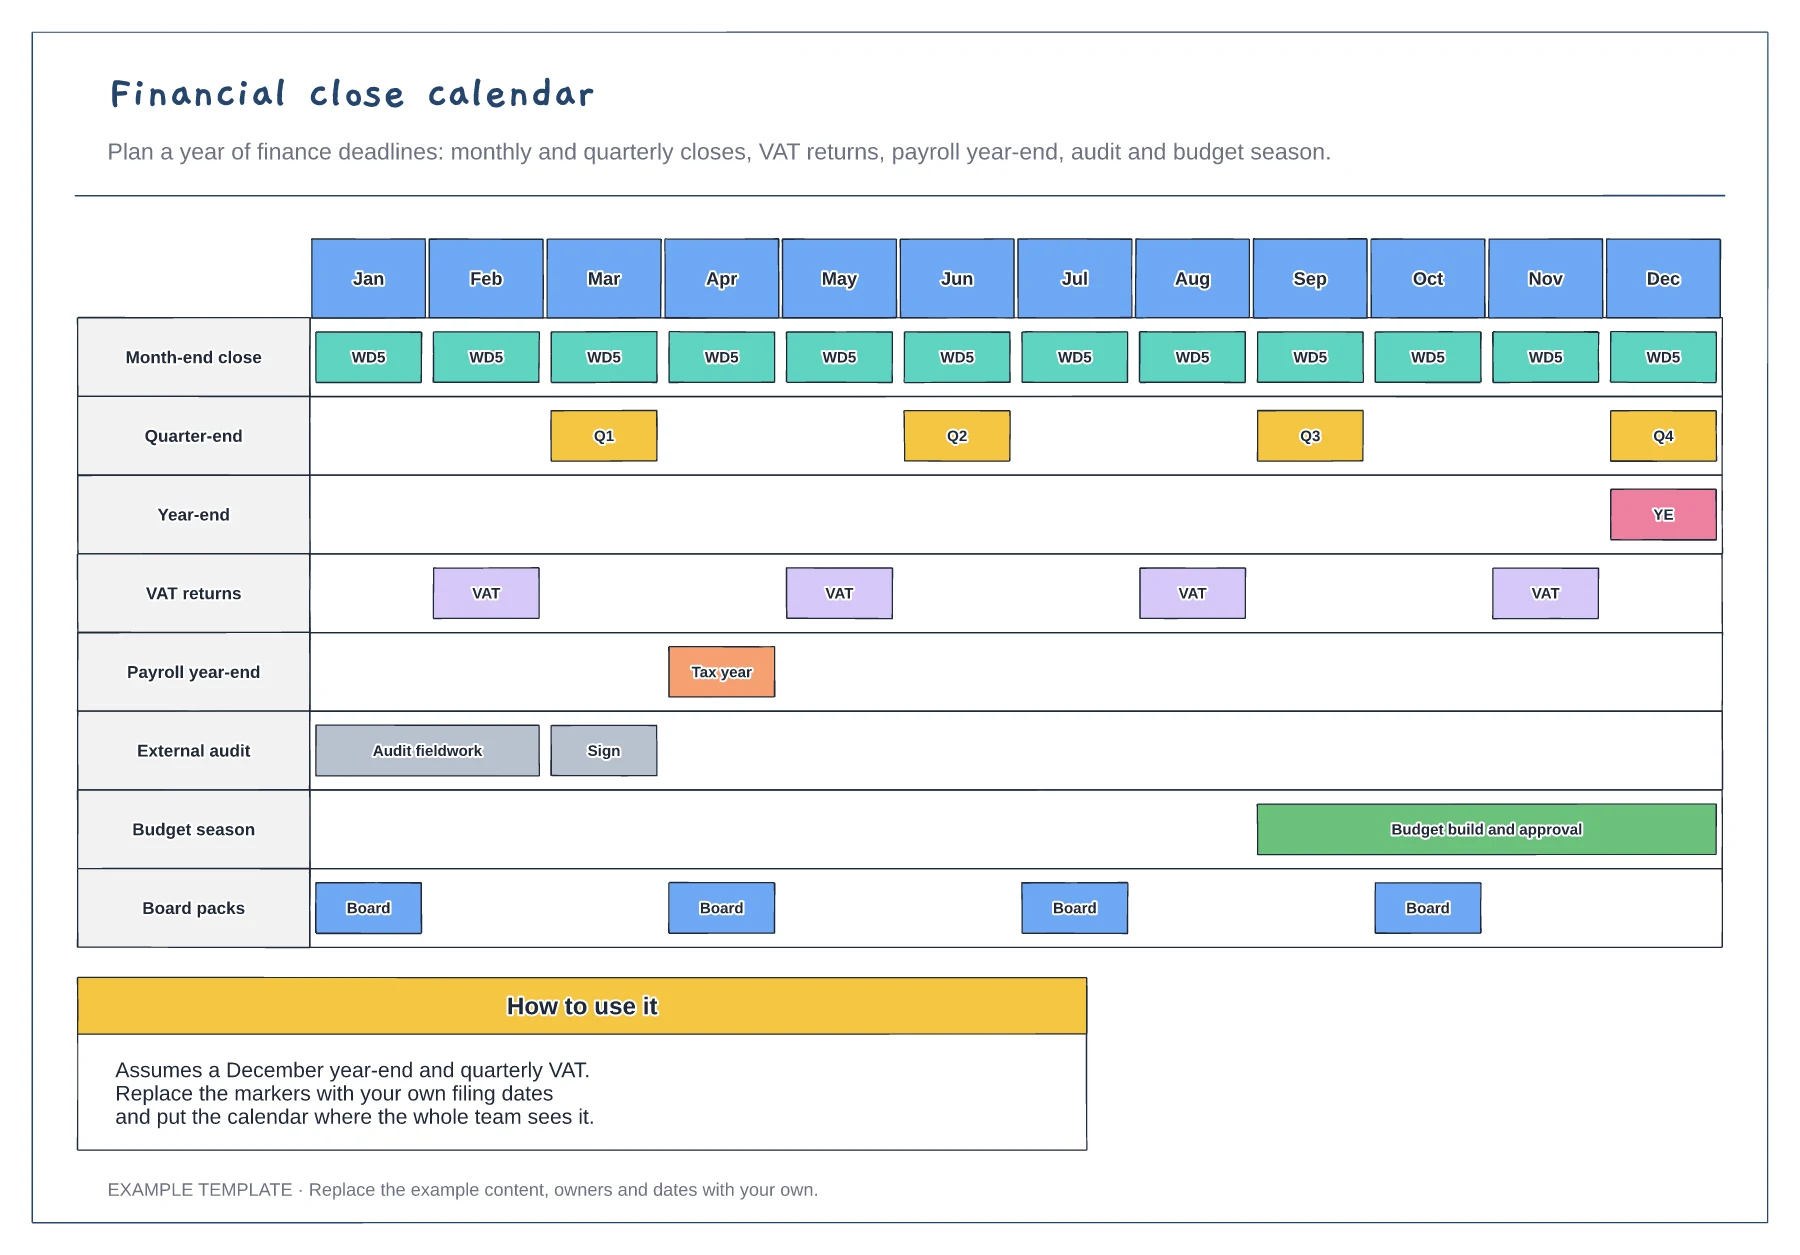
Twelve months on one page · Closes, filings, audit and budget · Board pack dates
Preview and use template →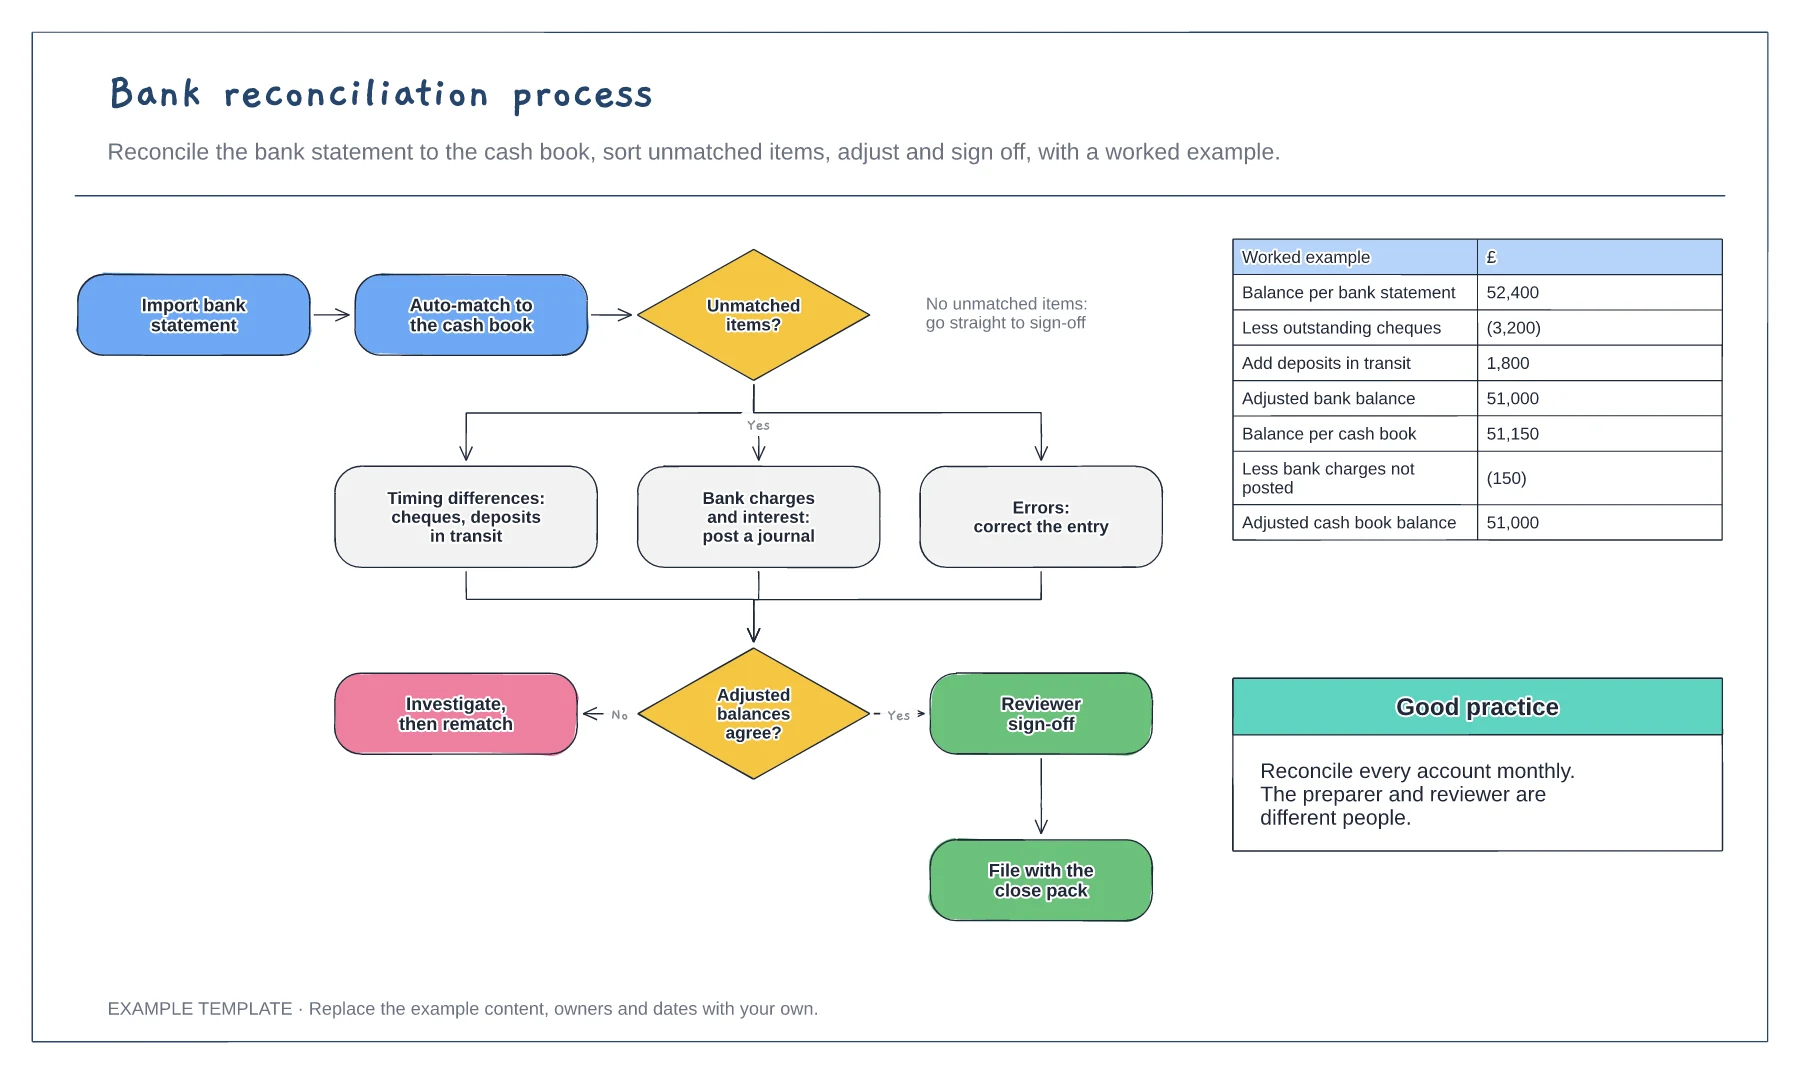
Import, match and adjust steps · Three kinds of unmatched item · Worked reconciliation example
Preview and use template →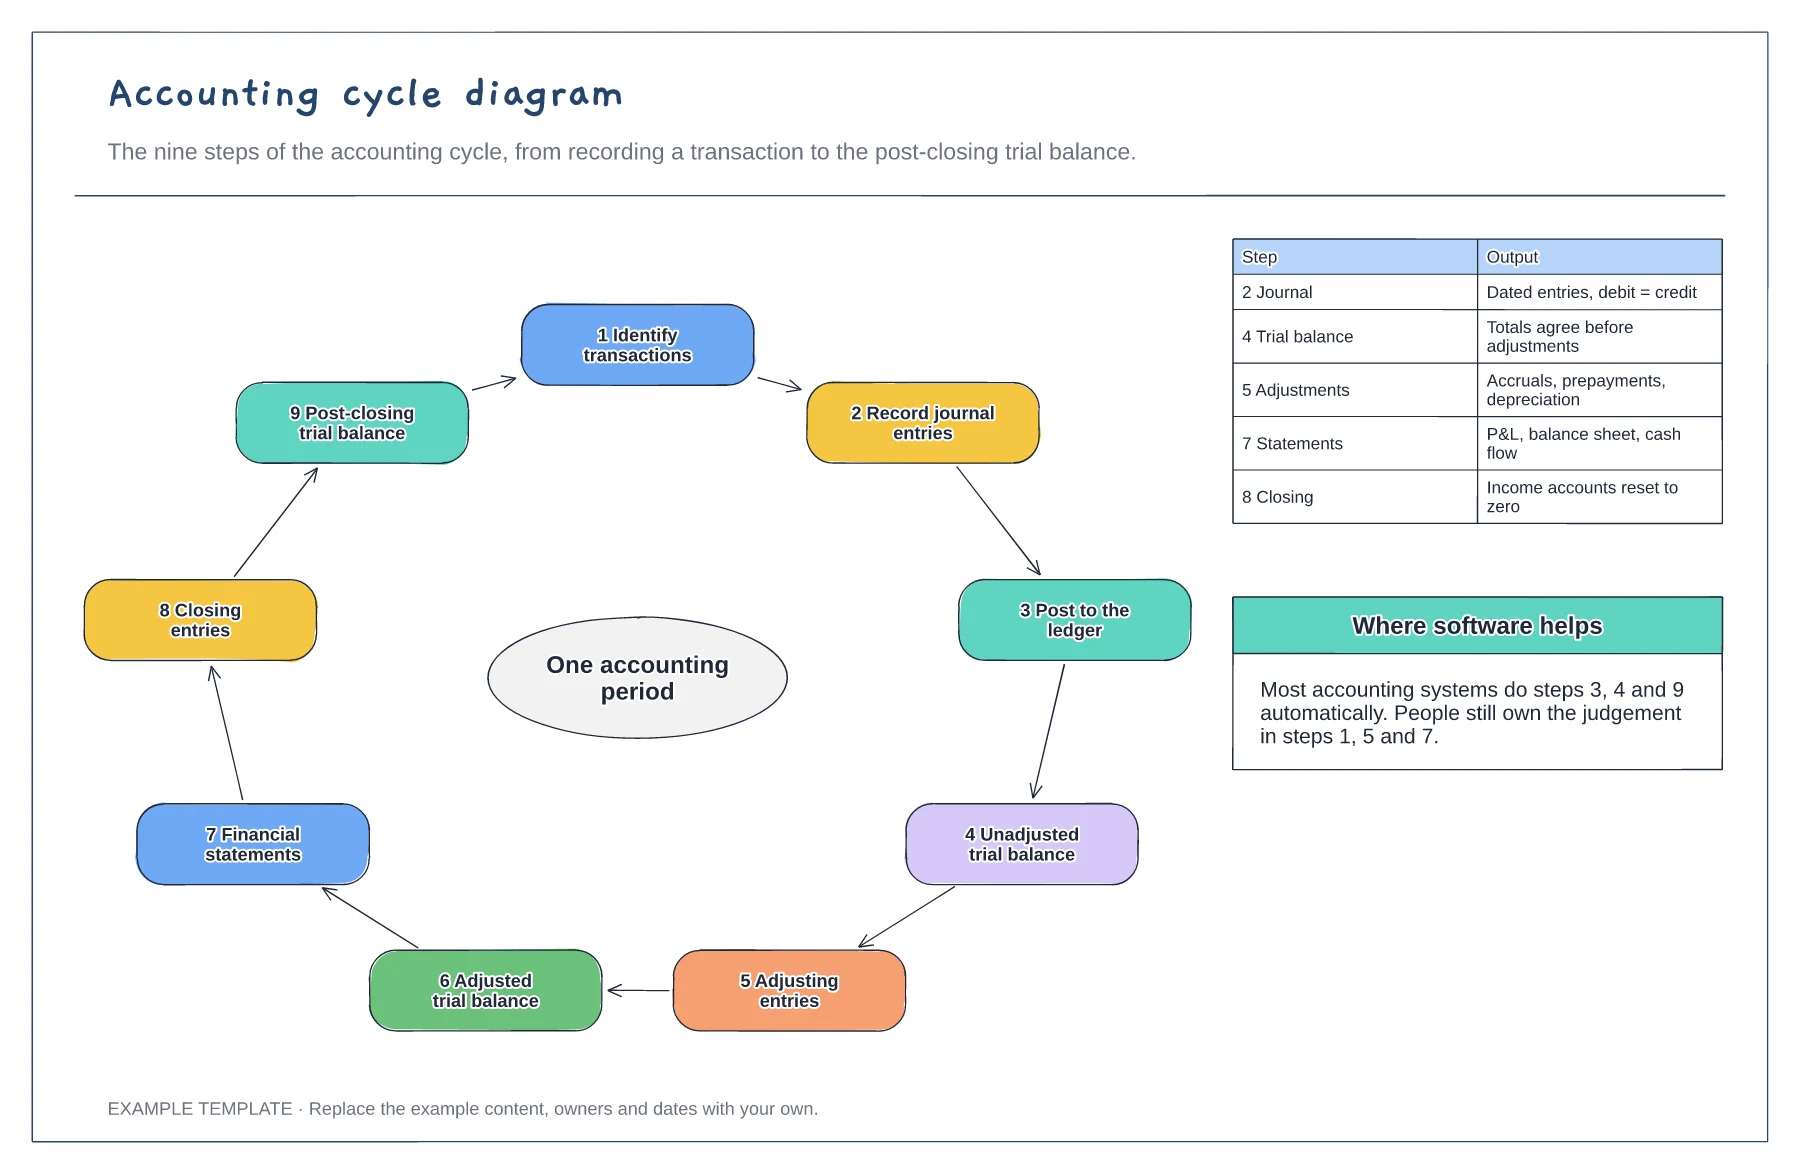
Nine steps in a loop · Output of the key steps · Where software does the work
Preview and use template →
Columns from idea to published · Editable example content cards · Owner and next-action prompts
Preview and use template →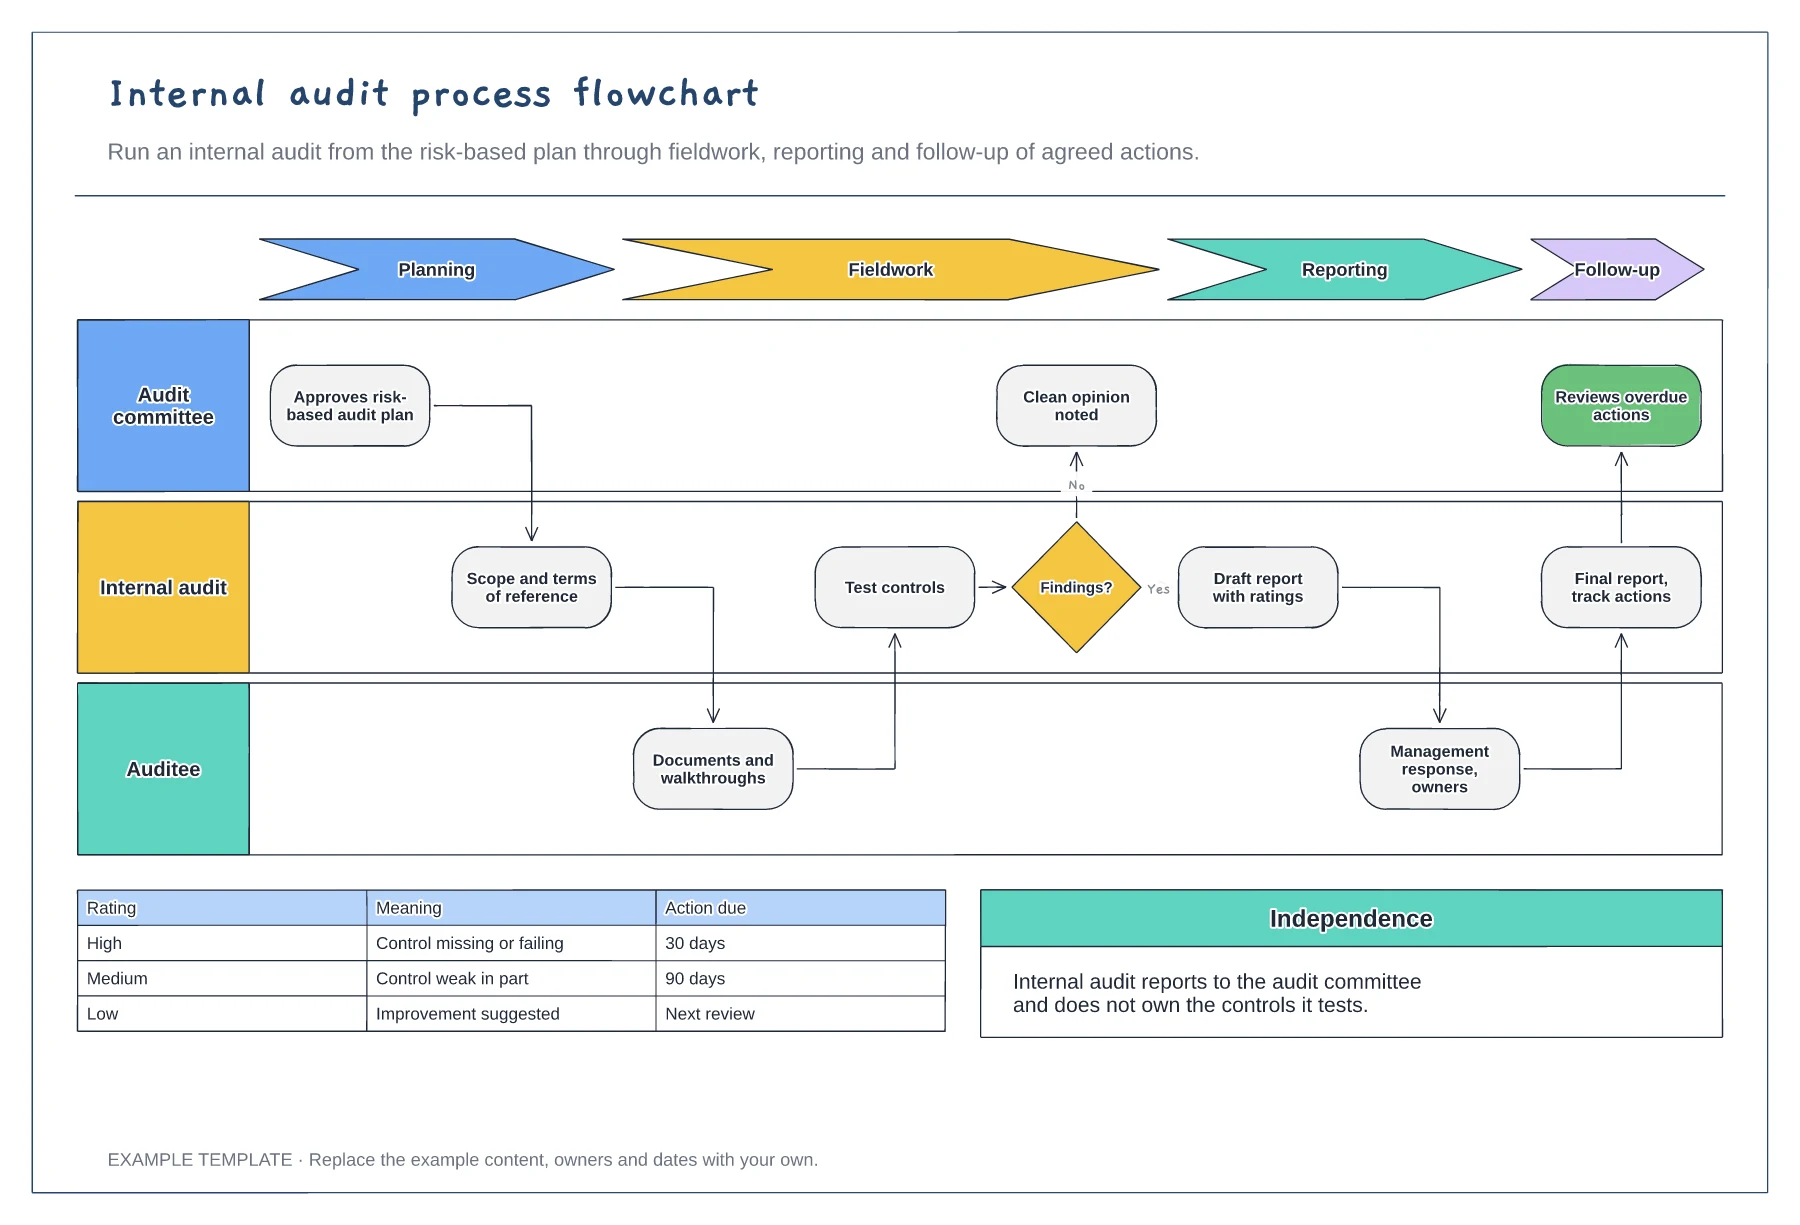
Four phases across three lanes · Findings decision and management response · Finding ratings with action deadlines
Preview and use template →