Product
Free trial conversion analysis template
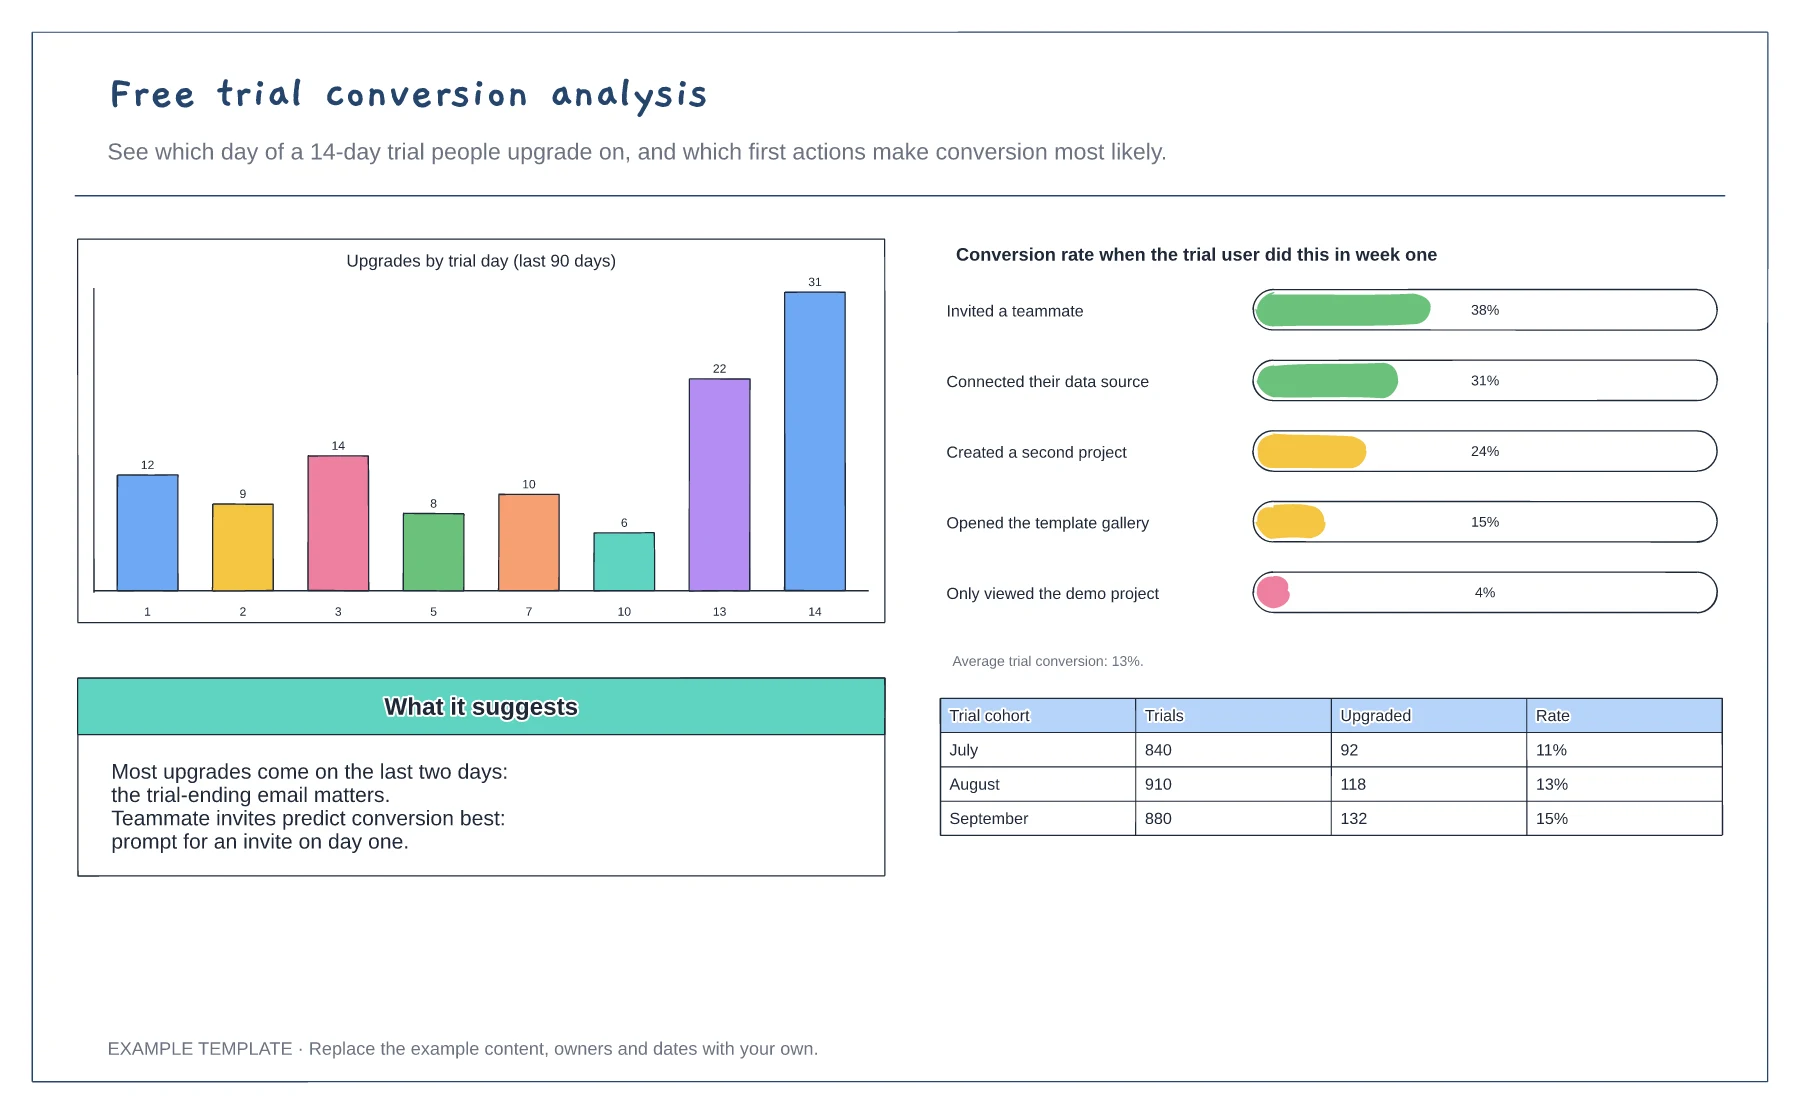
Upgrades by trial day · Conversion by first-week action · Monthly cohort table
Preview and use template →An ecommerce conversion funnel shows how many visitors reach each step between landing on your shop and buying, so you can see where most of them stop. This example follows one month of a small online shop from 40,000 sessions to 960 purchases, gives the rate for each step and pairs every drop with a fix to test.
No account needed · Opens as your own editable page
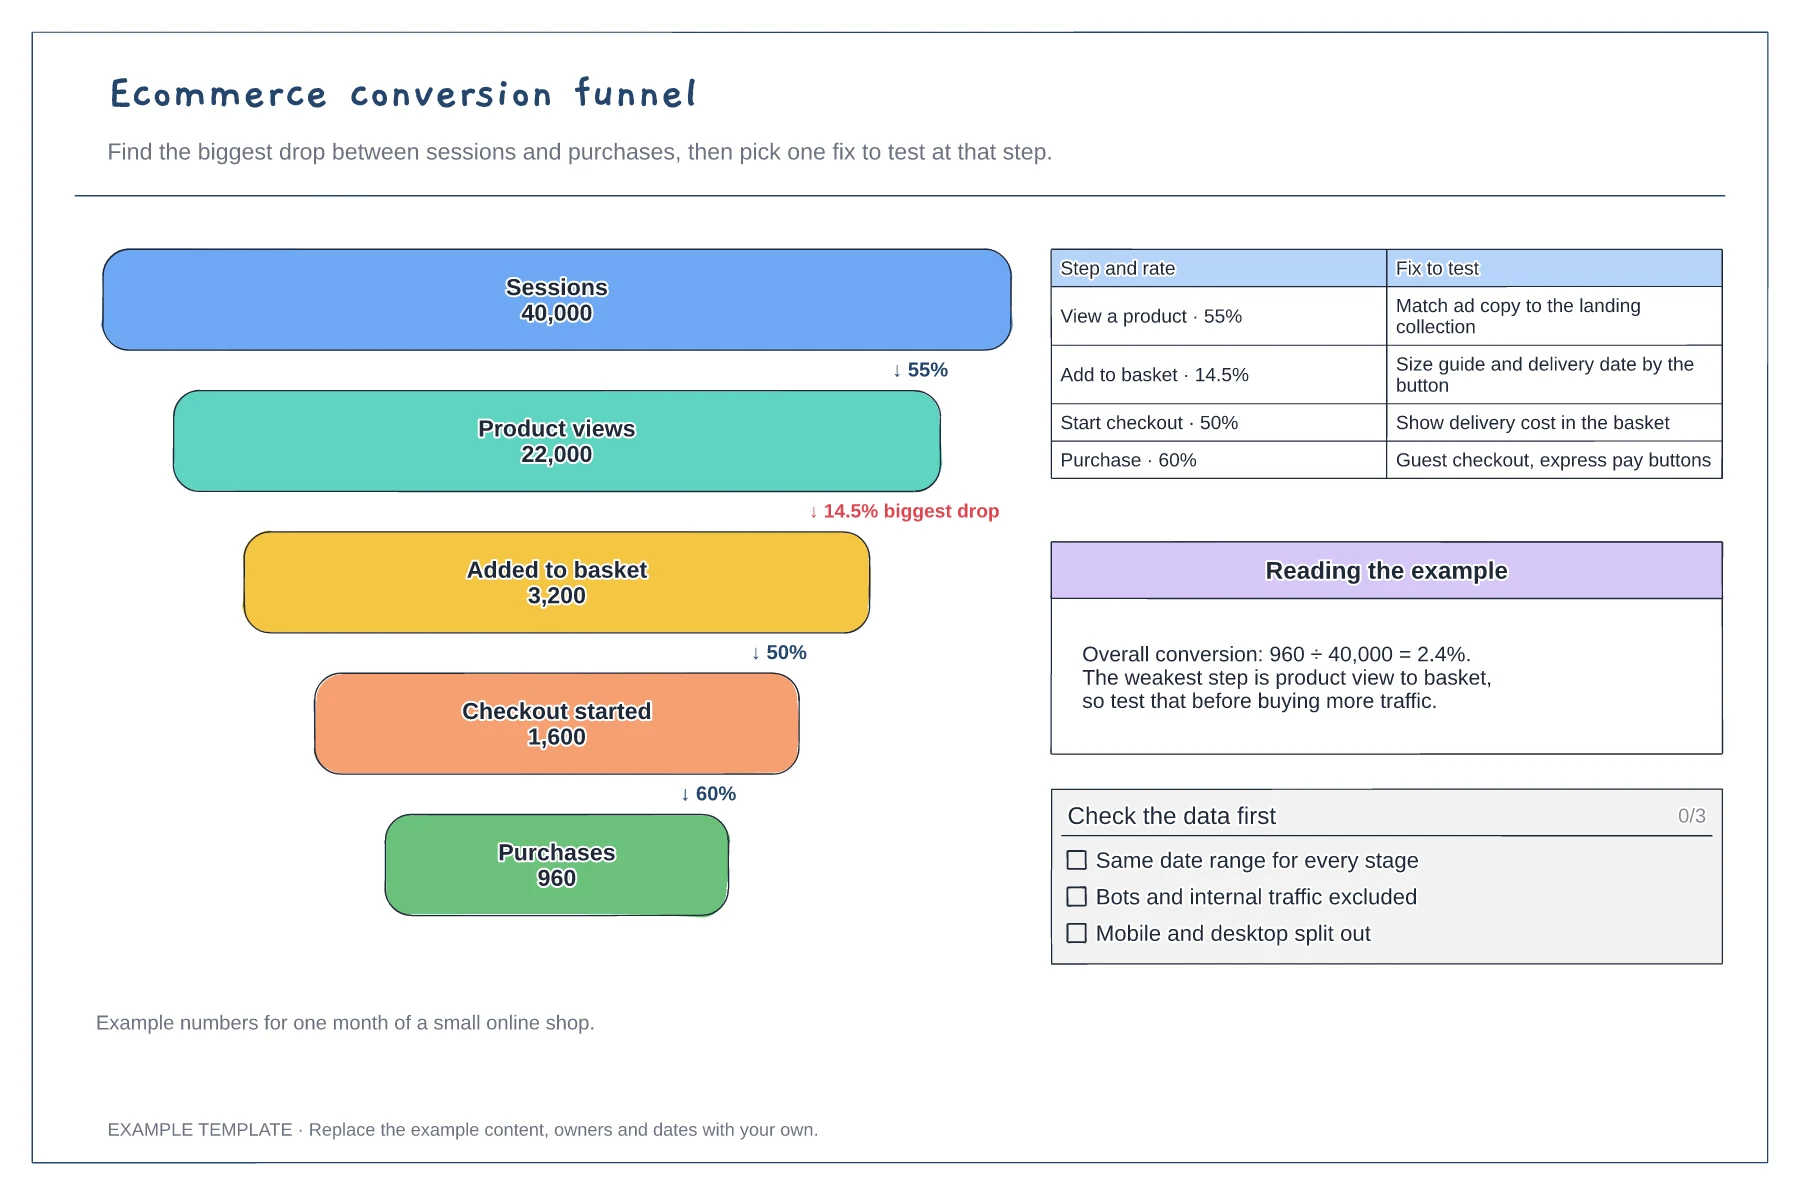
Take every stage from the same period and the same traffic, from sessions through to purchases. Mixing date ranges or sources creates drops that are really just differences in reporting.
Compare the step rates, not just the totals, and highlight the lowest. Fixing that step often helps more than buying extra traffic for the top of the funnel.
Pick one fix for the weakest step and run it as a test with a clear start and end date. Changing several things at once makes it hard to tell which one worked.
Yes. Add a stage, such as account creation, with its count, then update the step rates and the fix to test so the biggest drop is still highlighted.
No. Open the template and edit it in your browser. Your work saves on this device. An account is optional if you want to sync your workspace.
Yes. Use Export in the editor to save a PNG, SVG or PDF, or download an editable .epicdraw backup.
Upgrades by trial day · Conversion by first-week action · Monthly cohort table
Preview and use template →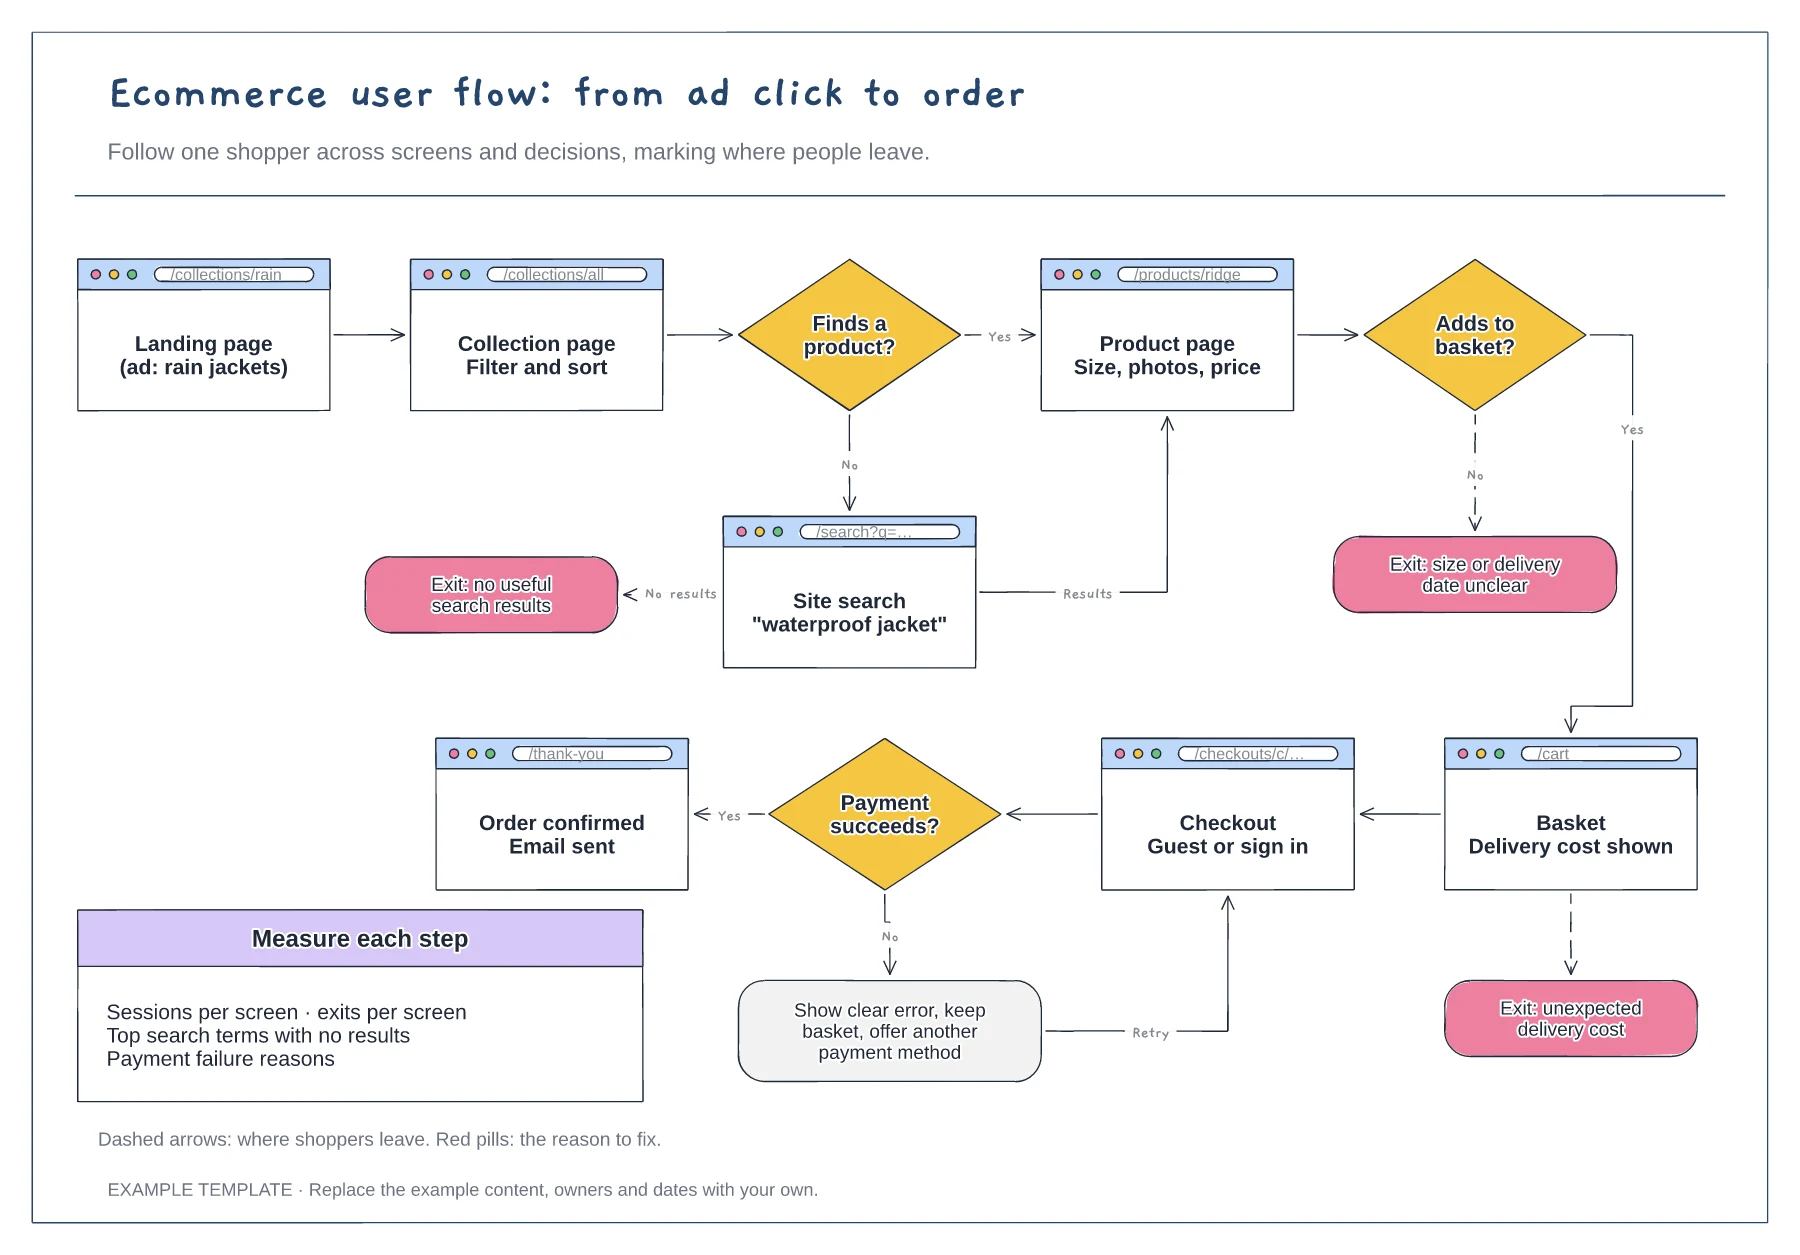
Screens with their URLs · Search, basket and payment decisions · Exit points with the reason to fix
Preview and use template →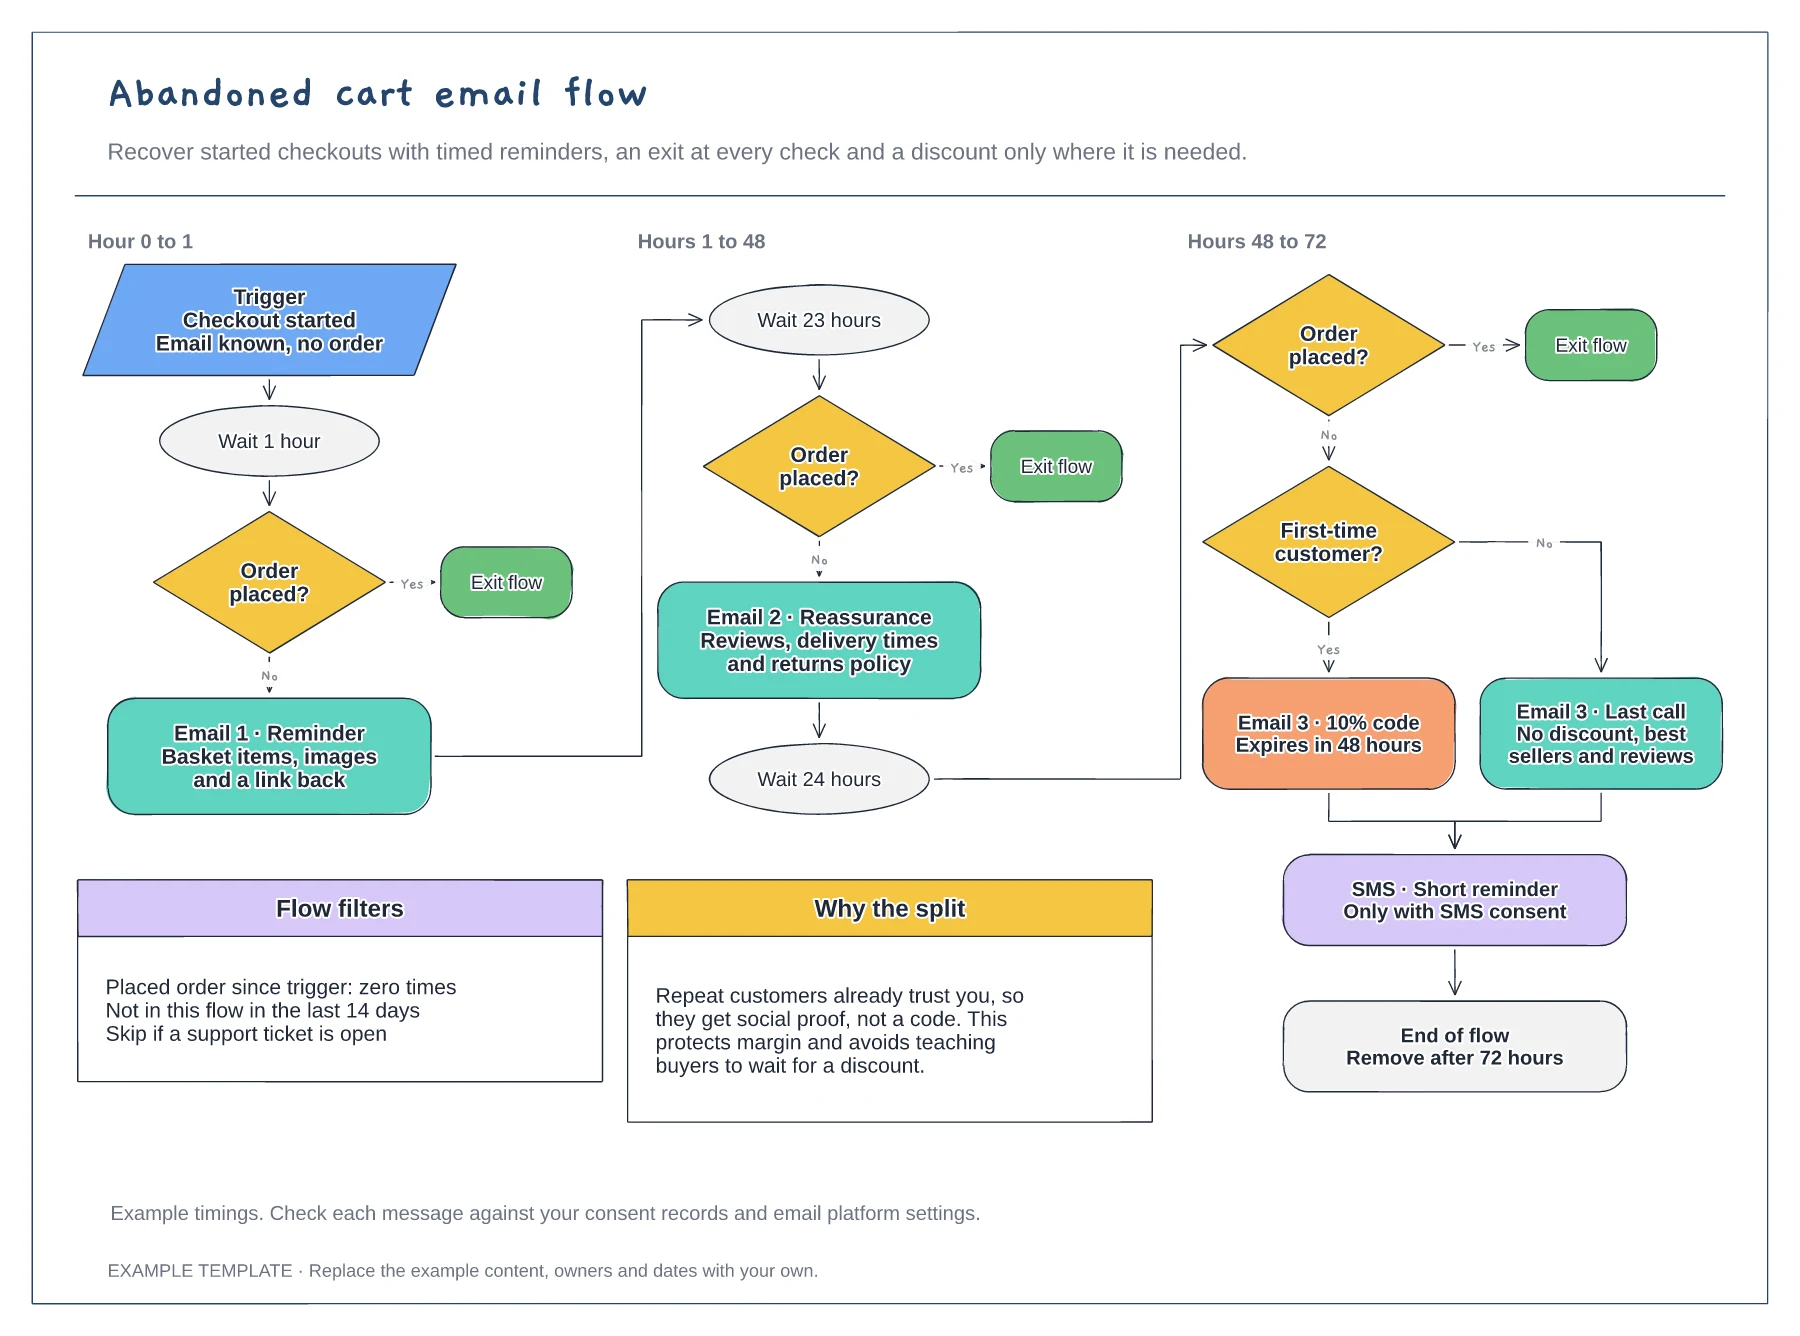
Trigger, waits and order checks · First-time buyer discount split · Flow filters and an SMS step
Preview and use template →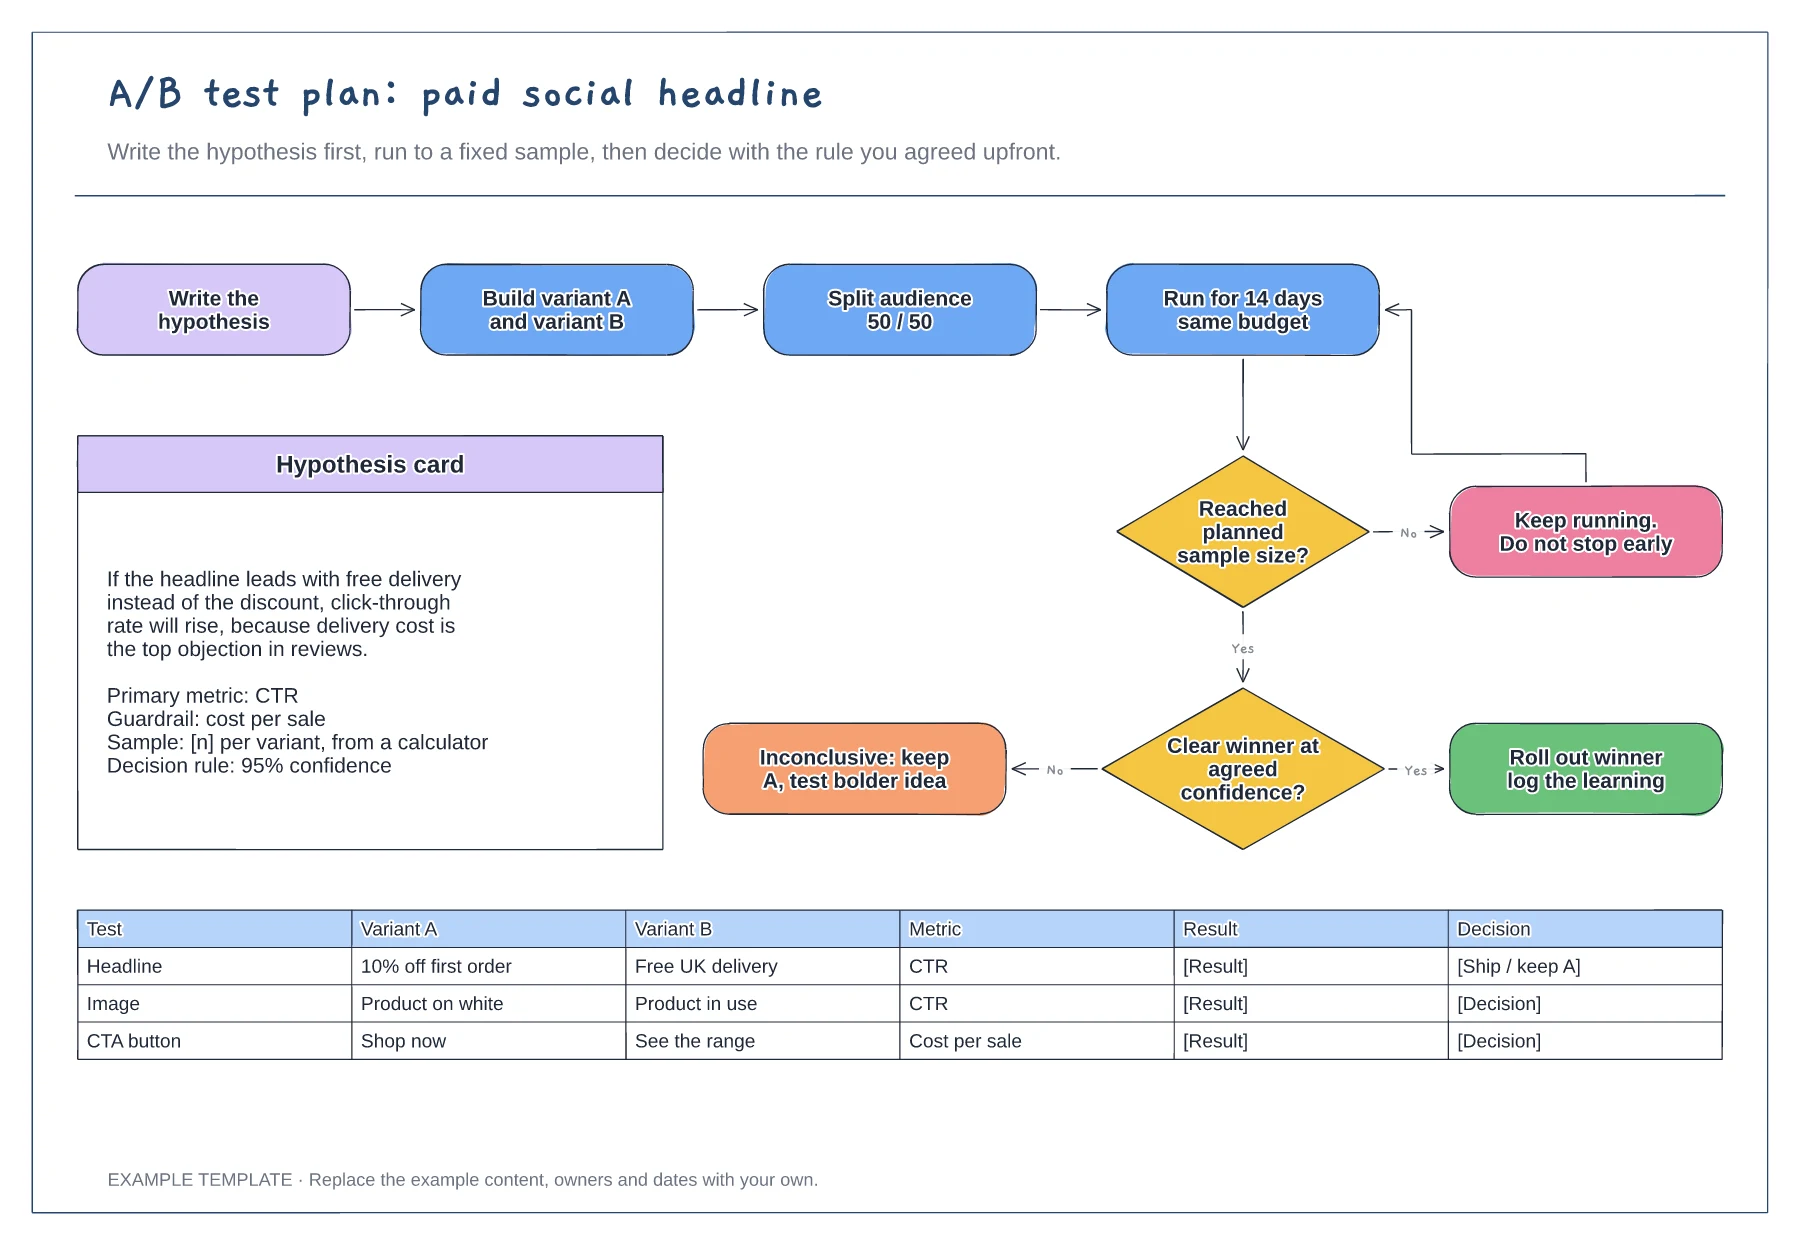
Hypothesis card with metric and guardrail · Decision flow with a no-peeking loop · Test log for variants and results
Preview and use template →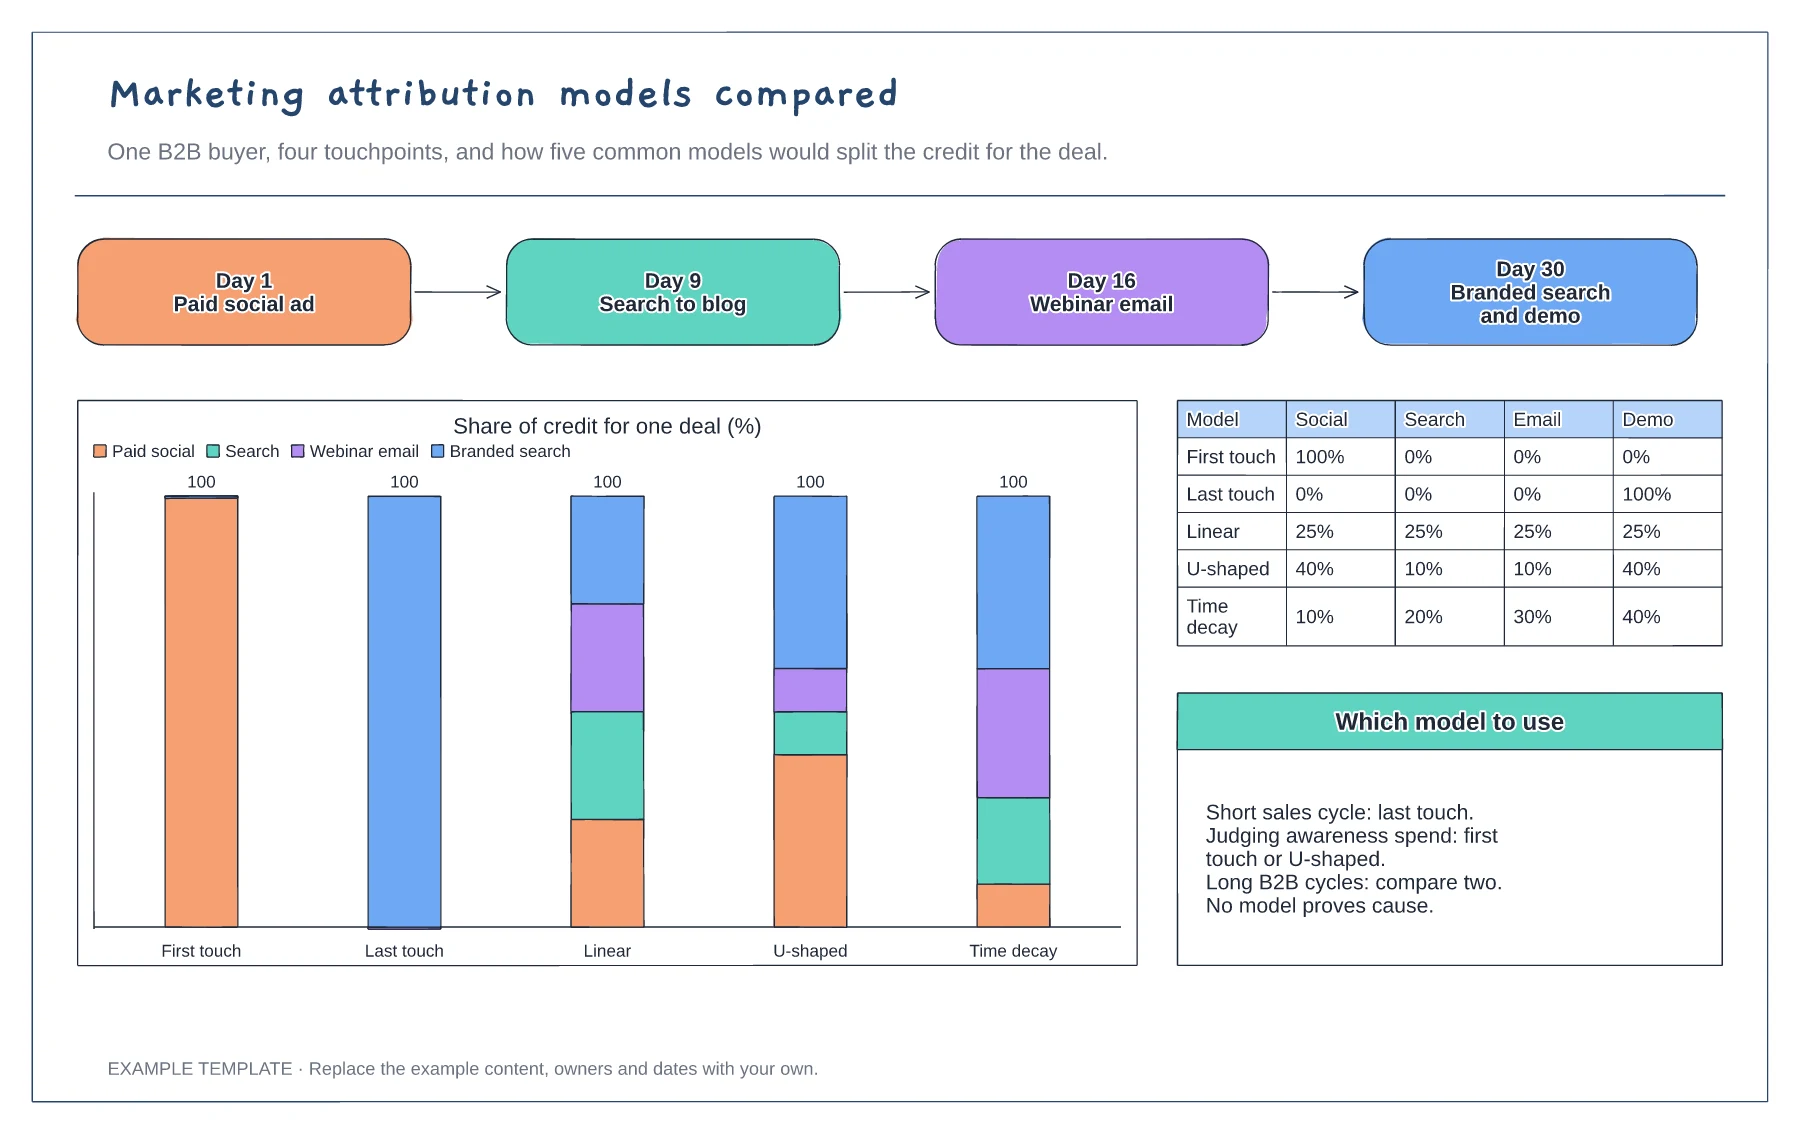
Four-touchpoint buyer path · Stacked chart of credit by model · Percentage table and notes on choosing a model
Preview and use template →
Define the starting point, task and confirmed end state. · Give each decision explicit outcomes. · Explain address correction and return routes.
Preview and use template →