Logistics
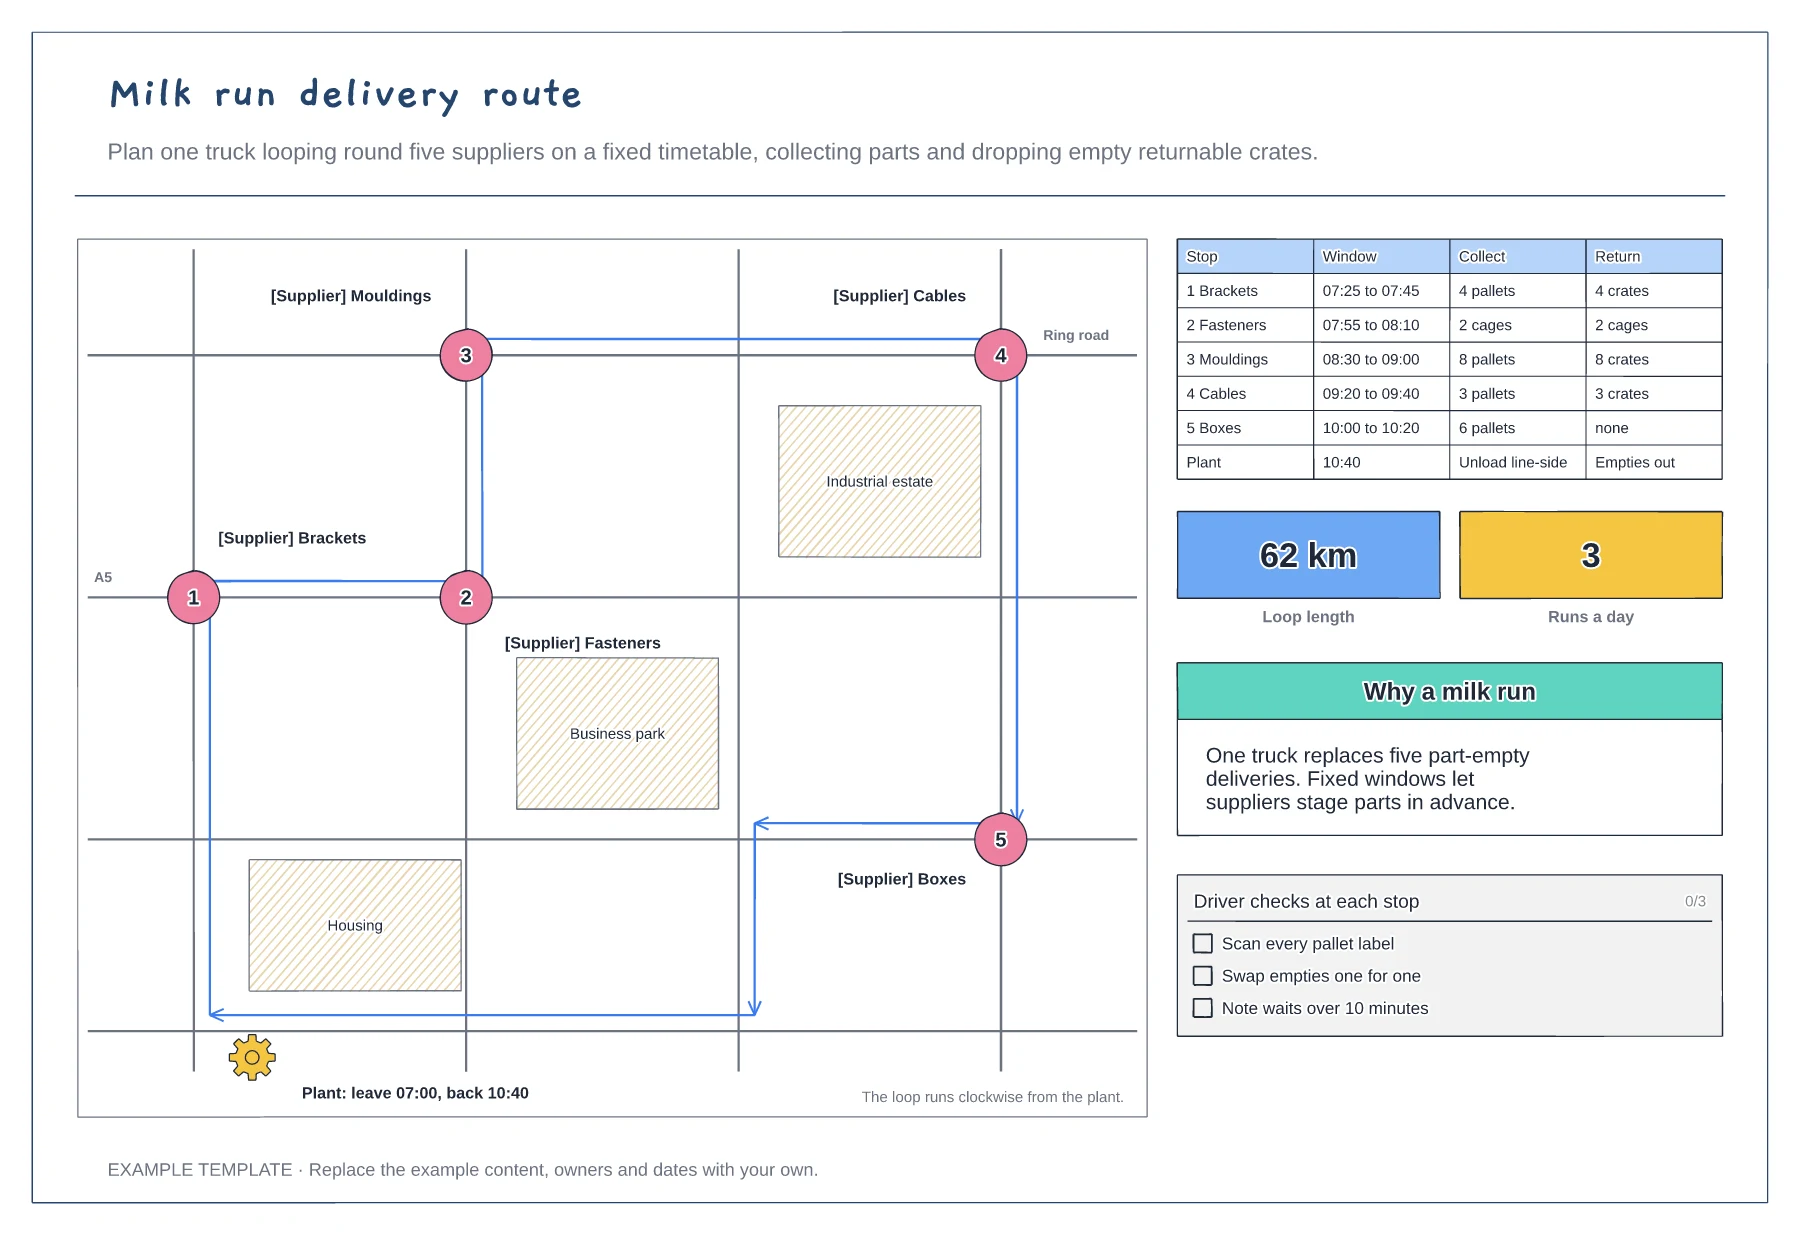
Milk run delivery route template
The loop on a road map with numbered stops · Time windows, pick-ups and returnables per stop · Loop length, runs per day and driver checks
Preview and use template →The last mile is where most parcels fail and most cost is spent. This board follows one delivery station through a day as a vertical timeline of scan events, from the trunk trailer arriving at 04:30 to customers rebooking failed parcels in the evening. Exceptions are marked in red. Alongside are the first-time delivery rate, stops per hour, a chart of failed first attempts by reason and the rules for proof of delivery.
No account needed · Opens as your own editable page
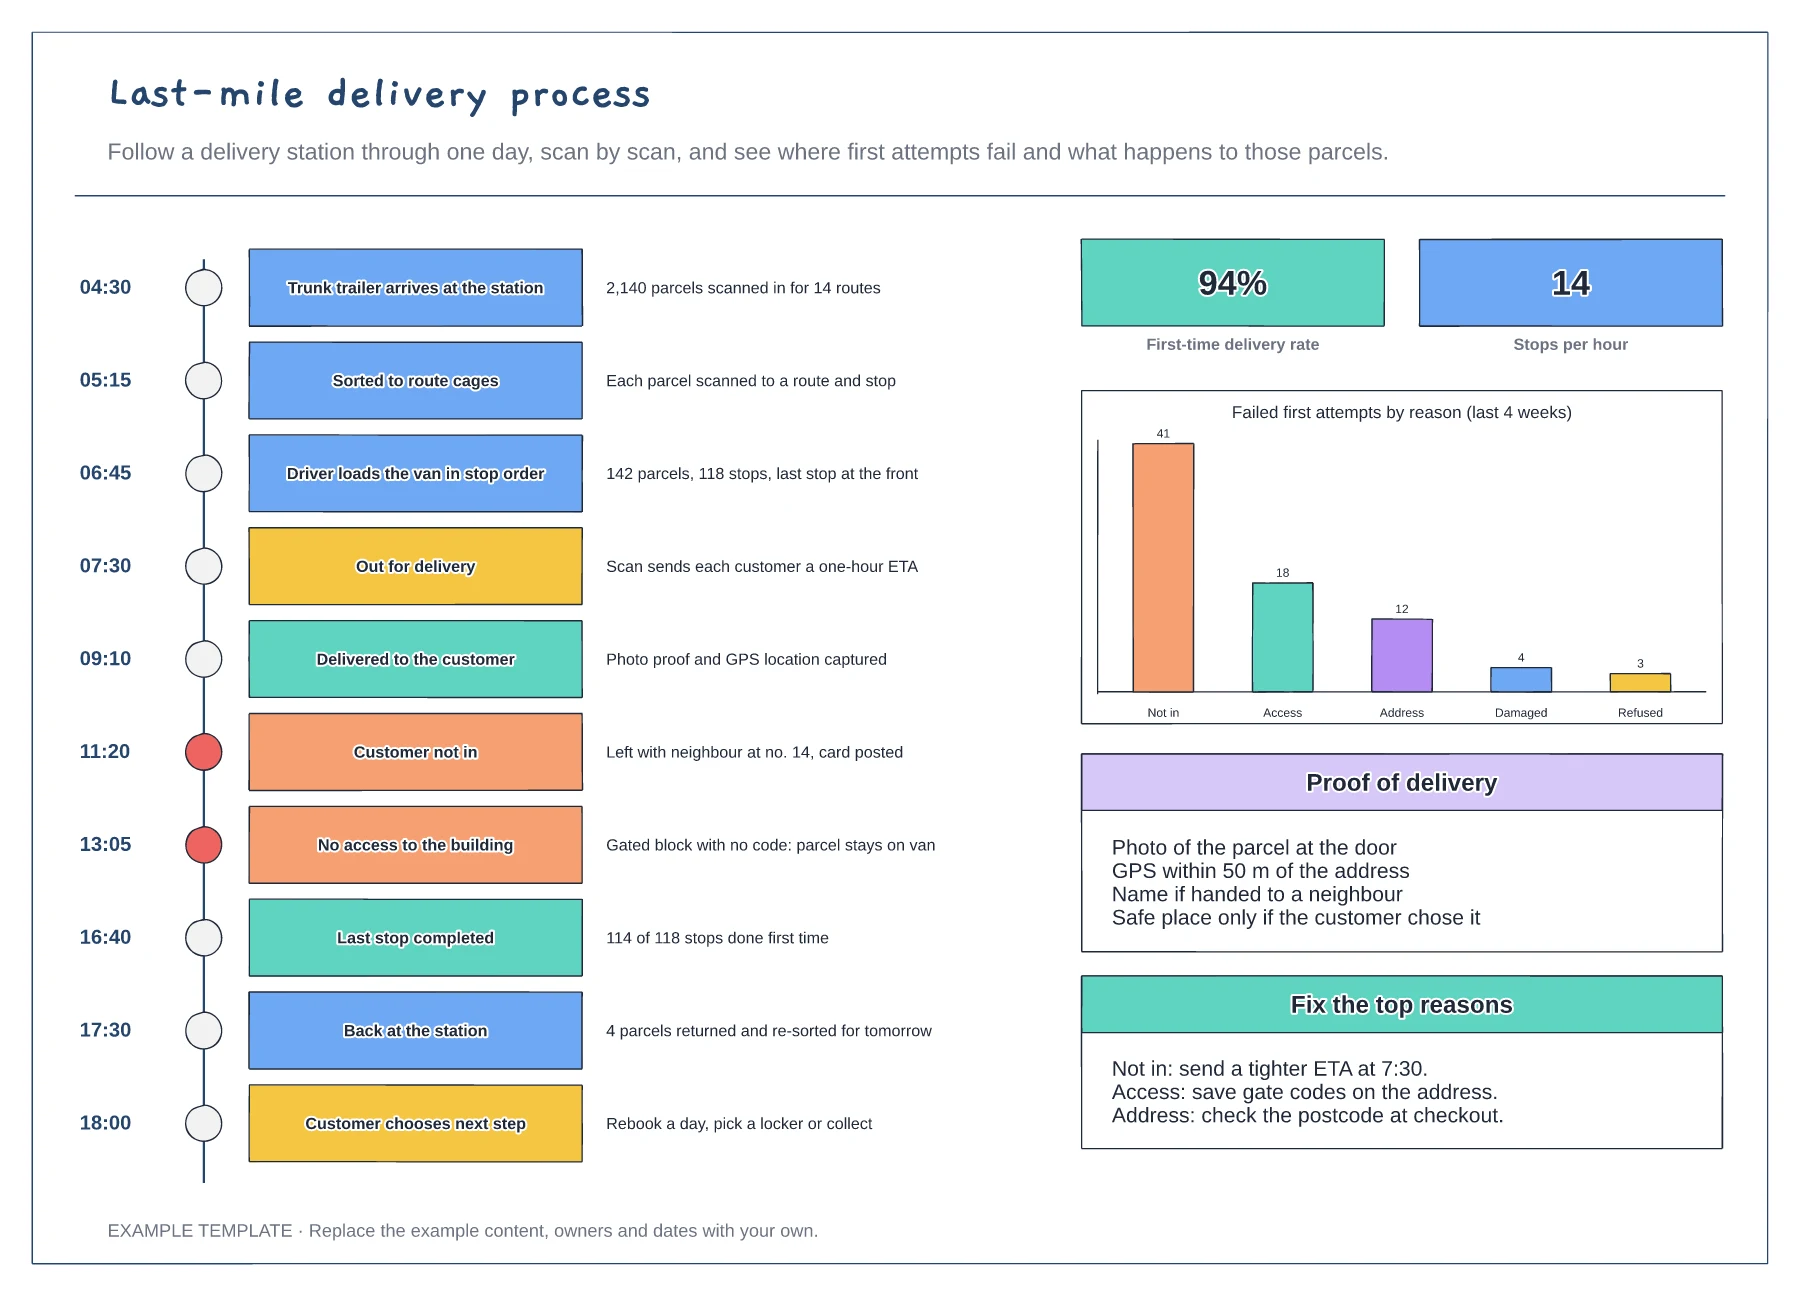
List each scan a parcel gets from arrival to delivery, with the time it usually happens. These are the points customers see in tracking.
Add the moments things go wrong, such as nobody in or no access, and what the driver does next.
Chart failed first attempts by reason and fix the top one first, for example with a tighter ETA or saved gate codes.
Yes. Edit each timestamp and scan event on the timeline, and update the parcel and stop counts to match a real day at your station.
No. Open the template and edit it in your browser. Your work saves on this device. An account is optional if you want to sync your workspace.
Yes. Use Export in the editor to save a PNG, SVG or PDF, or download an editable .epicdraw backup.
The loop on a road map with numbered stops · Time windows, pick-ups and returnables per stop · Loop length, runs per day and driver checks
Preview and use template →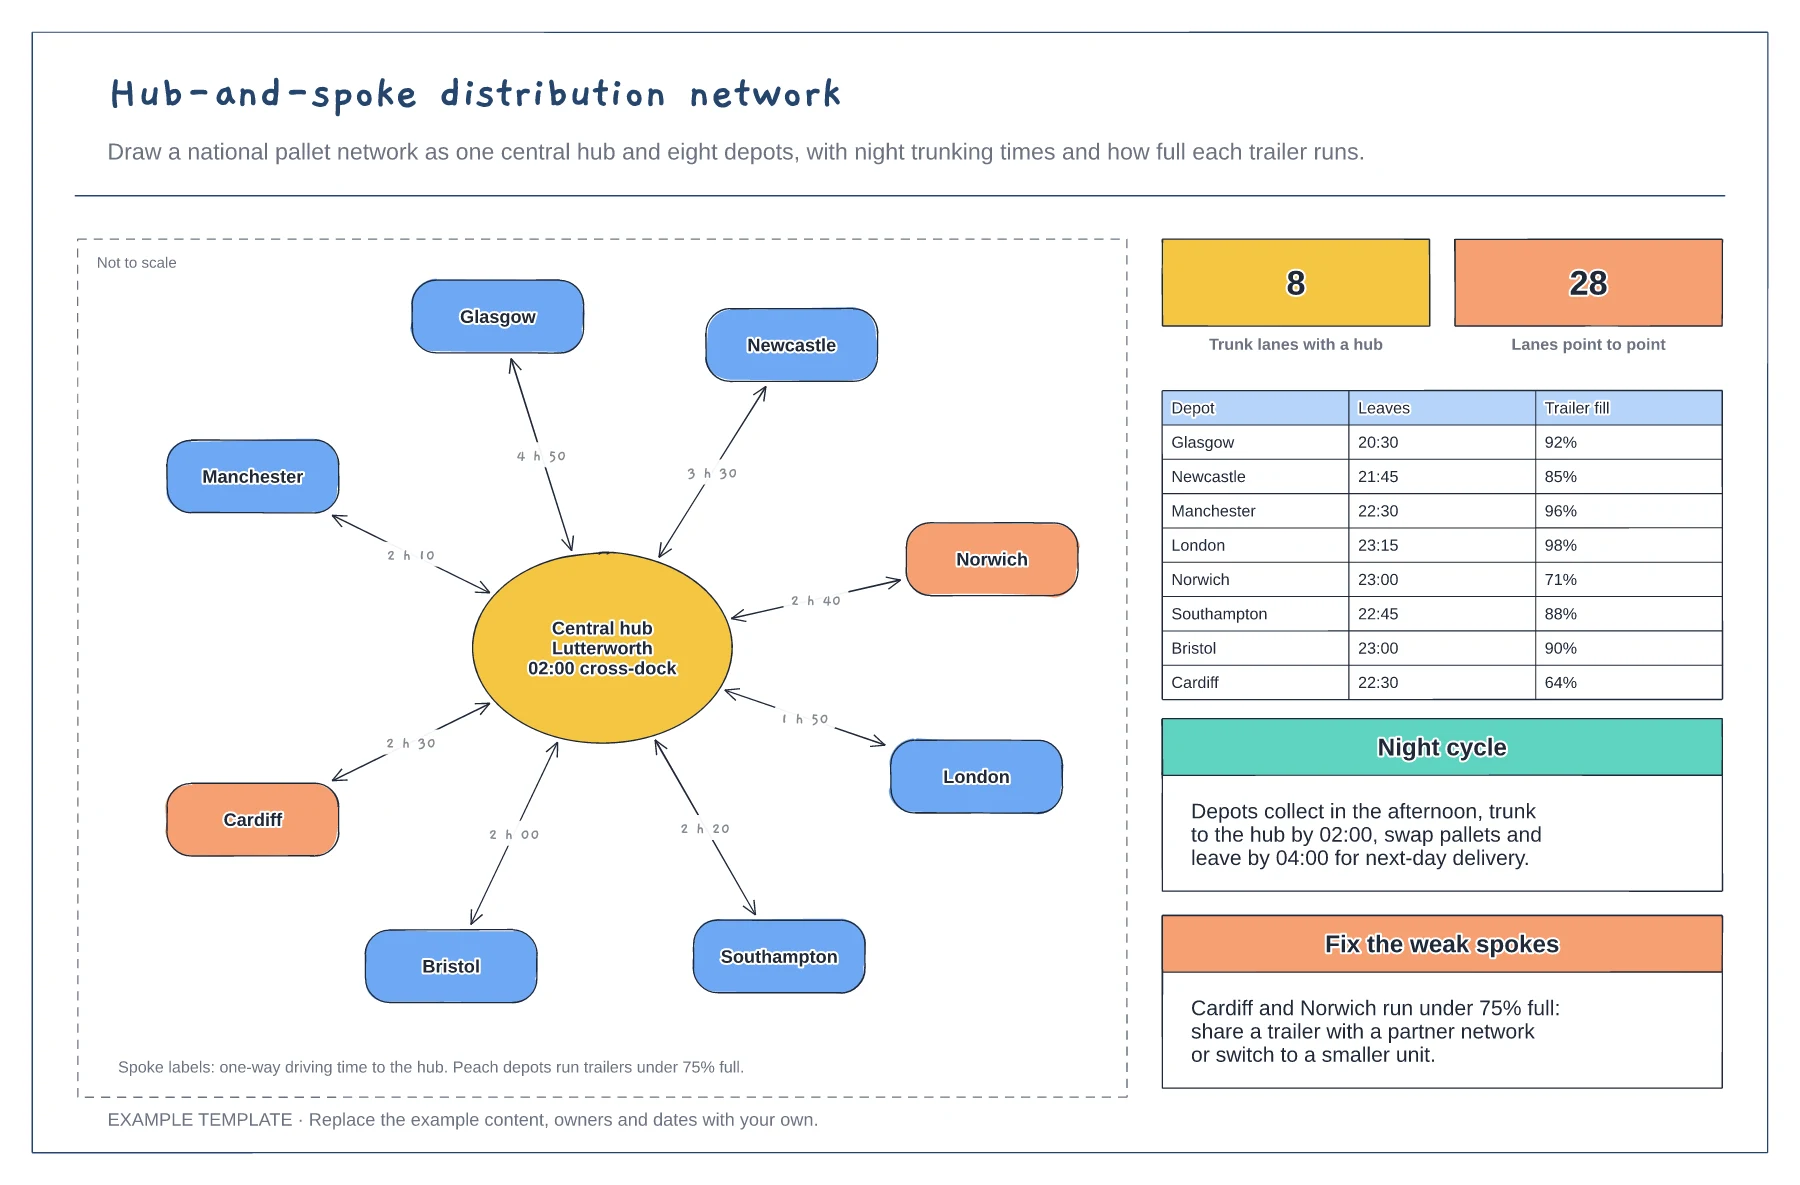
Central hub with eight spokes and driving times · Departure times and trailer fill for each depot · Night cycle and fixes for weak spokes
Preview and use template →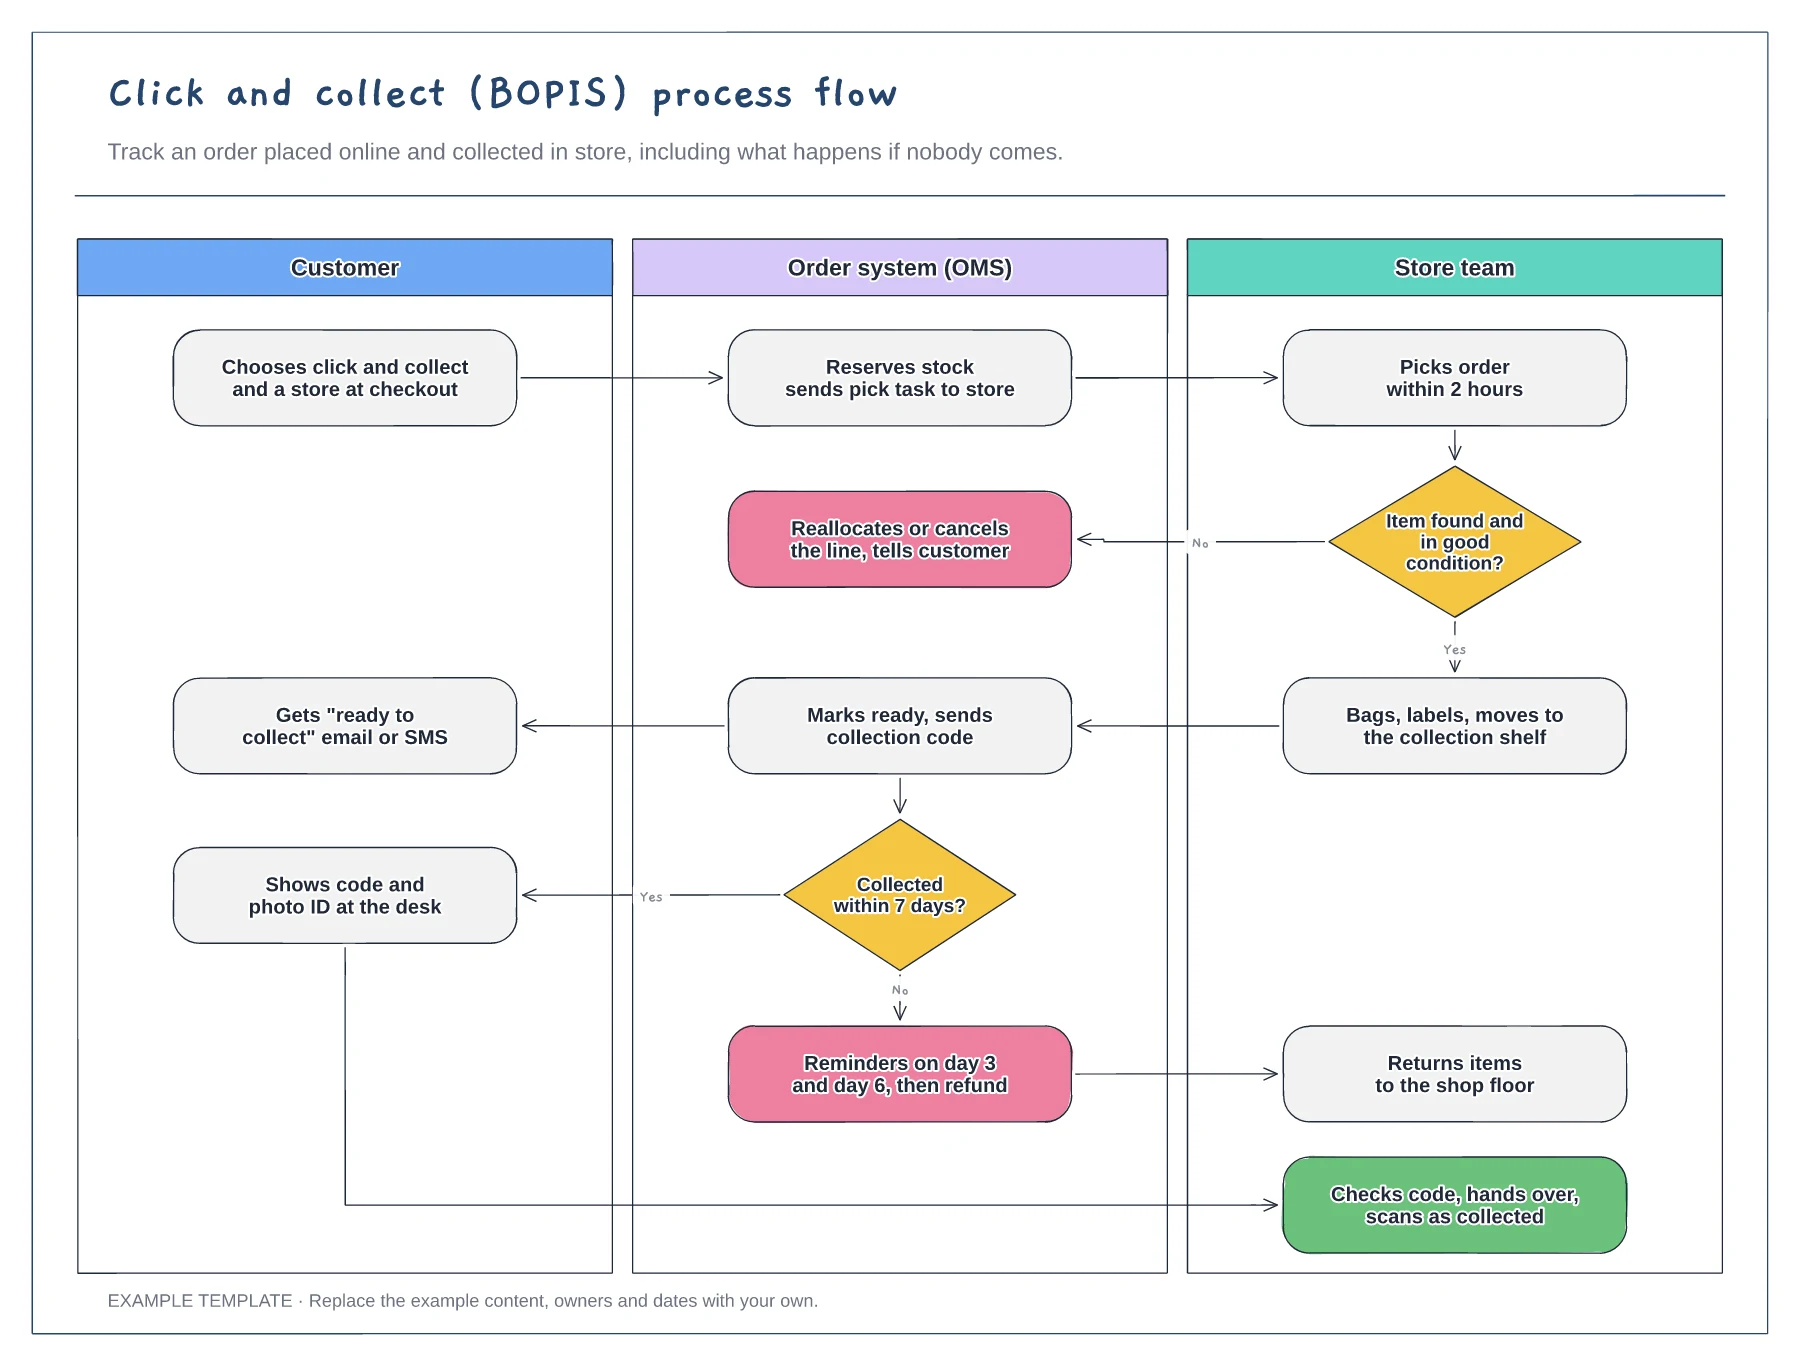
Customer, order system and store lanes · Item-not-found and not-collected branches · Collection checks at the desk
Preview and use template →
Return request and policy check · Approval or a clear explanation · Receipt, inspection and resolution
Preview and use template →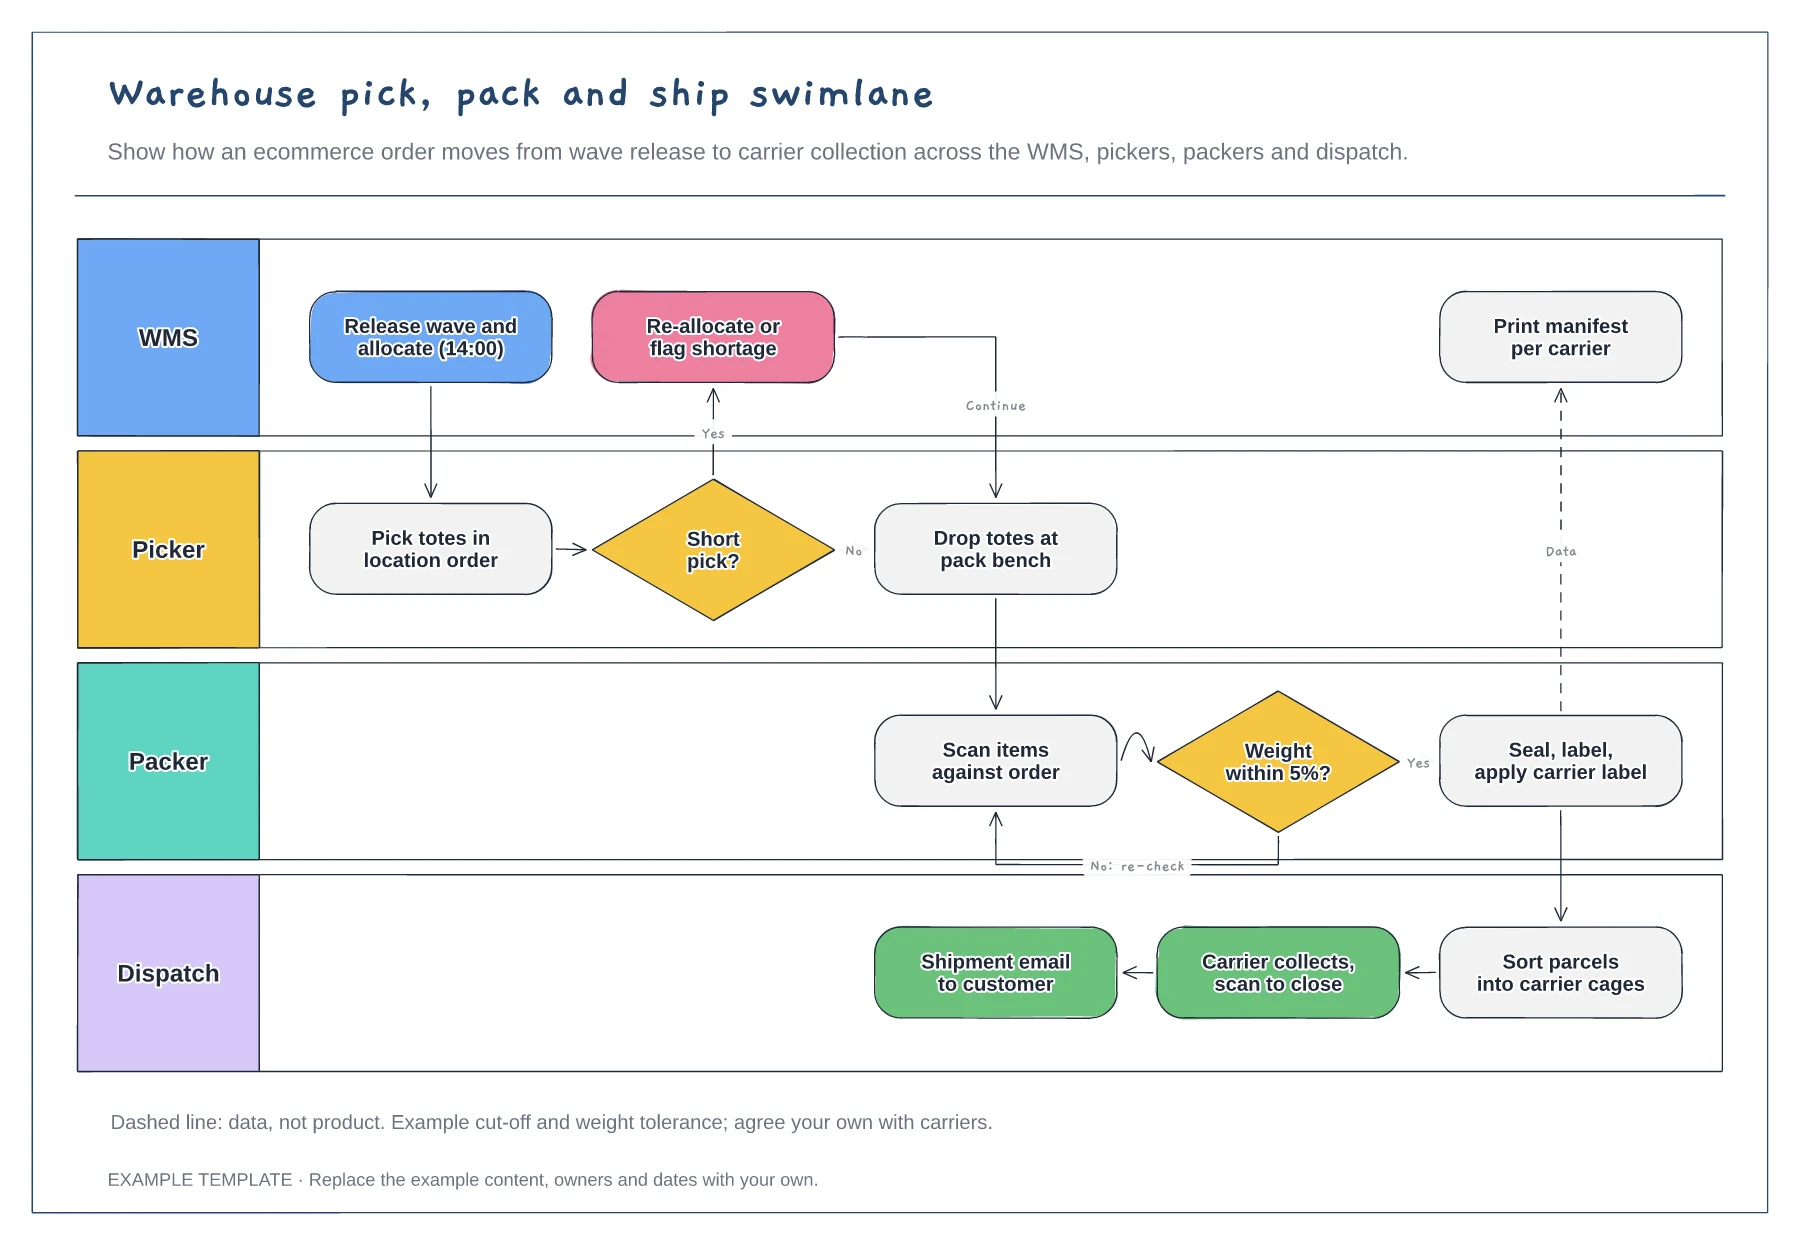
Lanes for WMS, picker, packer and dispatch · Short-pick and weight-check decisions · Data handoff for the carrier manifest
Preview and use template →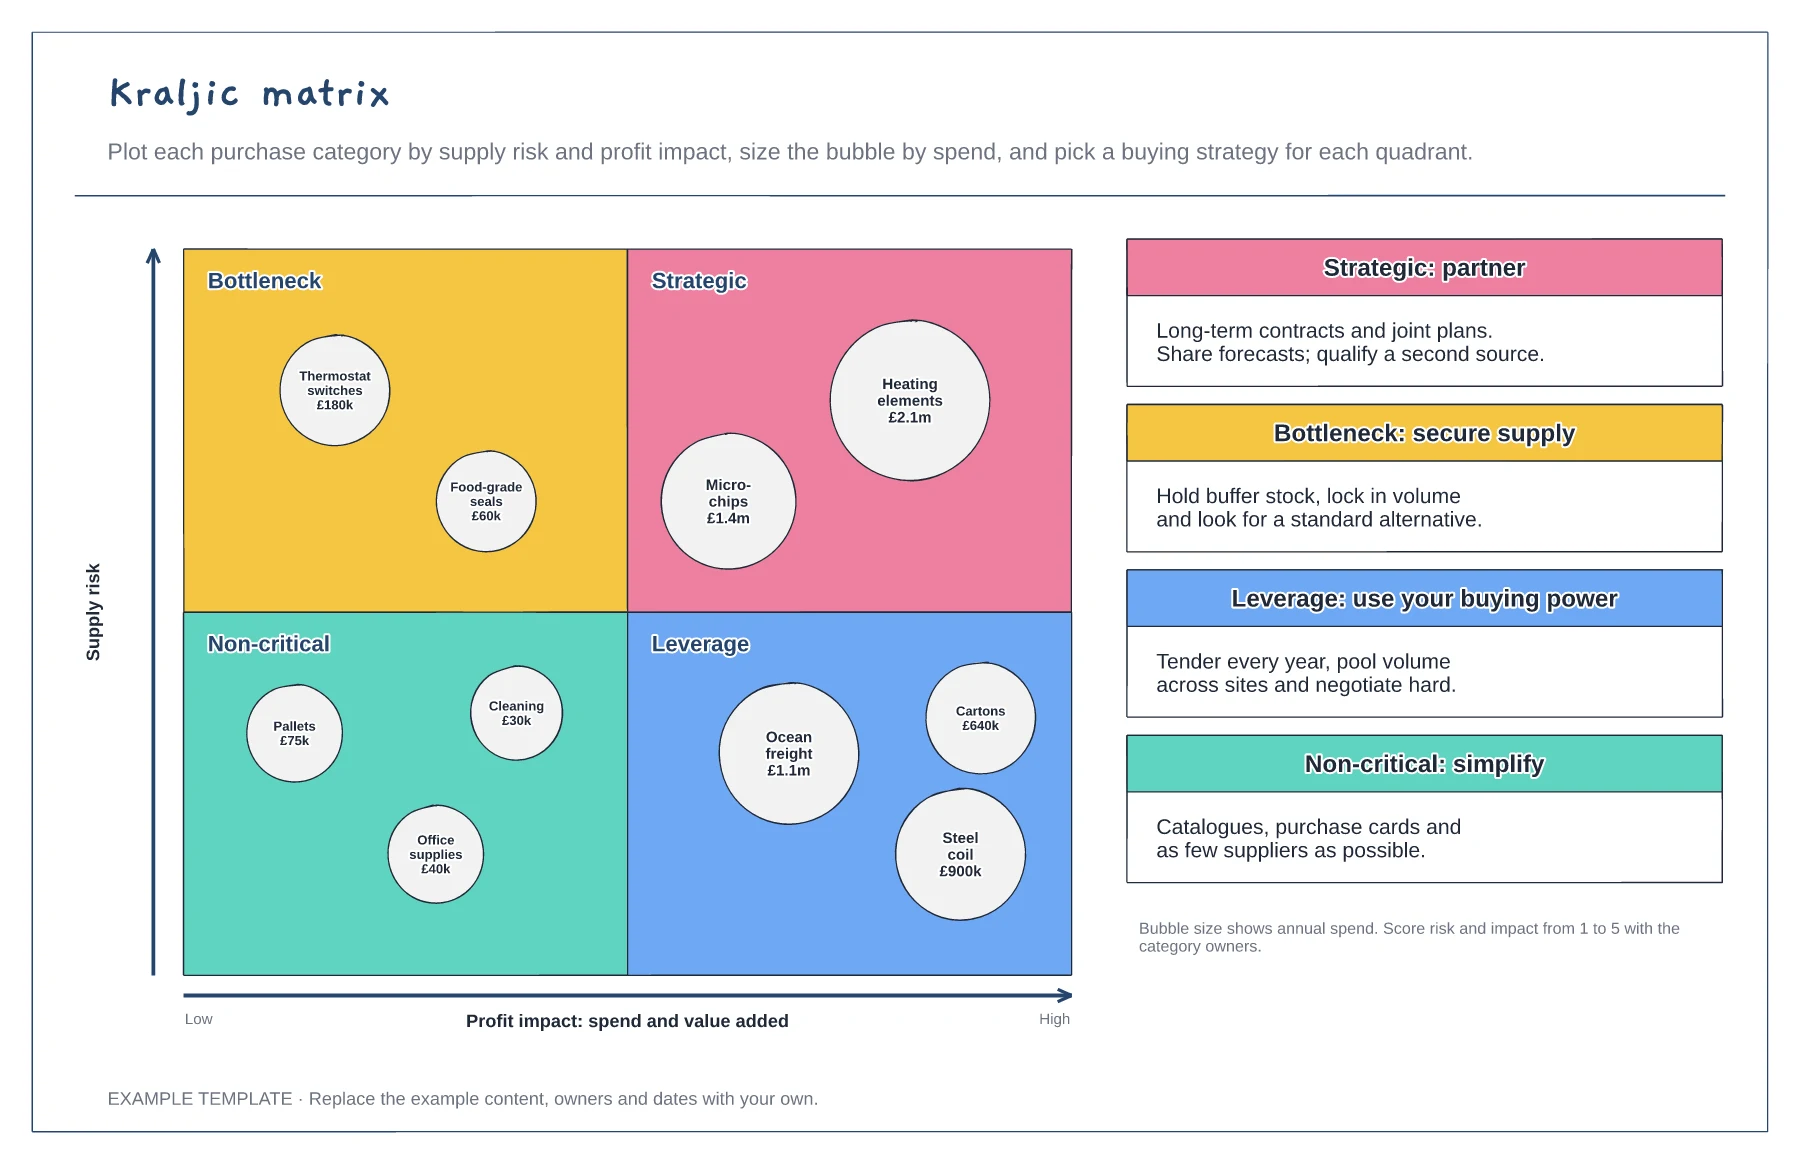
Four quadrants: strategic, bottleneck, leverage, non-critical · Categories as bubbles sized by annual spend · A buying strategy for each quadrant
Preview and use template →