Nonprofit
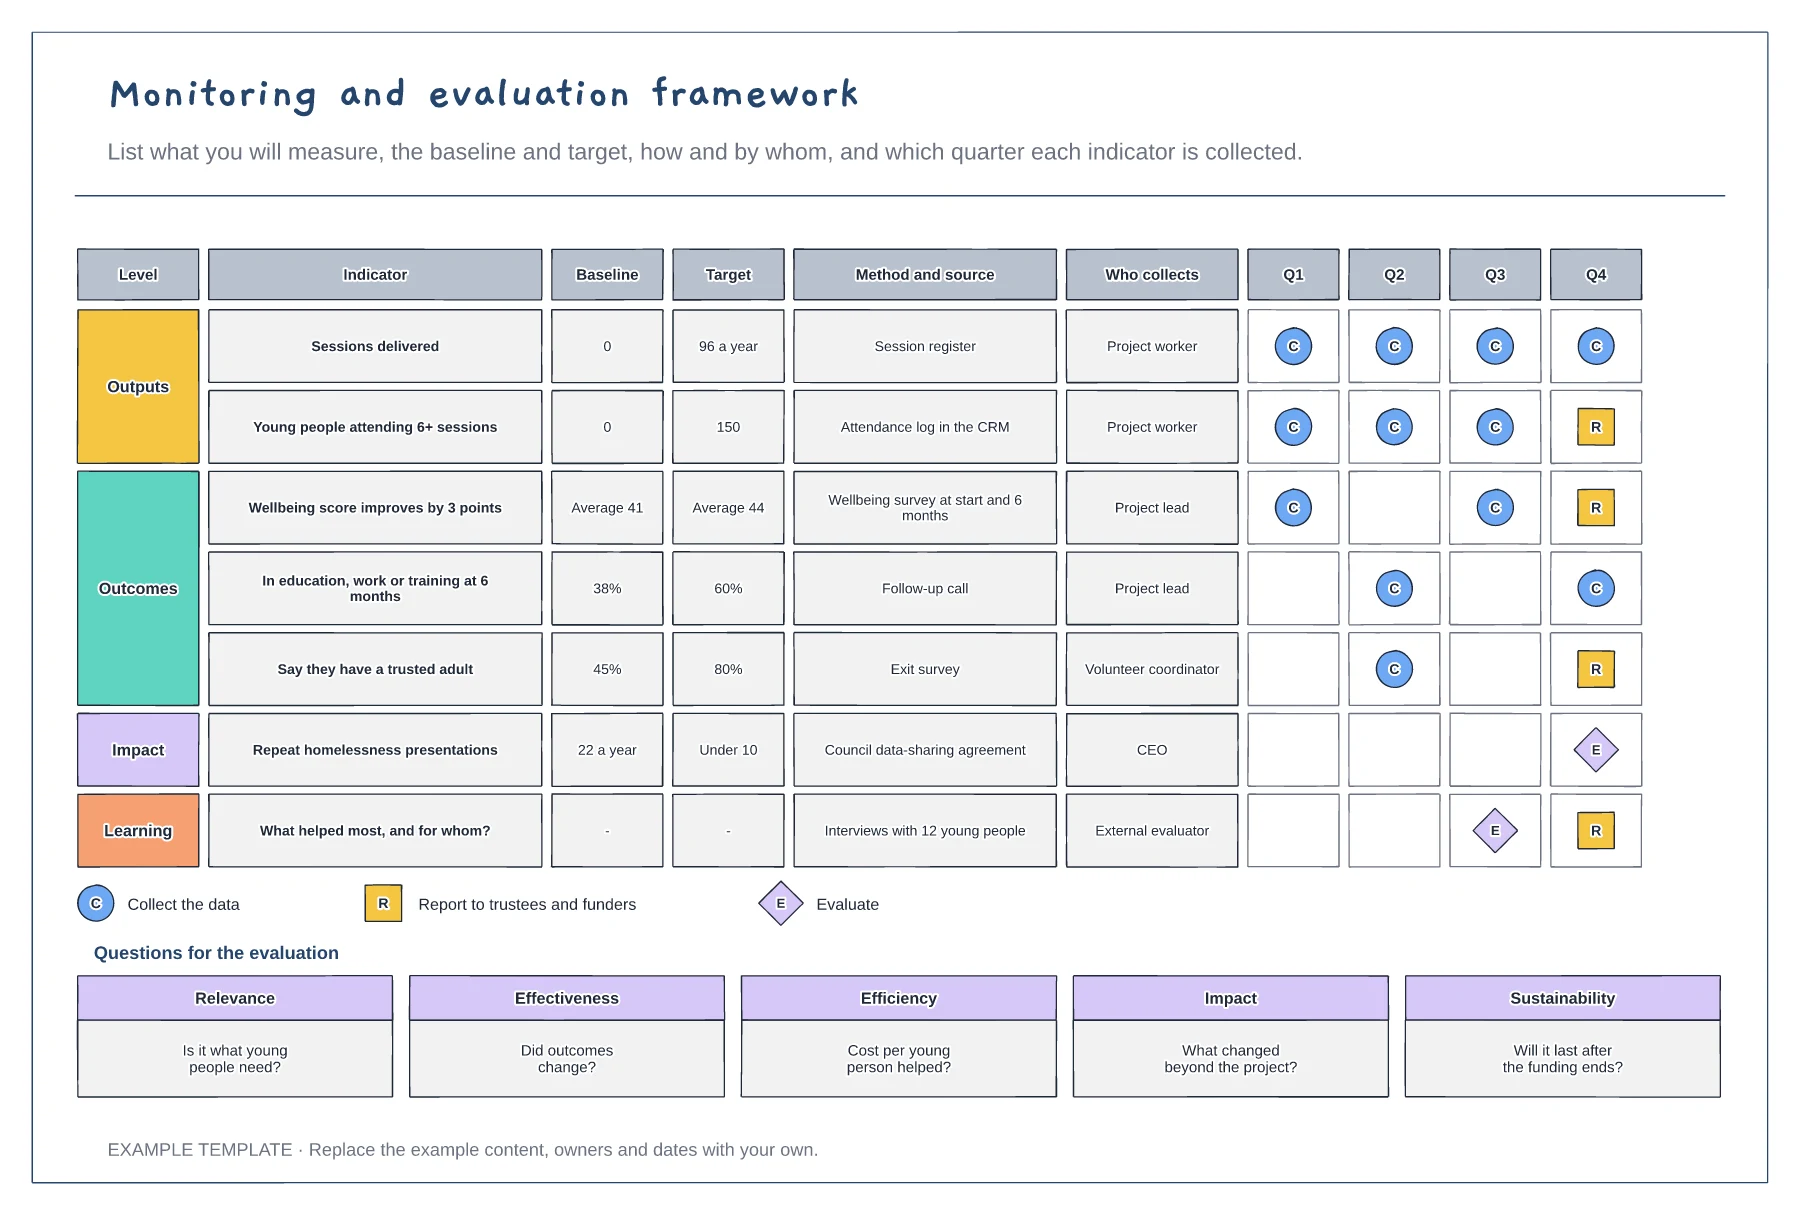
Monitoring and evaluation framework template
Indicators grouped by outputs, outcomes and impact · Baseline, target, method and owner for each · Quarterly collection, reporting and evaluation symbols
Preview and use template →An impact report dashboard tells supporters what their money and time achieved, on a single page. This example opens with headline numbers, then shows people supported over five years, how each pound was spent, a quote from someone the charity helped, progress bars against this year's targets and a simple map of where the charity works.
No account needed · Opens as your own editable page
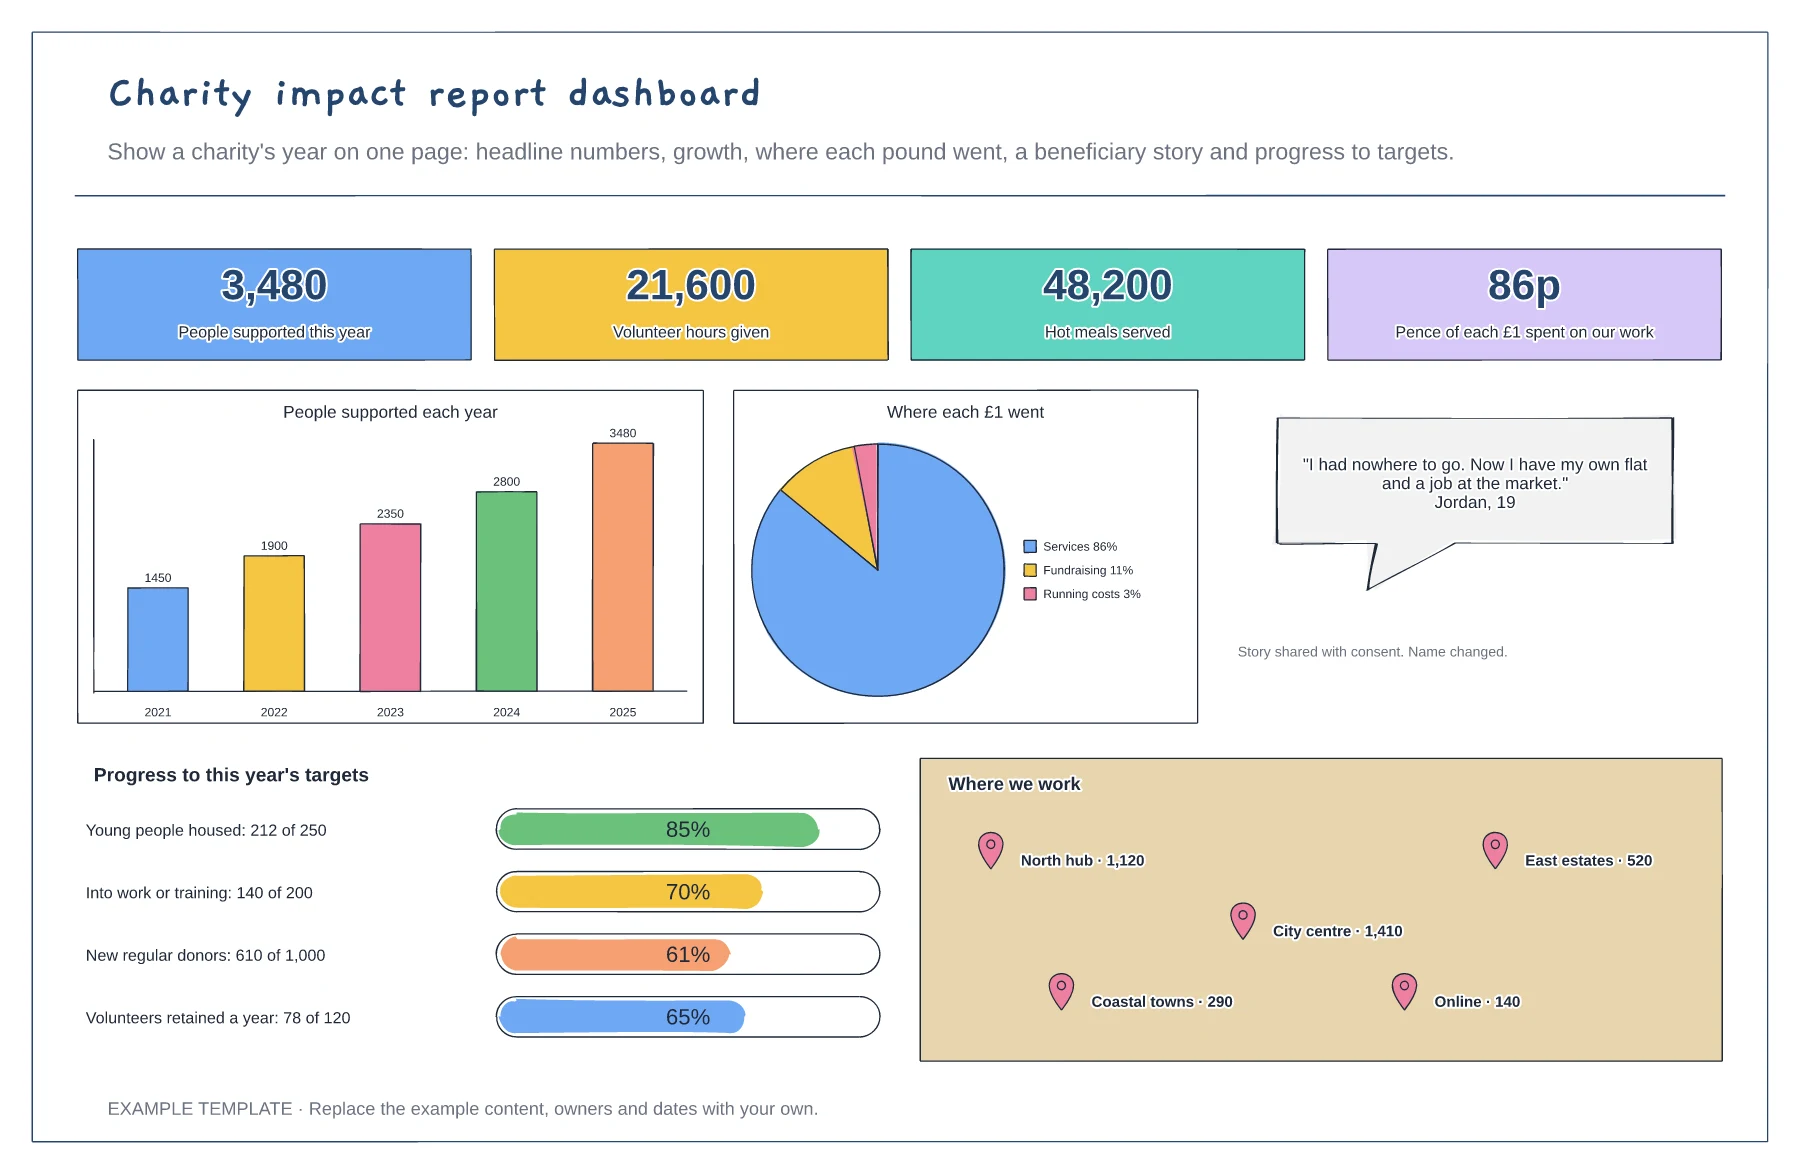
Pick the figures supporters care most about, such as people helped and volunteer hours, and check each one is accurate.
Add a trend and progress against targets, so readers see direction as well as size.
Include one short quote or story, shared with consent, that brings the numbers to life.
Edit the four headline numbers, the progress bars and the where we work list, then update the two charts. Replace the story card with a quote you have consent to share.
No. Open the template and edit it in your browser. Your work saves on this device. An account is optional if you want to sync your workspace.
Yes. Use Export in the editor to save a PNG, SVG or PDF, or download an editable .epicdraw backup.
Indicators grouped by outputs, outcomes and impact · Baseline, target, method and owner for each · Quarterly collection, reporting and evaluation symbols
Preview and use template →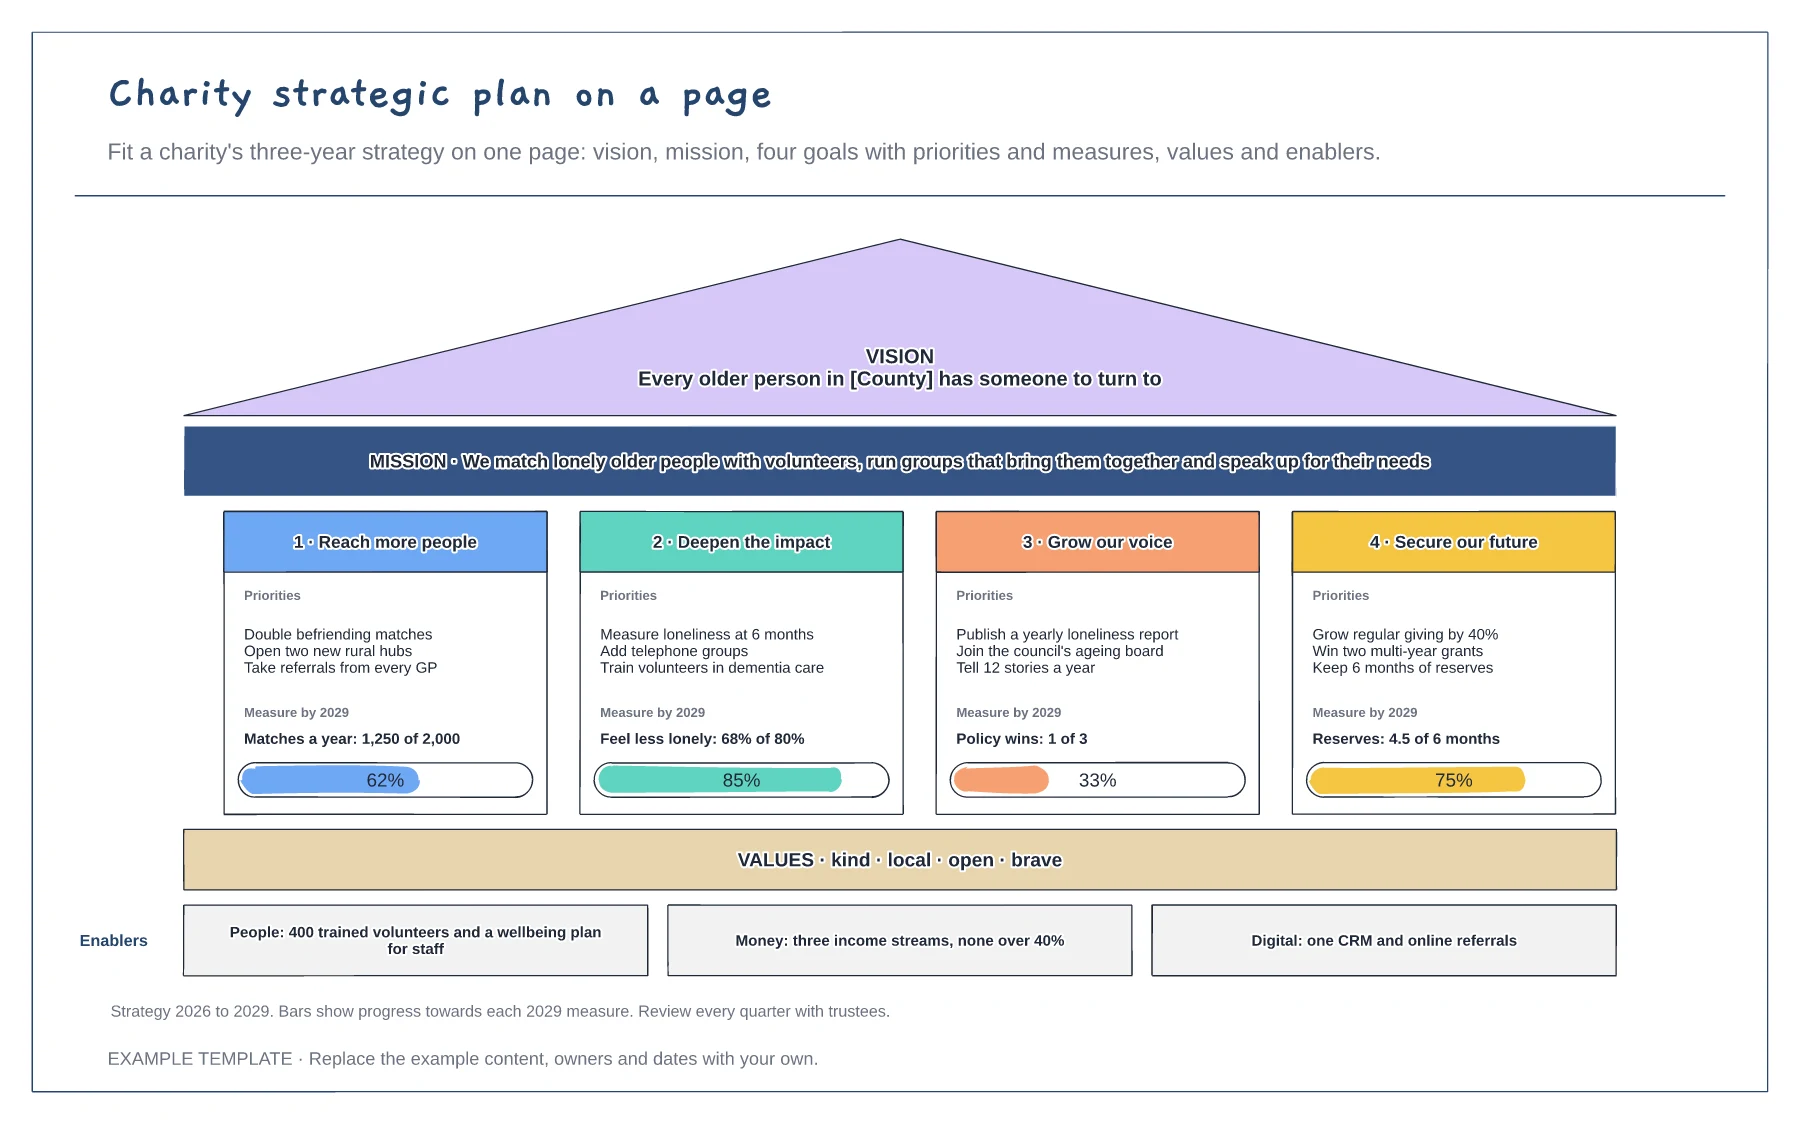
Vision, mission and four goal pillars · Priorities and a progress bar for each goal · Values and enablers as the foundation
Preview and use template →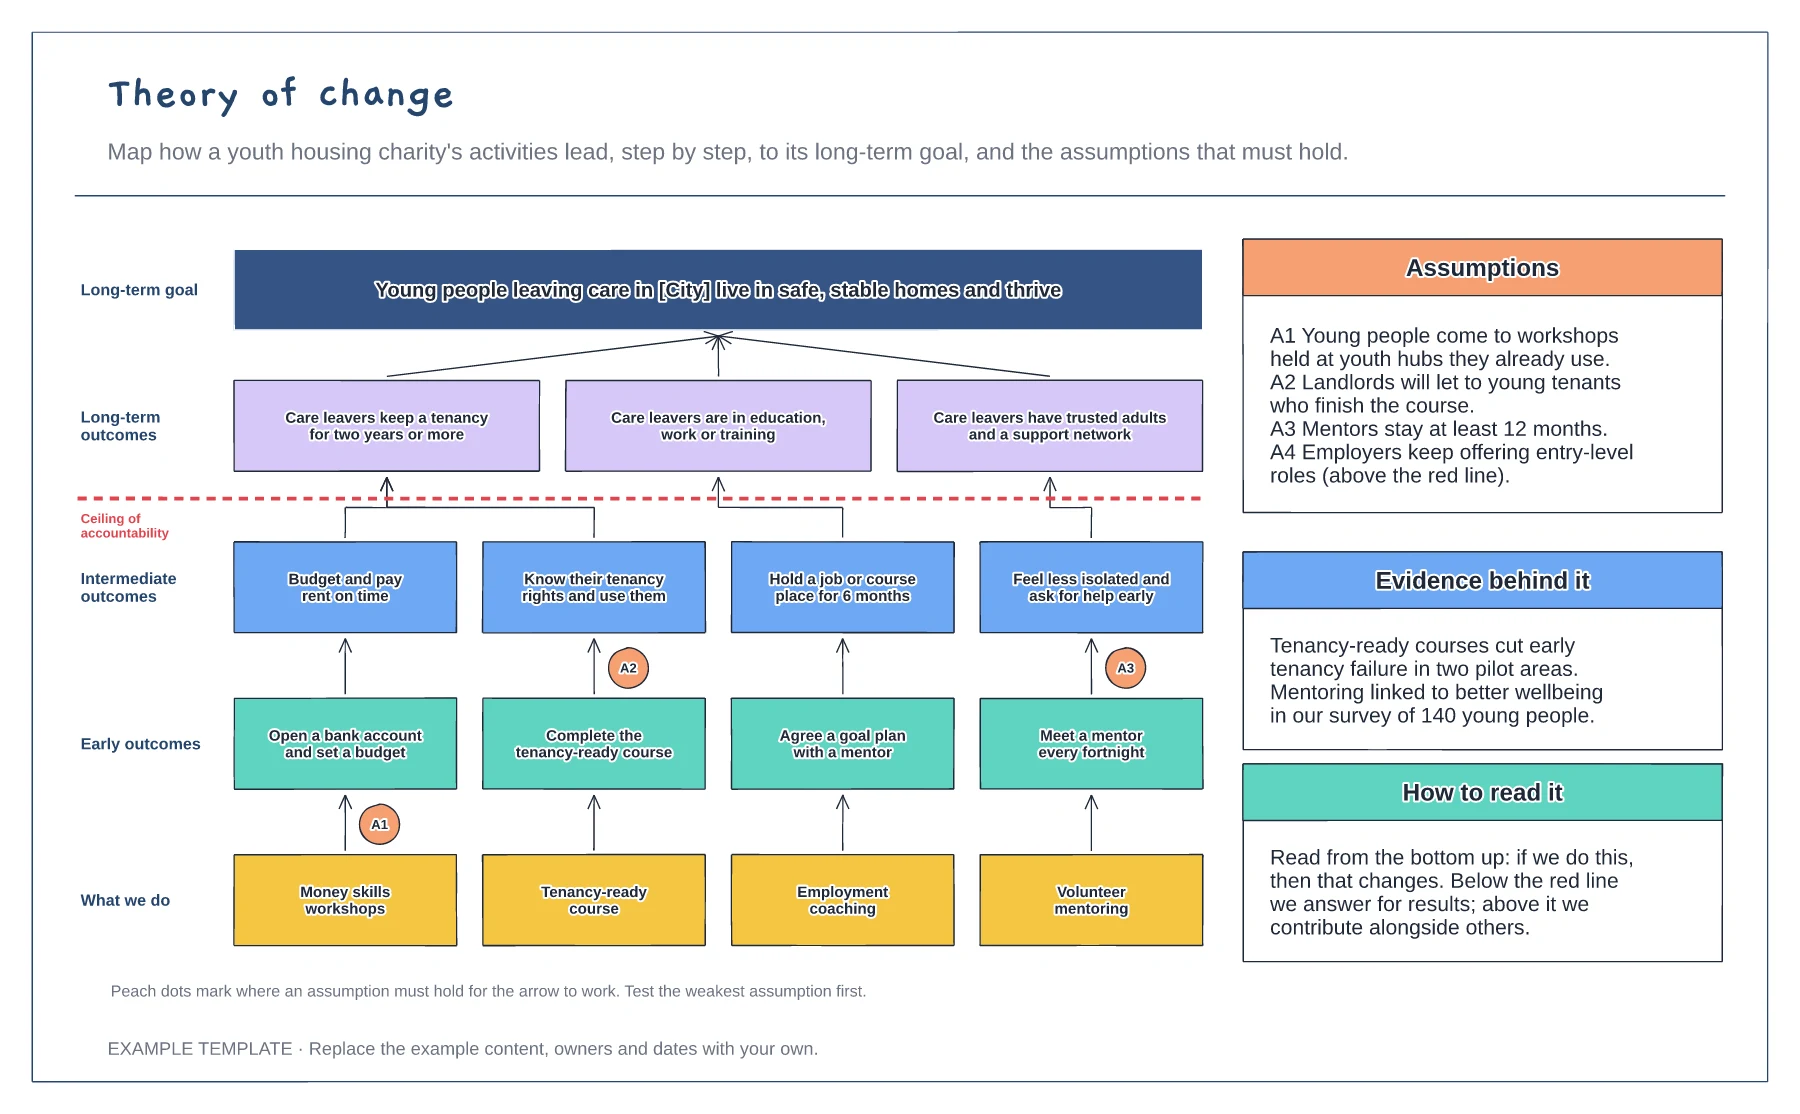
Five layers from activities to the long-term goal · A ceiling of accountability line · Numbered assumptions and the evidence behind them
Preview and use template →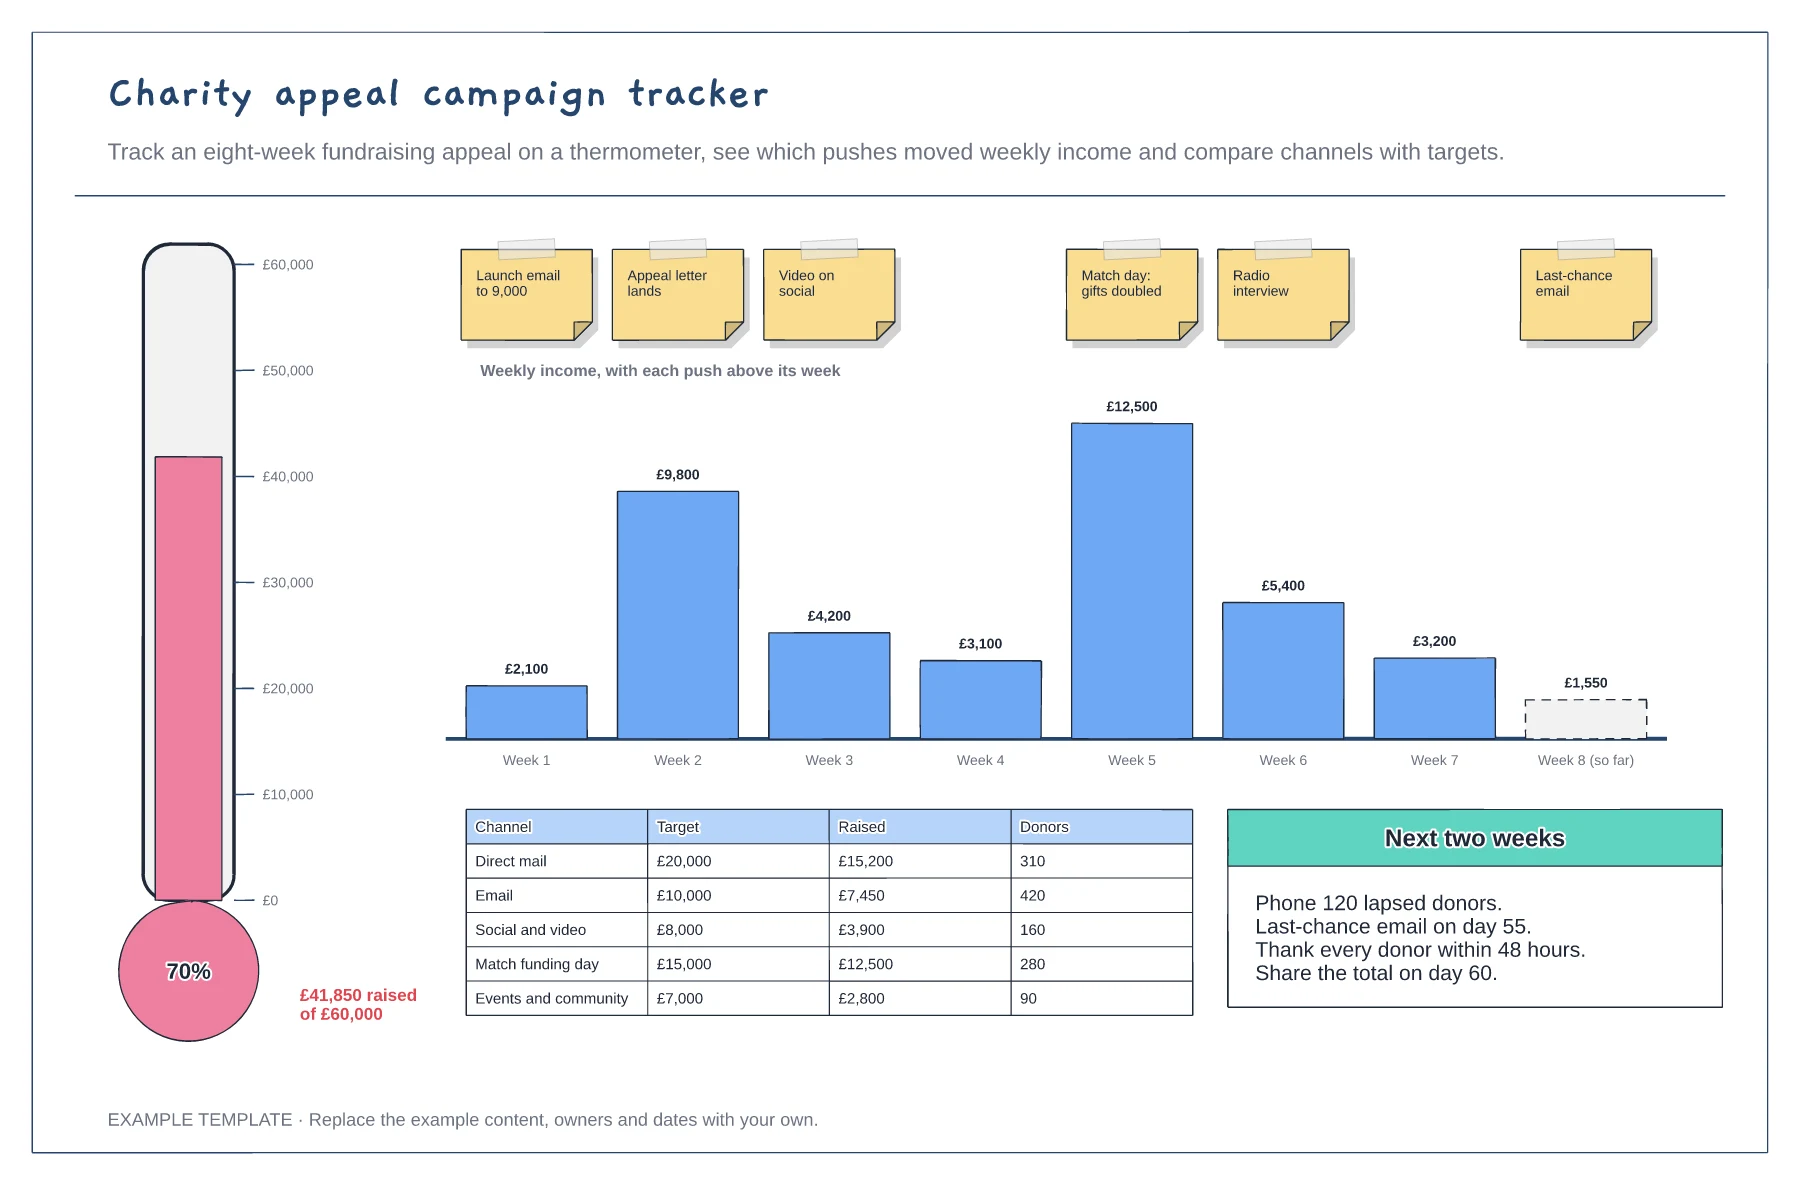
Fundraising thermometer against the target · Weekly income with each push marked · Channel results and next actions
Preview and use template →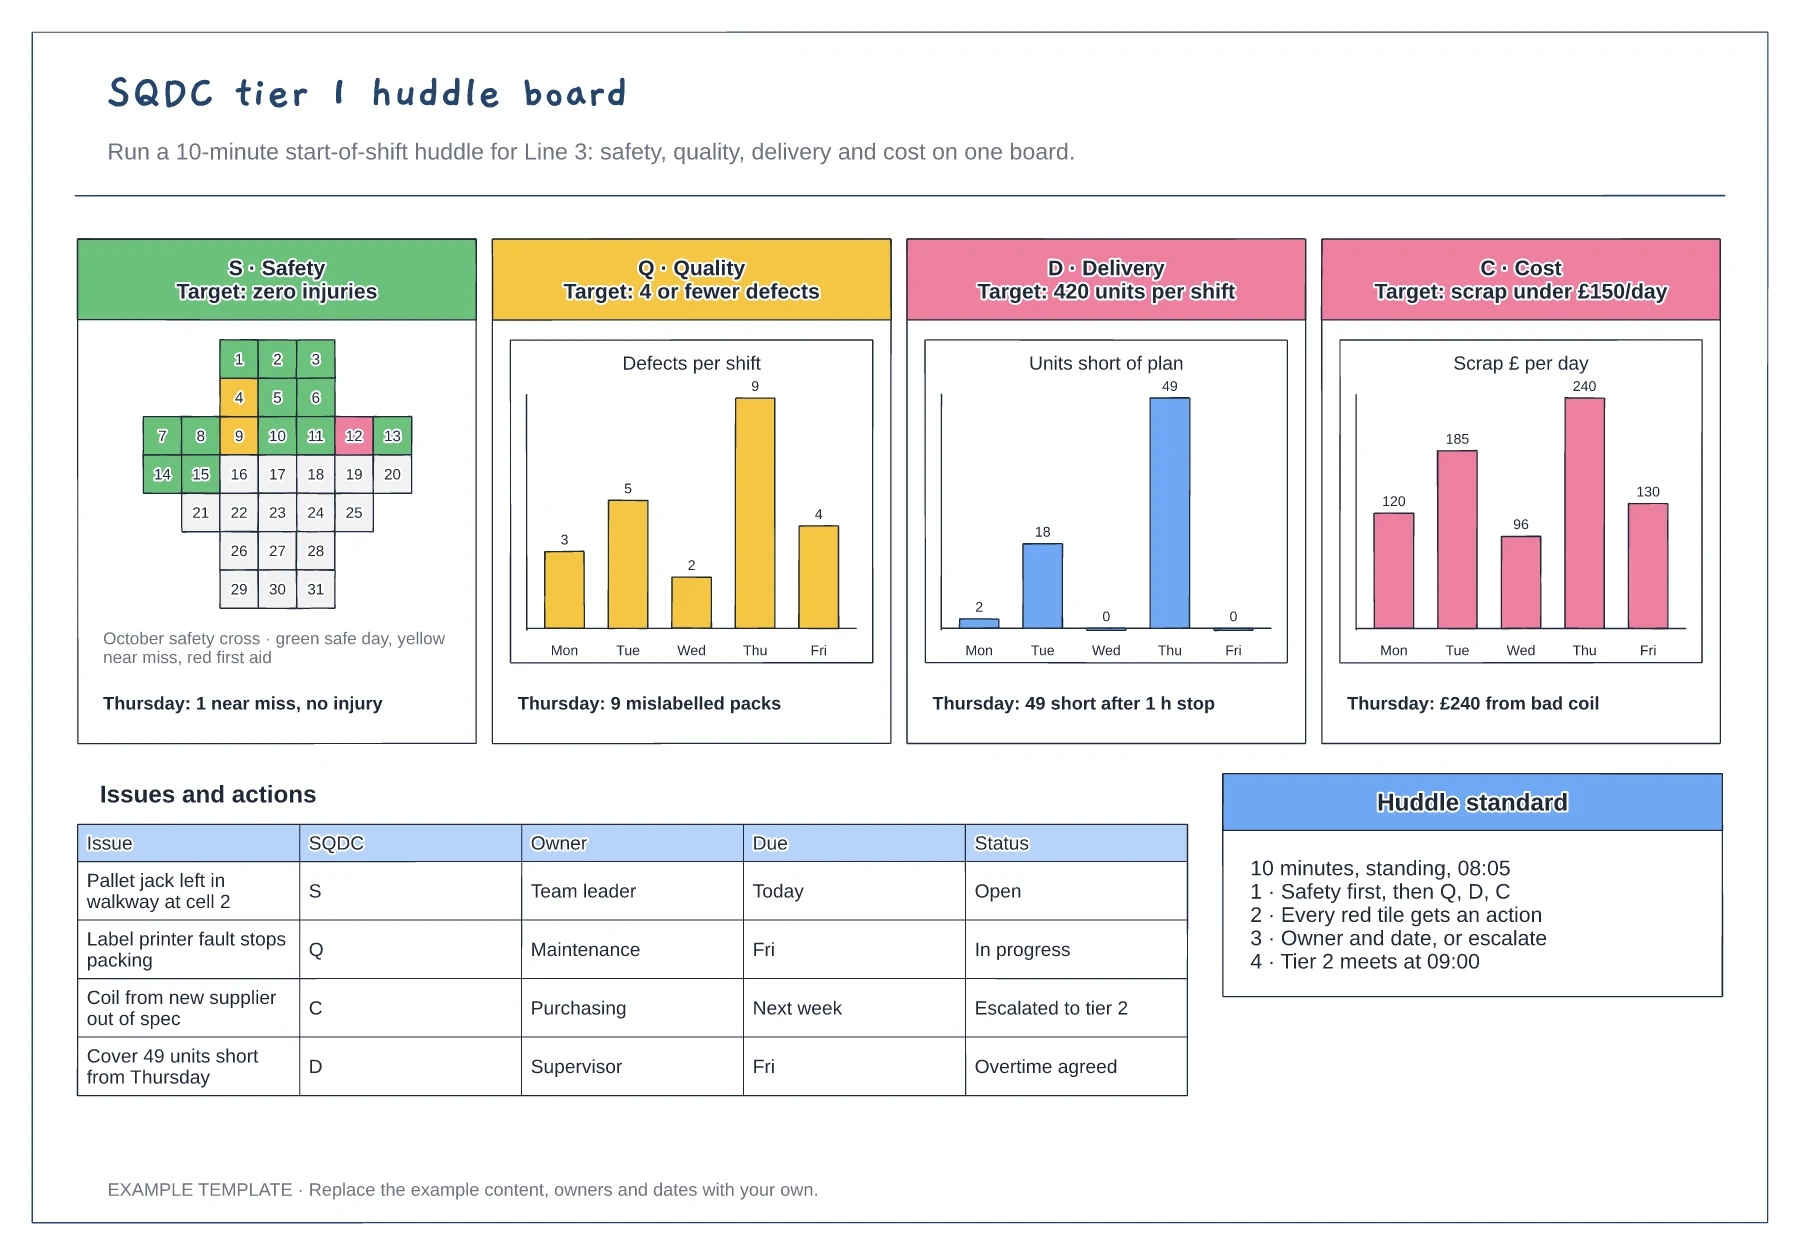
Safety cross for the month · Quality, delivery and cost charts by day · Issues and actions table with escalation
Preview and use template →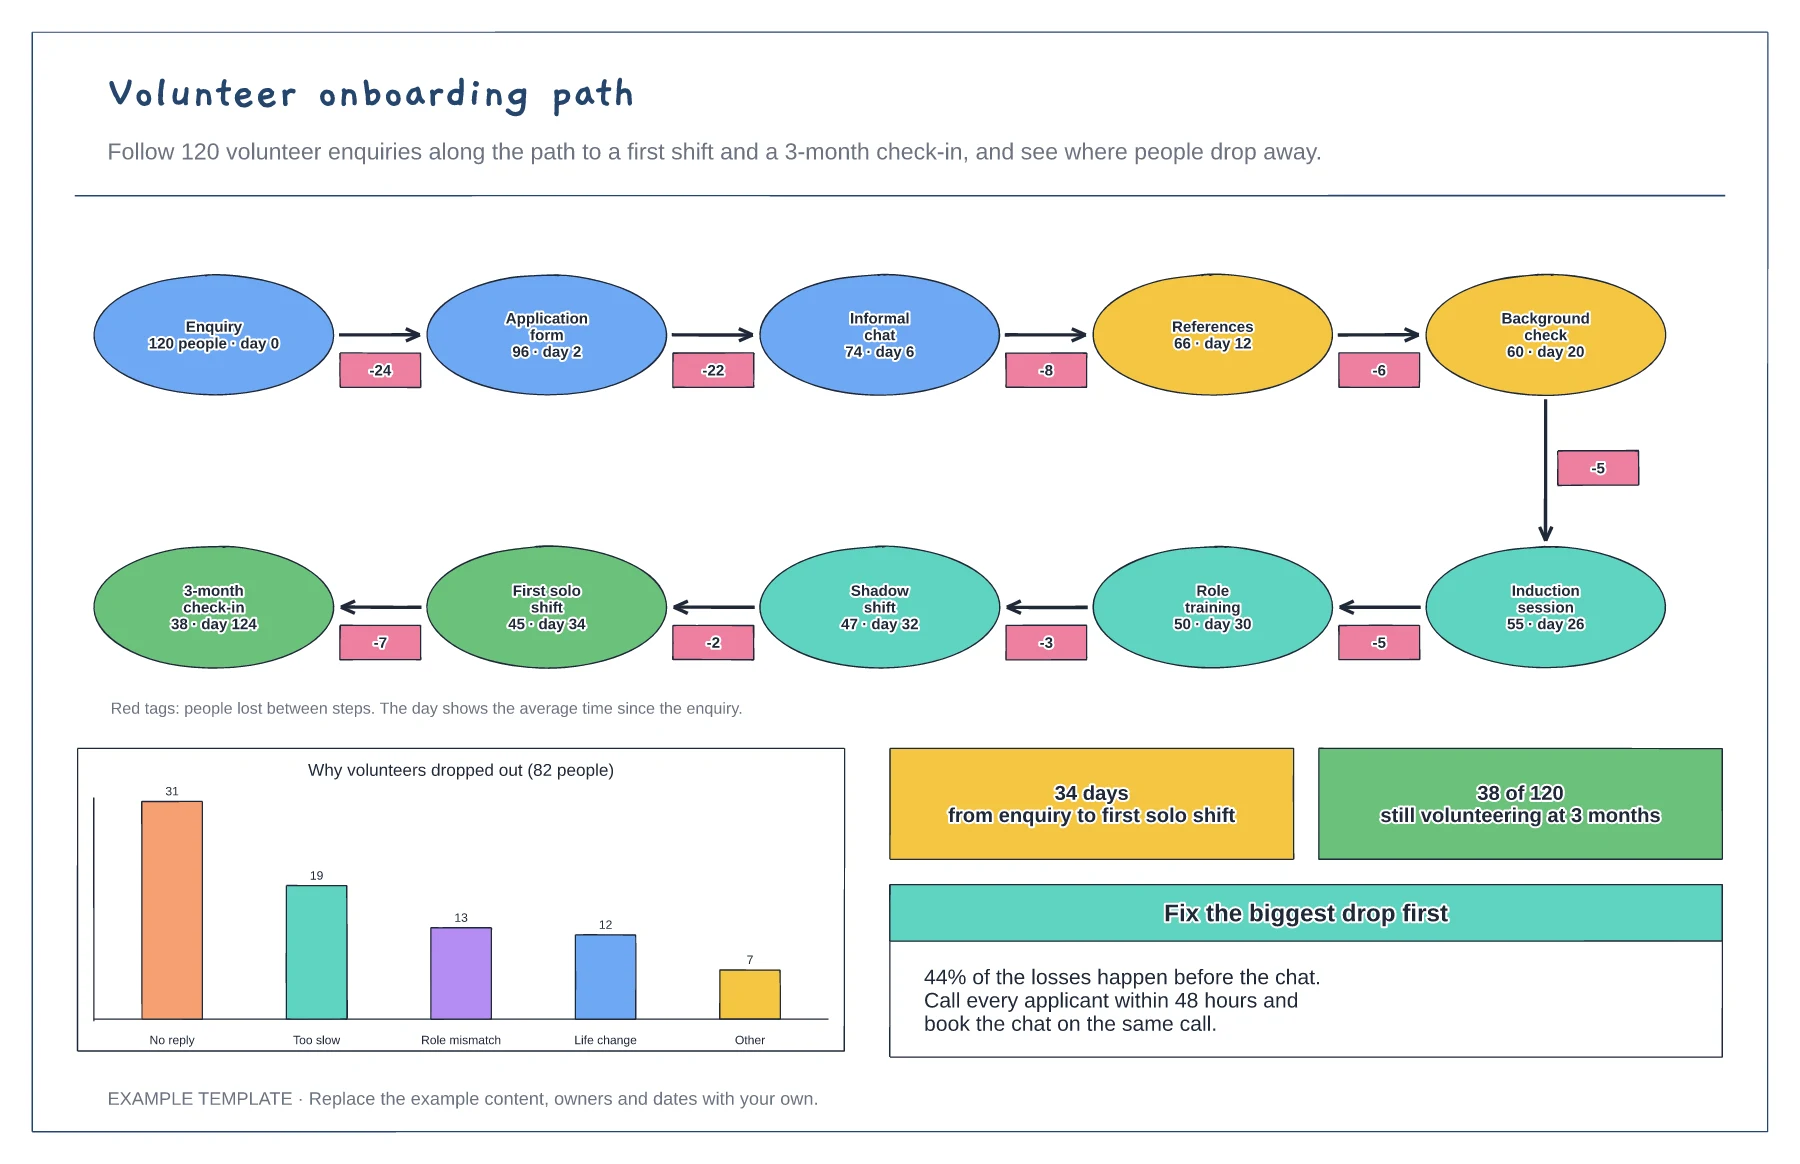
Ten-step path with people remaining and days taken · Drop-off tags between steps · Reasons for dropping out and the fix to try first
Preview and use template →