Agriculture and food
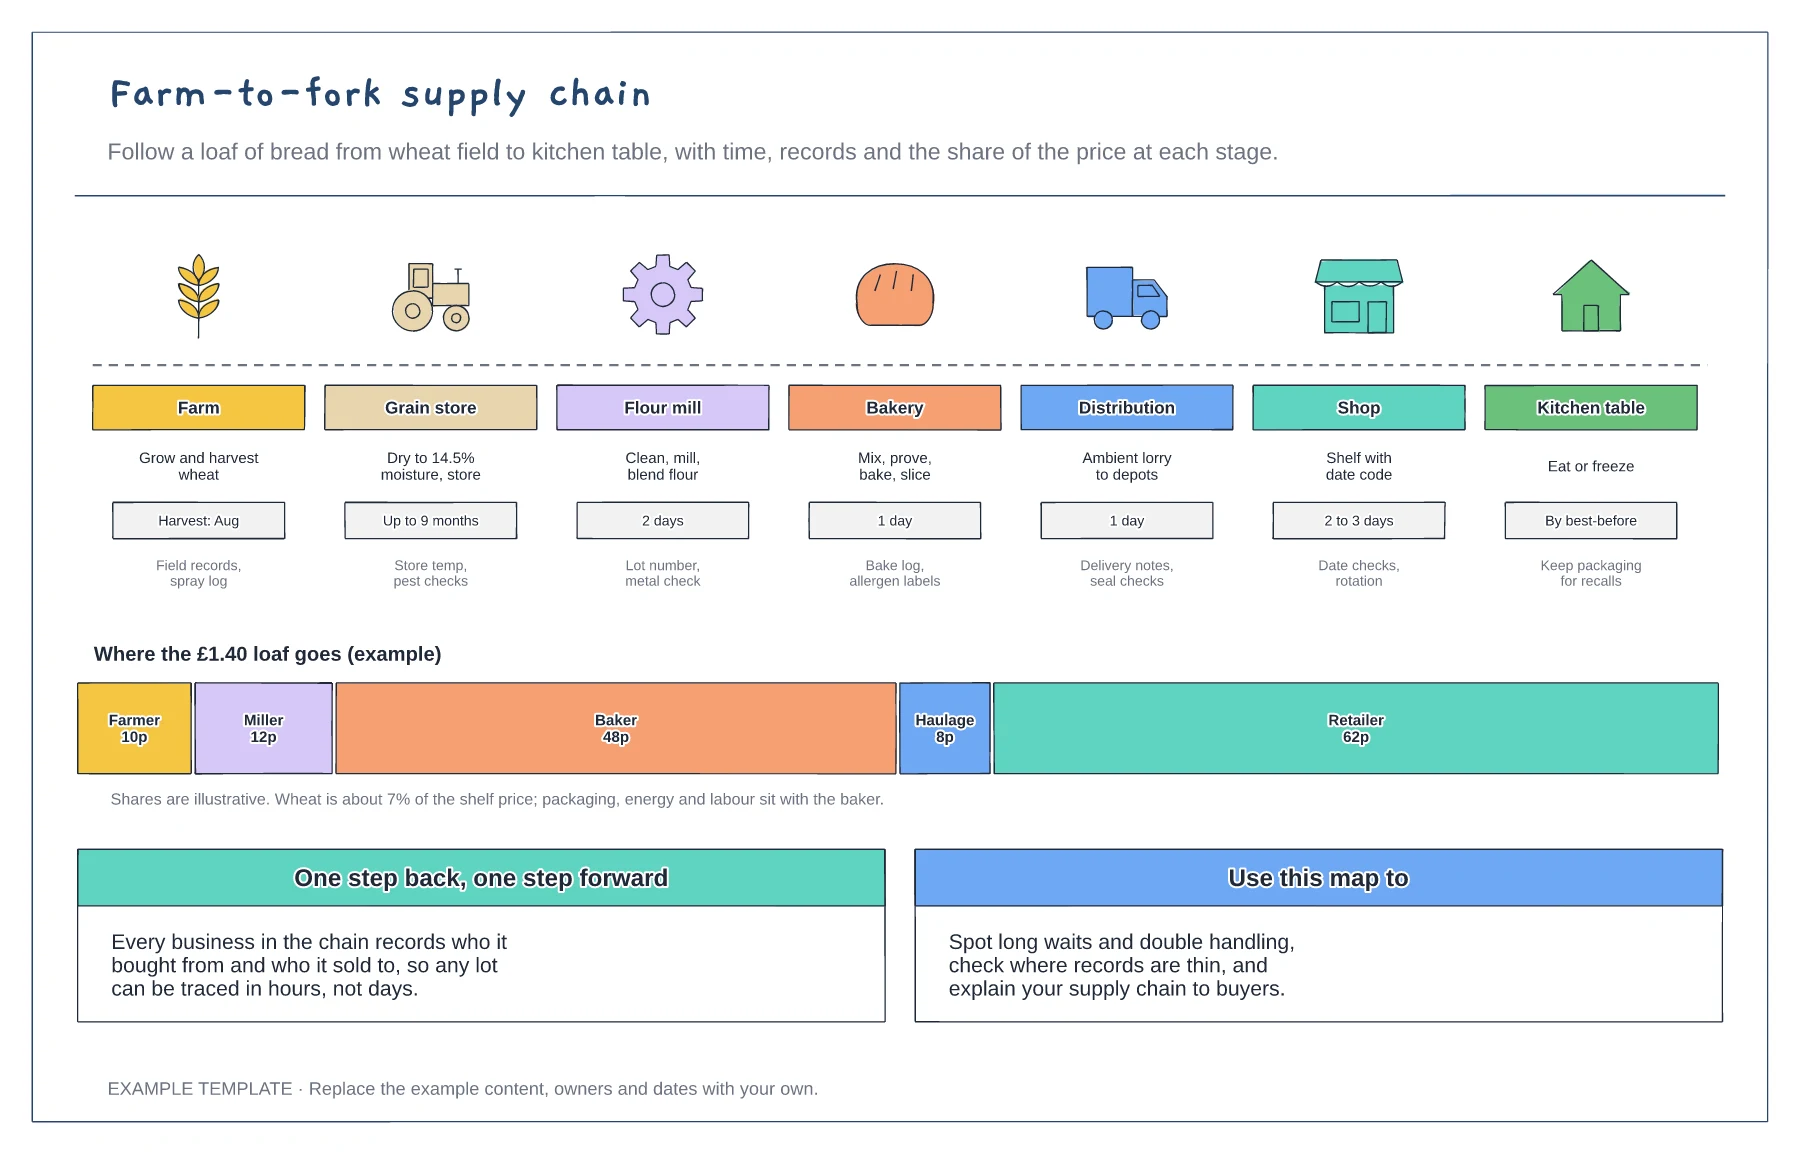
Farm-to-fork supply chain template
Seven stages from field to kitchen table · Time and traceability records at each stage · A price bar showing who earns what
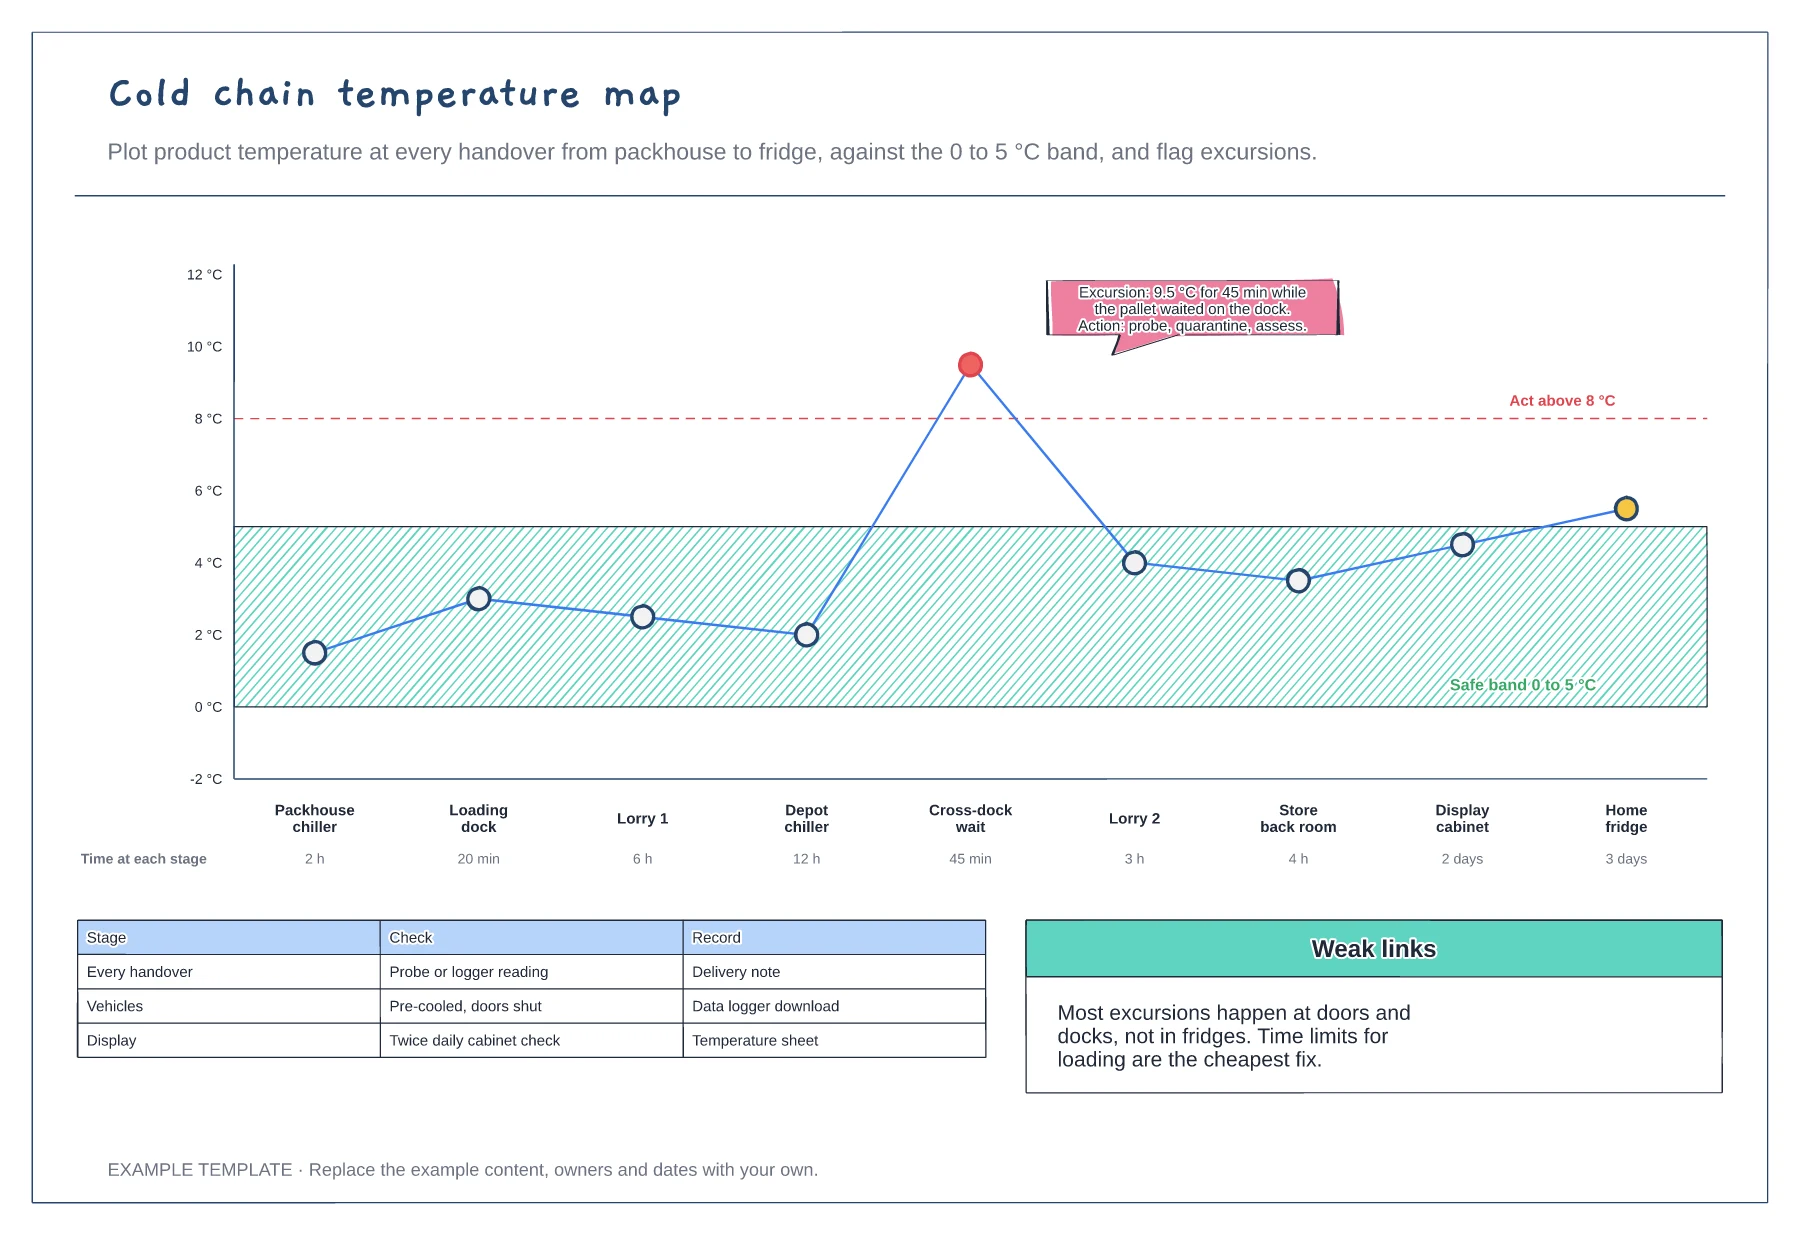
Preview and use template →A cold chain temperature map shows where chilled food warms up on its way to the customer. This example plots a temperature trace through nine stages, from the packhouse chiller to the home fridge, against a 0 to 5 °C safe band and an 8 °C action line, flags a 45-minute excursion on a cross-dock, and lists the checks and records at each handover.
This is a planning example, not food-safety advice or a HACCP plan. Follow your local food-safety law and an approved HACCP plan.
No account needed · Opens as your own editable page
Write down every place the product stops or changes hands, including docks and waits, not just the fridges.
Use logger downloads or probe readings for each stage and draw them against your safe band and action limit.
Flag any reading outside the band, record what was done, and set time limits or checks where excursions keep happening.
Move each point on the line to the reading at that handover and edit the time spent at each stage. Add an excursion note wherever the line rises above the safe band.
No. Open the template and edit it in your browser. Your work saves on this device. An account is optional if you want to sync your workspace.
Yes. Use Export in the editor to save a PNG, SVG or PDF, or download an editable .epicdraw backup.
Seven stages from field to kitchen table · Time and traceability records at each stage · A price bar showing who earns what
Preview and use template →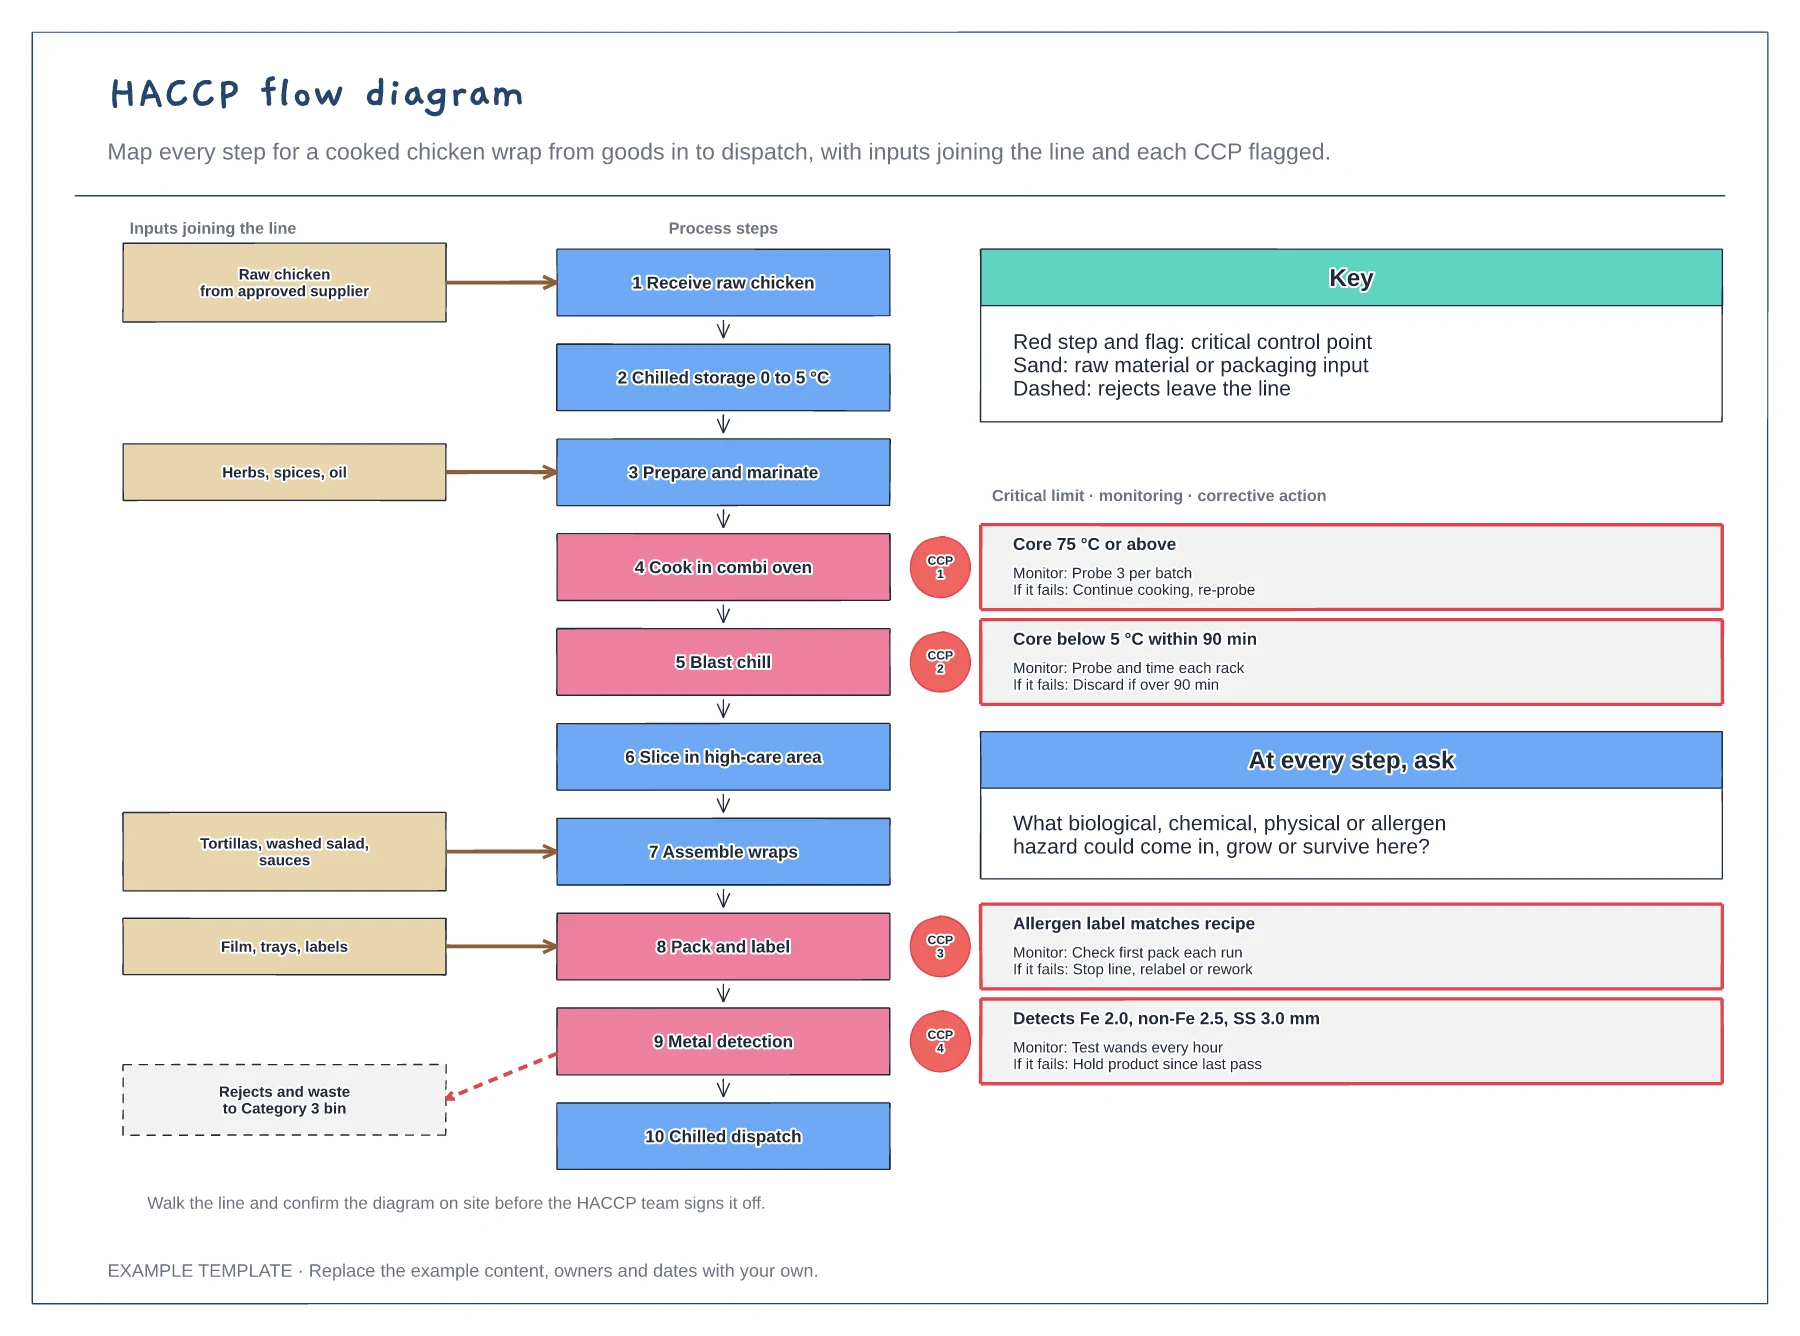
Numbered process steps from goods in to dispatch · Inputs, packaging and rejects at the right step · CCP flags with limits, monitoring and actions
Preview and use template →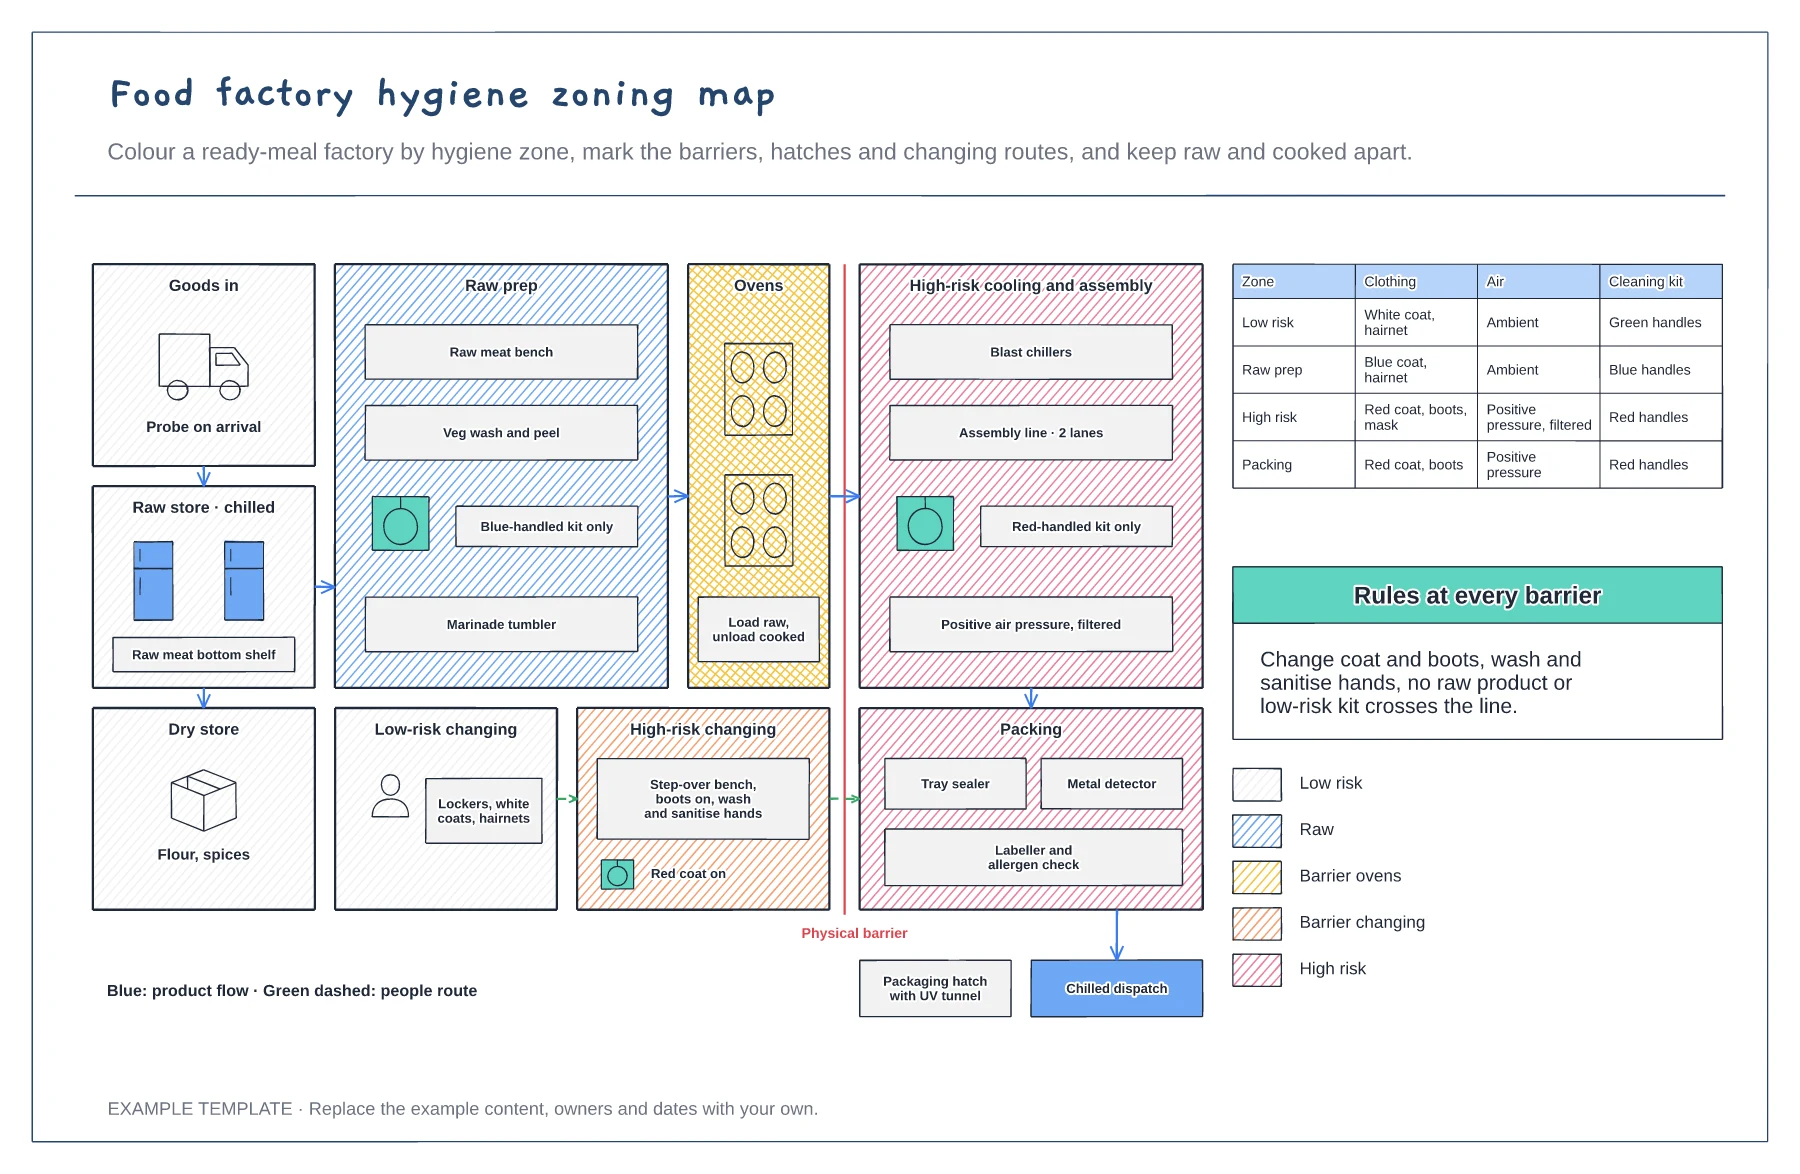
Zones shaded by hygiene risk · Barrier ovens, changing rooms and hatches · Clothing, air and cleaning rules per zone
Preview and use template →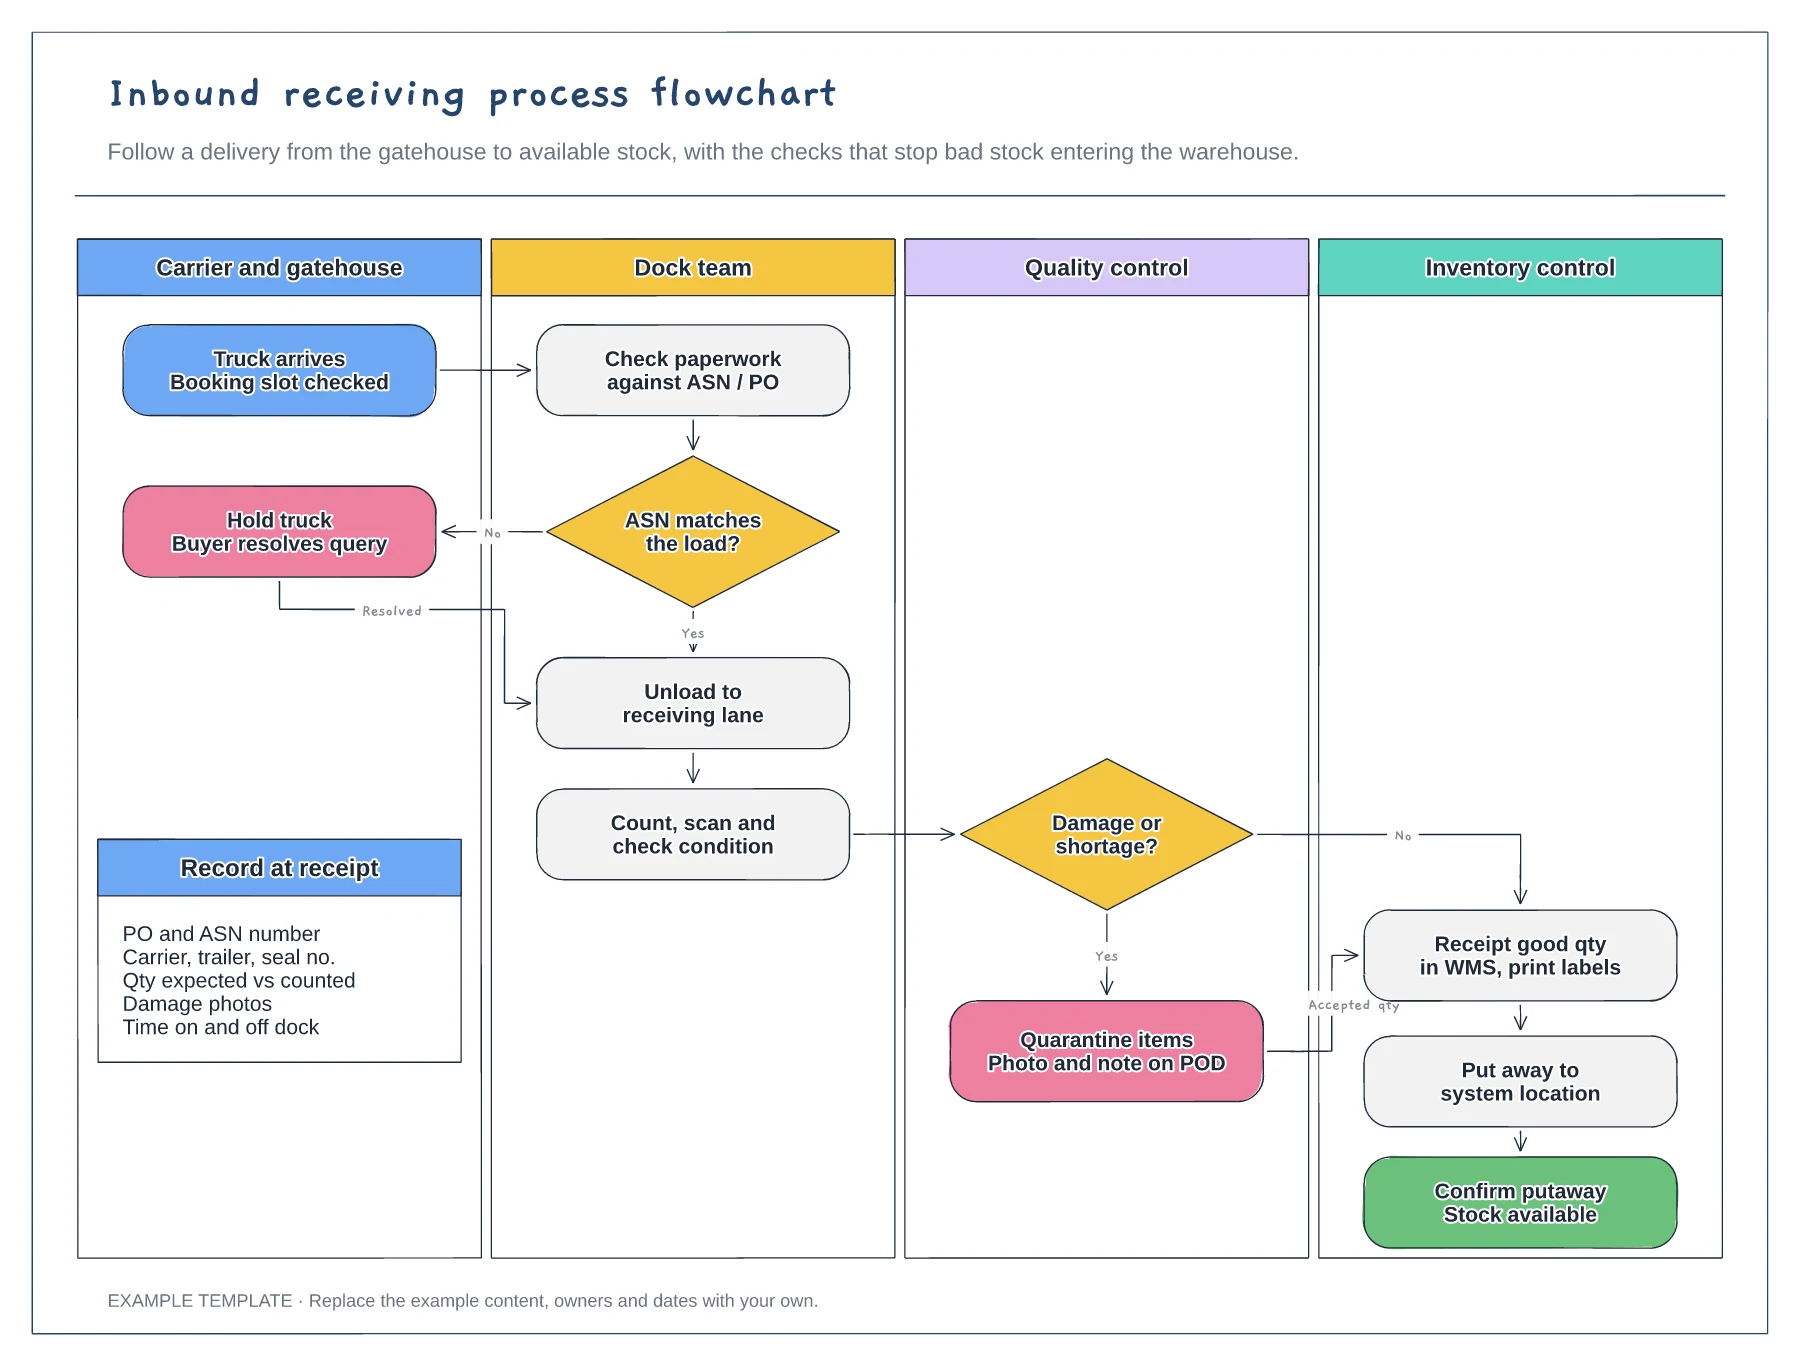
Four swimlanes from carrier to inventory · ASN and damage decisions with Yes and No paths · Data to record at receipt
Preview and use template →
An example warehouse layout · Numbered picking stops and route arrows · Space to discuss movement and changes
Preview and use template →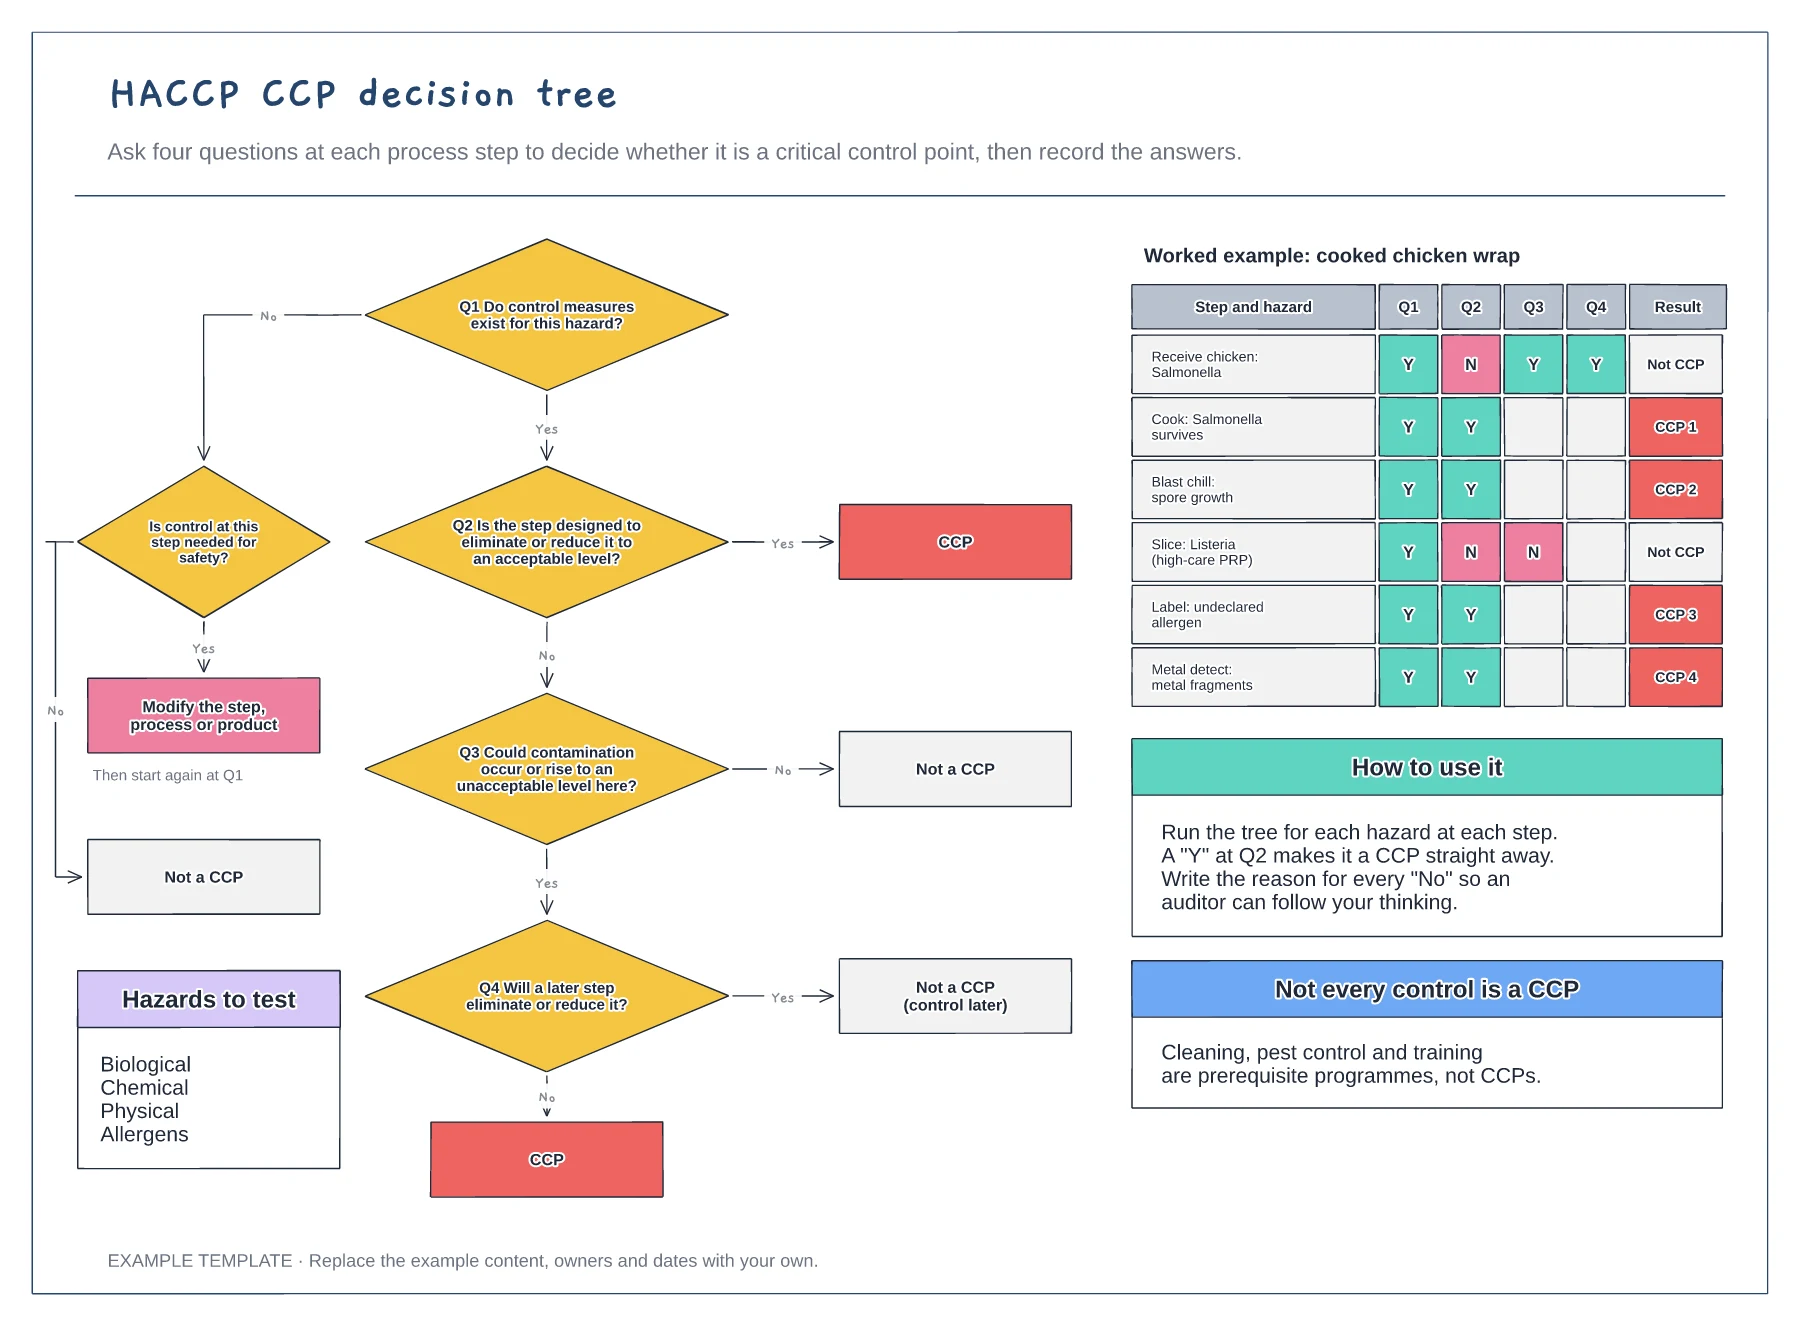
Four questions with yes and no branches · Leaf outcomes: CCP, not a CCP or modify the step · A worked table of steps, hazards and answers
Preview and use template →