Agriculture and food
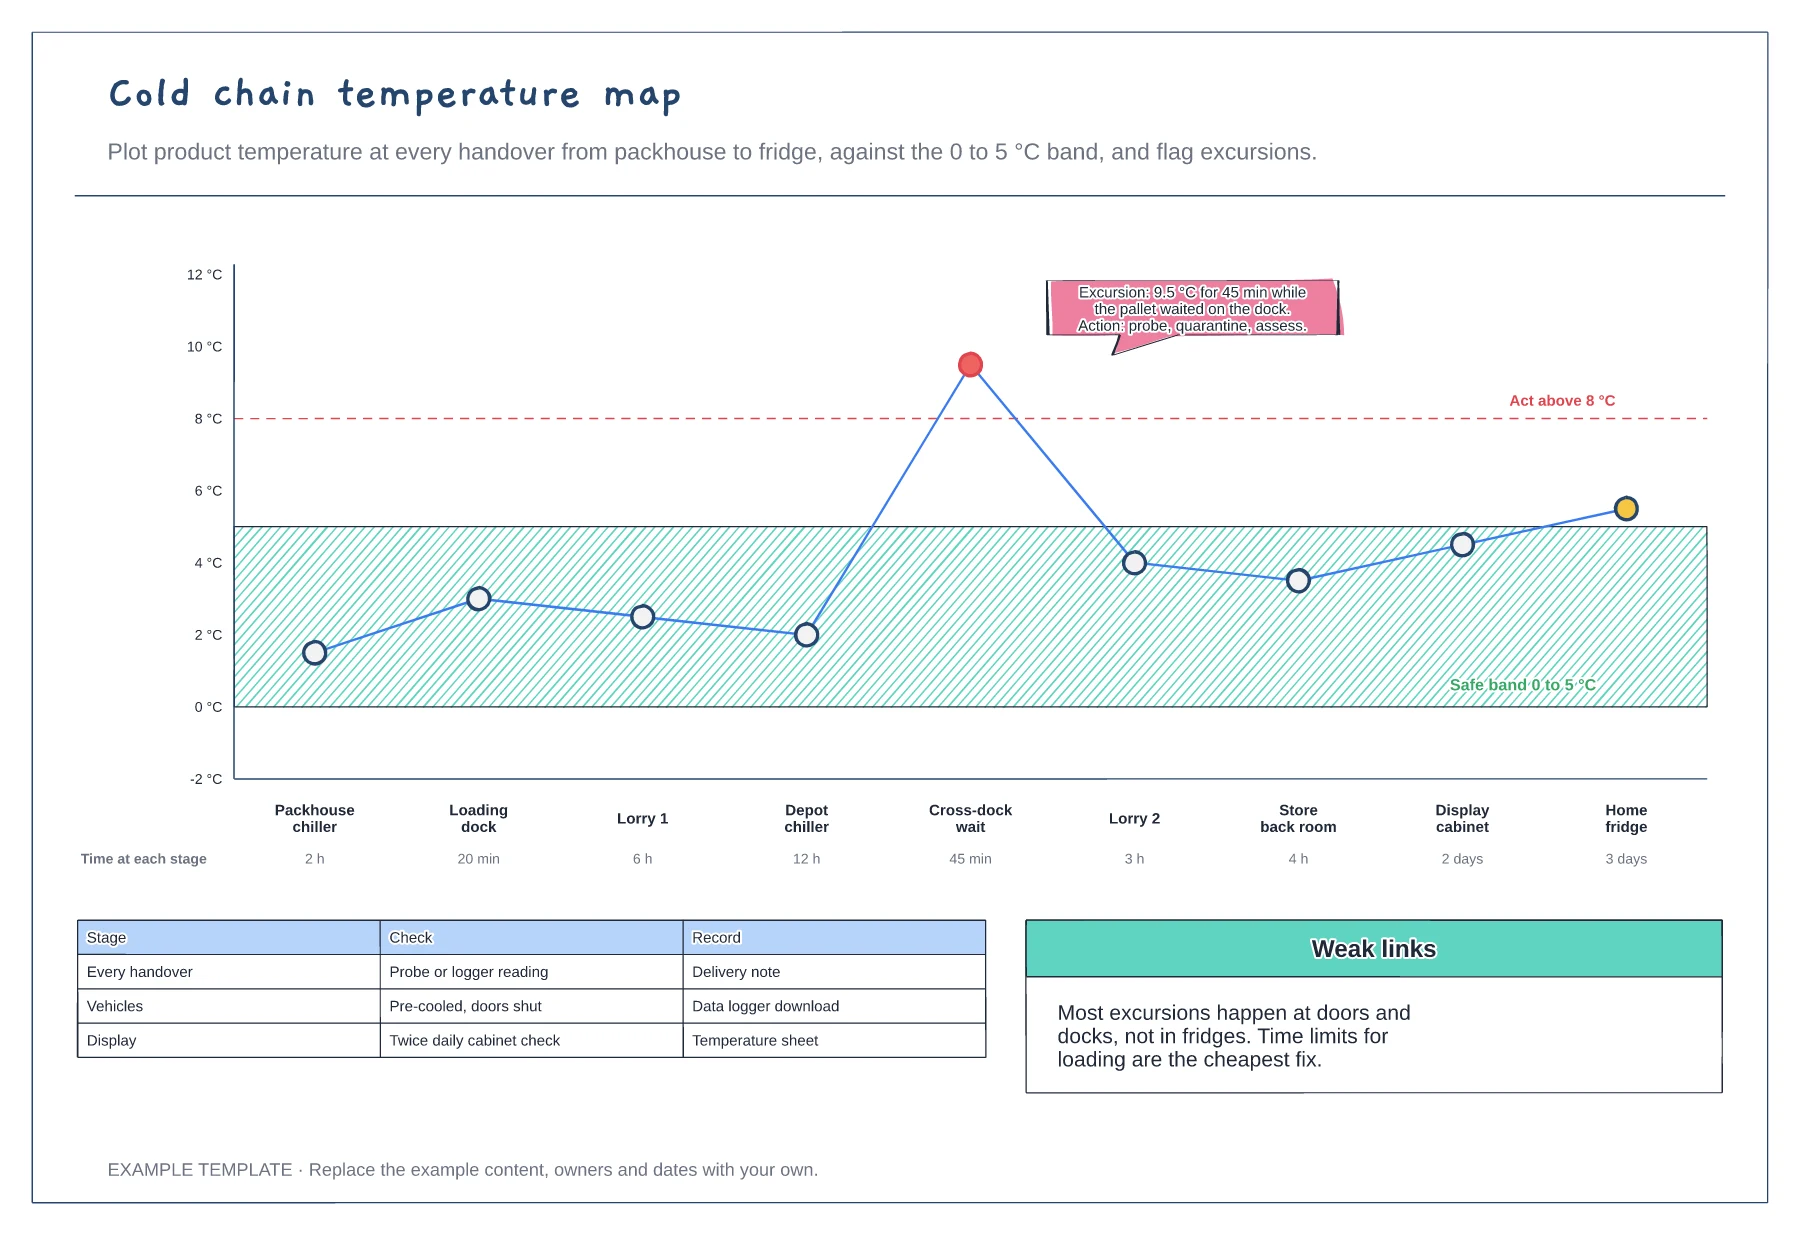
Cold chain temperature map template
A temperature trace through nine stages · Safe band, action line and a flagged excursion · Time at each stage and the checks at handovers
Preview and use template →A farm-to-fork map shows every business a food passes through and what each one adds. This example follows a sliced loaf through seven stages: farm, grain store, flour mill, bakery, distribution, shop and kitchen table. Each stage shows the work done, the time it takes and the records kept, and a bar underneath splits the shelf price between the farmer, miller, baker, haulier and retailer.
No account needed · Opens as your own editable page
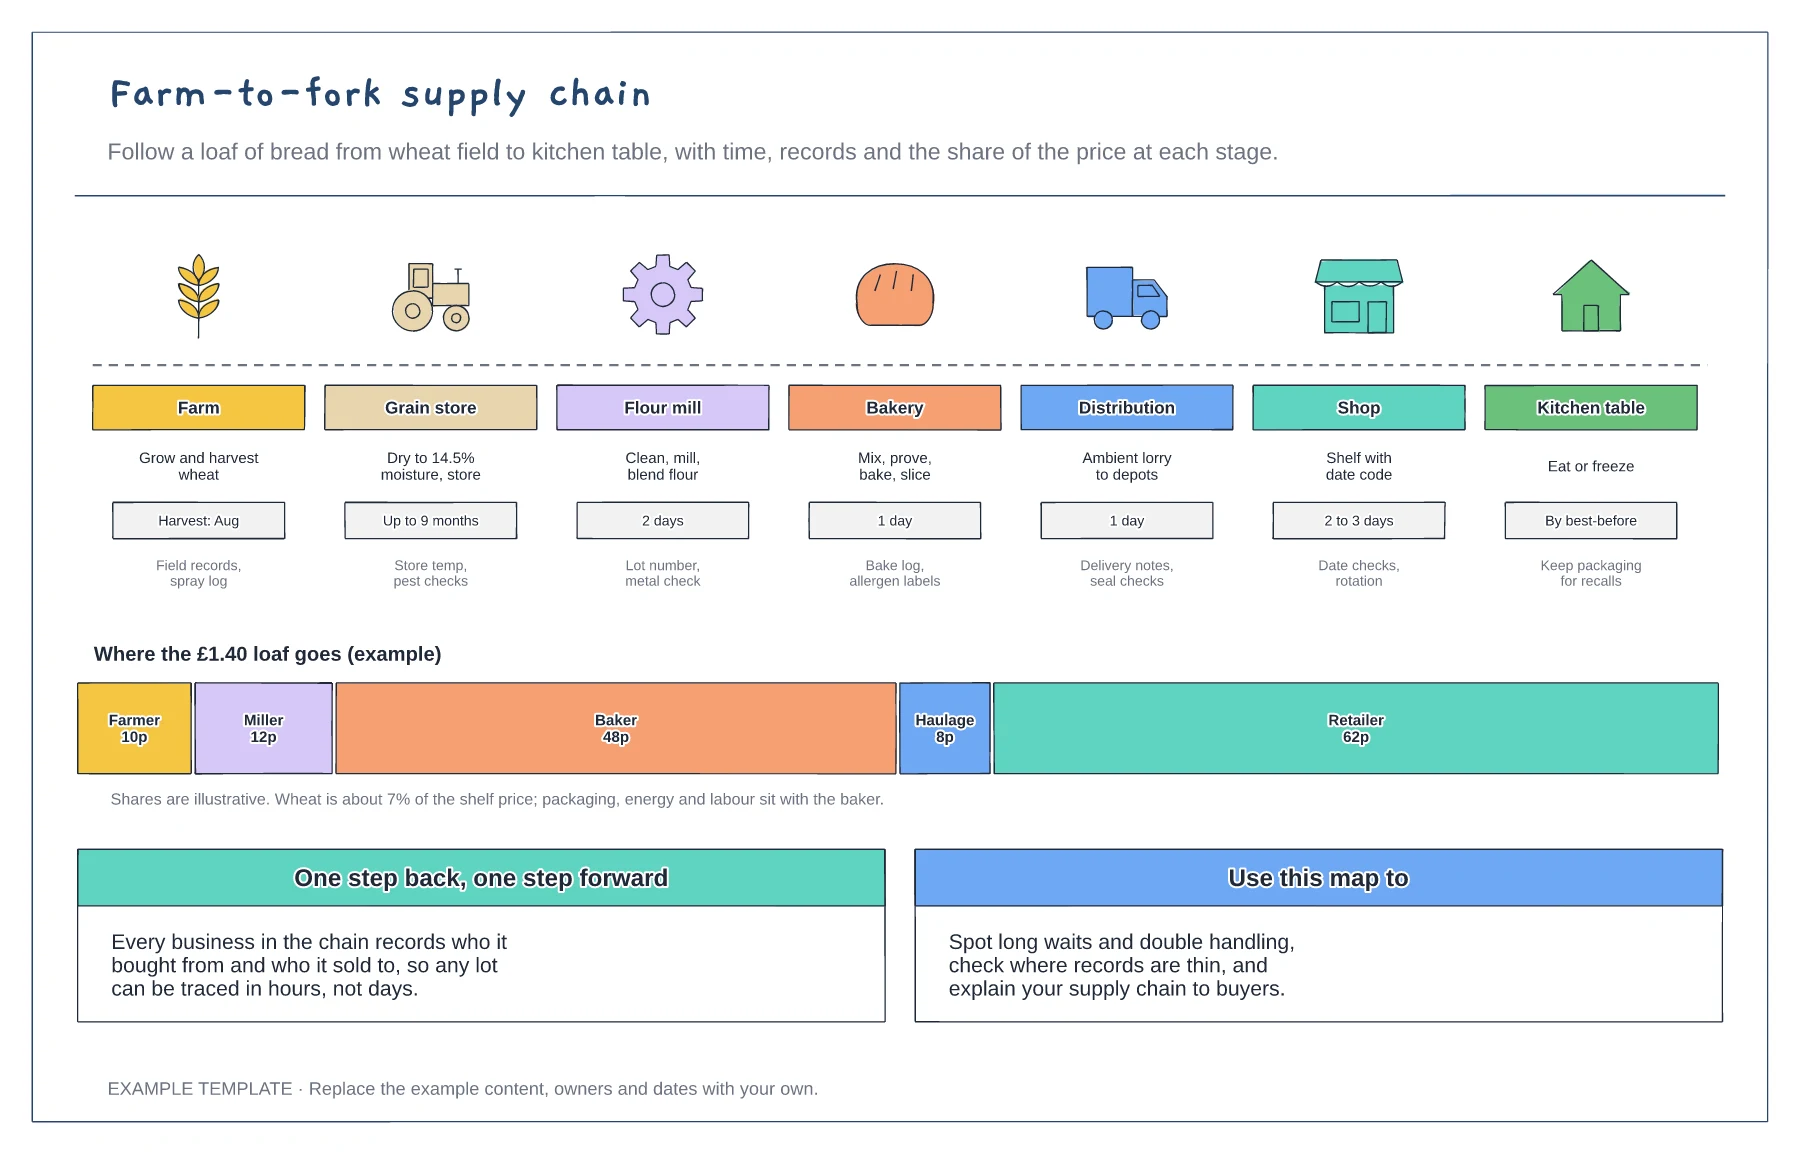
Choose a single product and follow it. A whole range on one map gets too busy to read.
For each stage, note how long the product spends there and what is recorded, so you can see waits and traceability gaps.
Show how the shelf price divides between each stage. Use real figures where you have them and say when they are illustrative.
Yes. Rename the seven stages for your product, edit the time and records under each one and change the price breakdown to your own figures.
No. Open the template and edit it in your browser. Your work saves on this device. An account is optional if you want to sync your workspace.
Yes. Use Export in the editor to save a PNG, SVG or PDF, or download an editable .epicdraw backup.
A temperature trace through nine stages · Safe band, action line and a flagged excursion · Time at each stage and the checks at handovers
Preview and use template →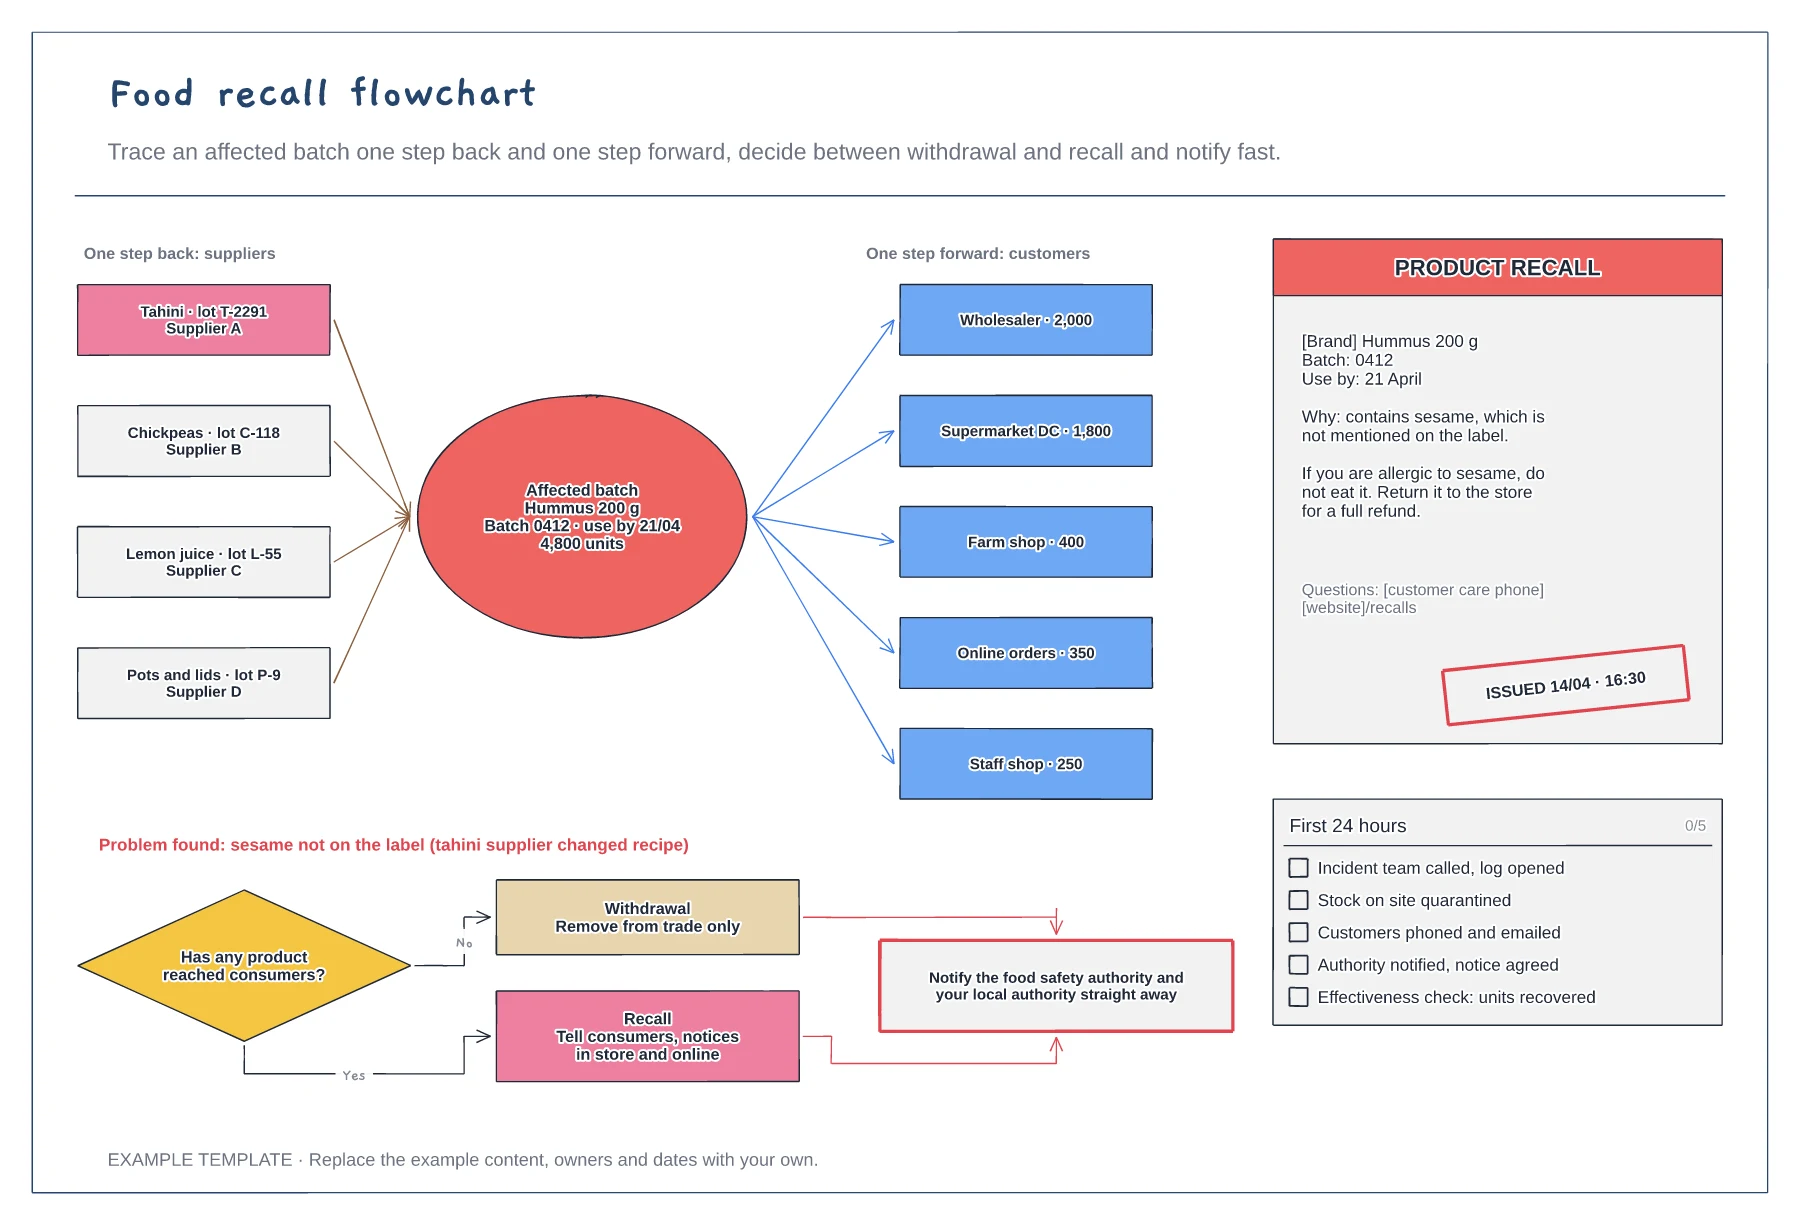
One step back and one step forward traceability · Withdrawal or recall decision · A recall notice and a first-24-hours checklist
Preview and use template →
Supplier, process and customer flow · Inventory queues and process data · Information flow and timing line
Preview and use template →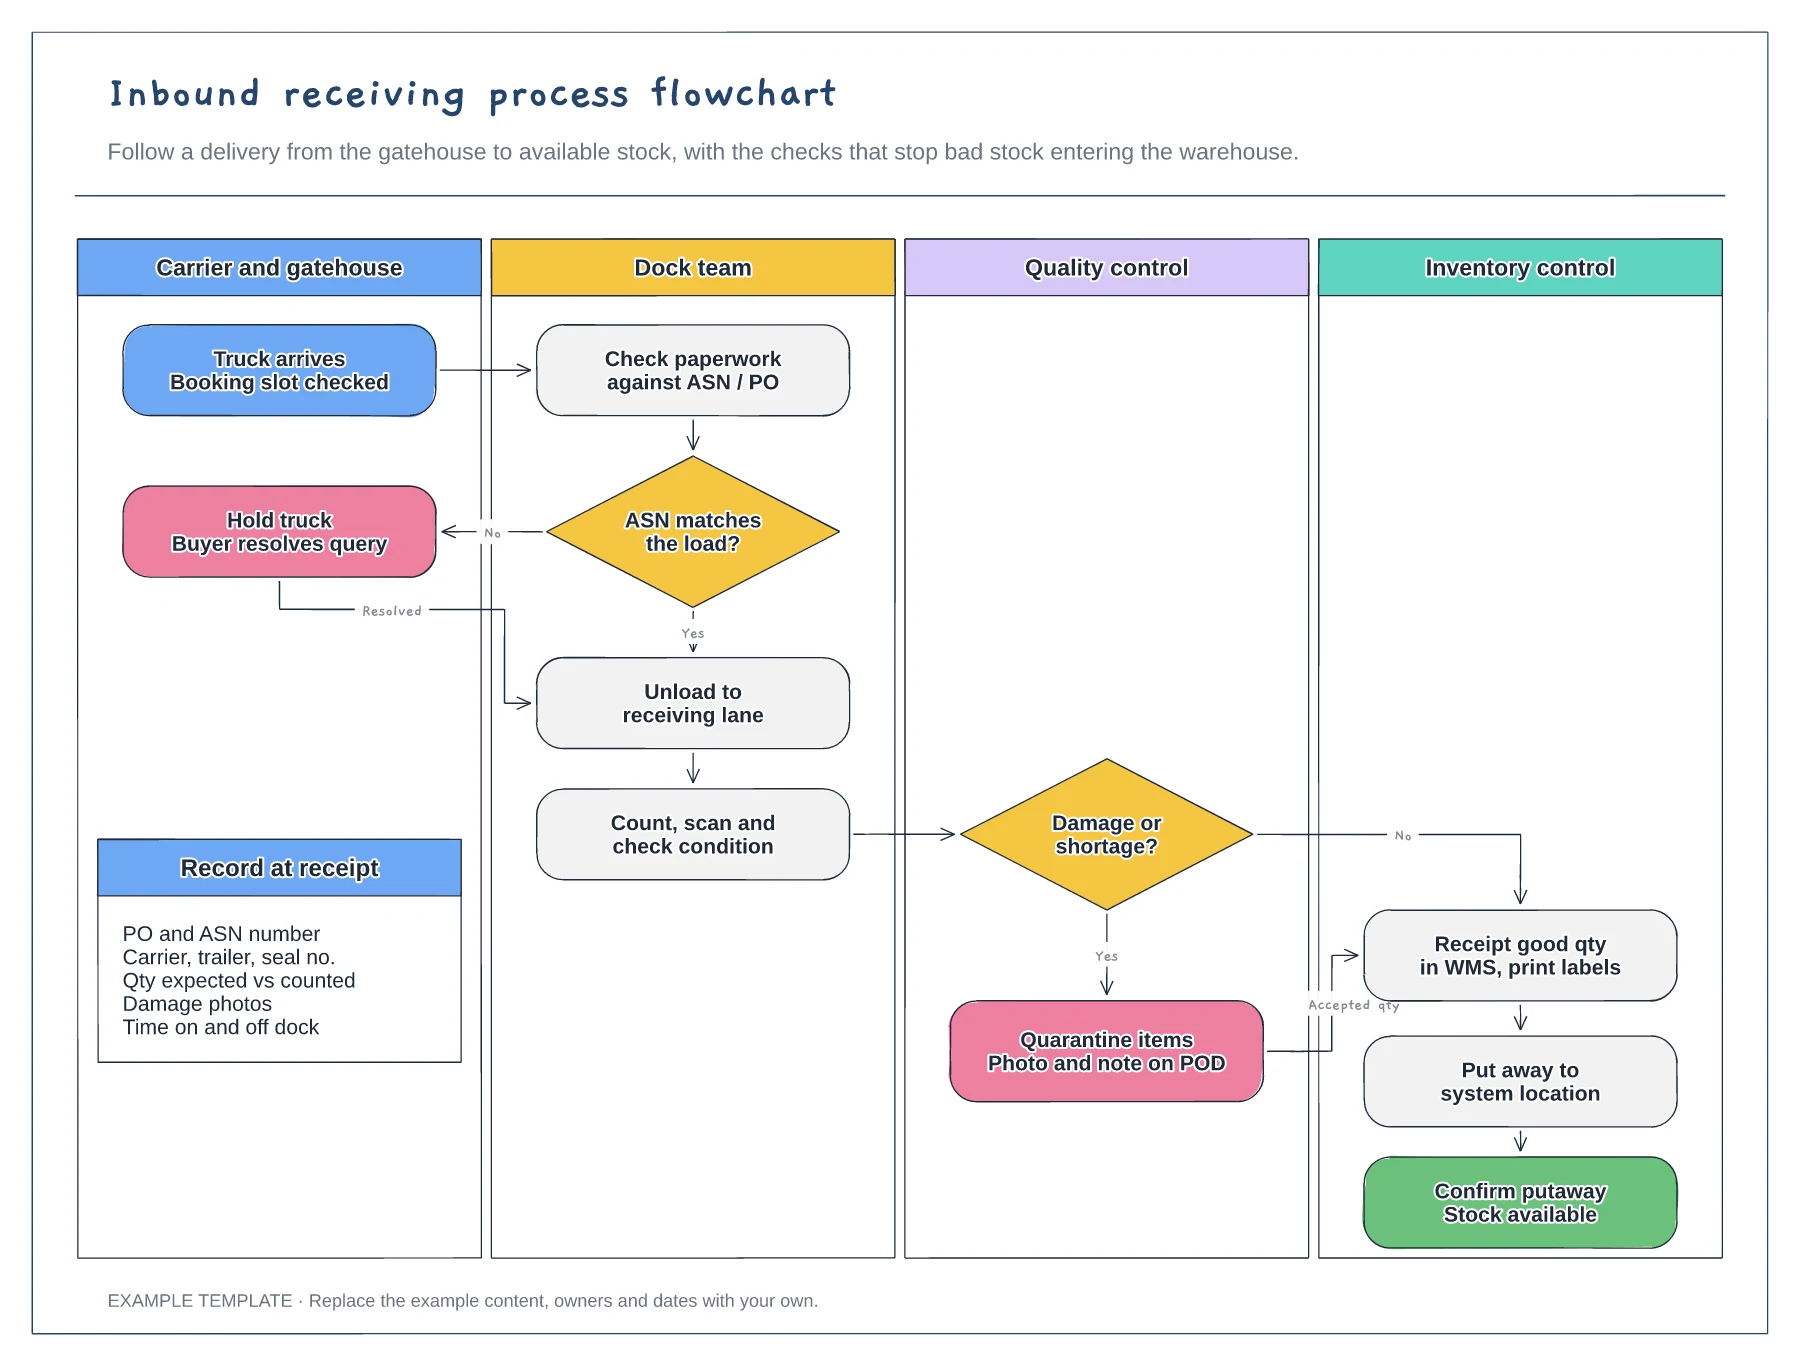
Four swimlanes from carrier to inventory · ASN and damage decisions with Yes and No paths · Data to record at receipt
Preview and use template →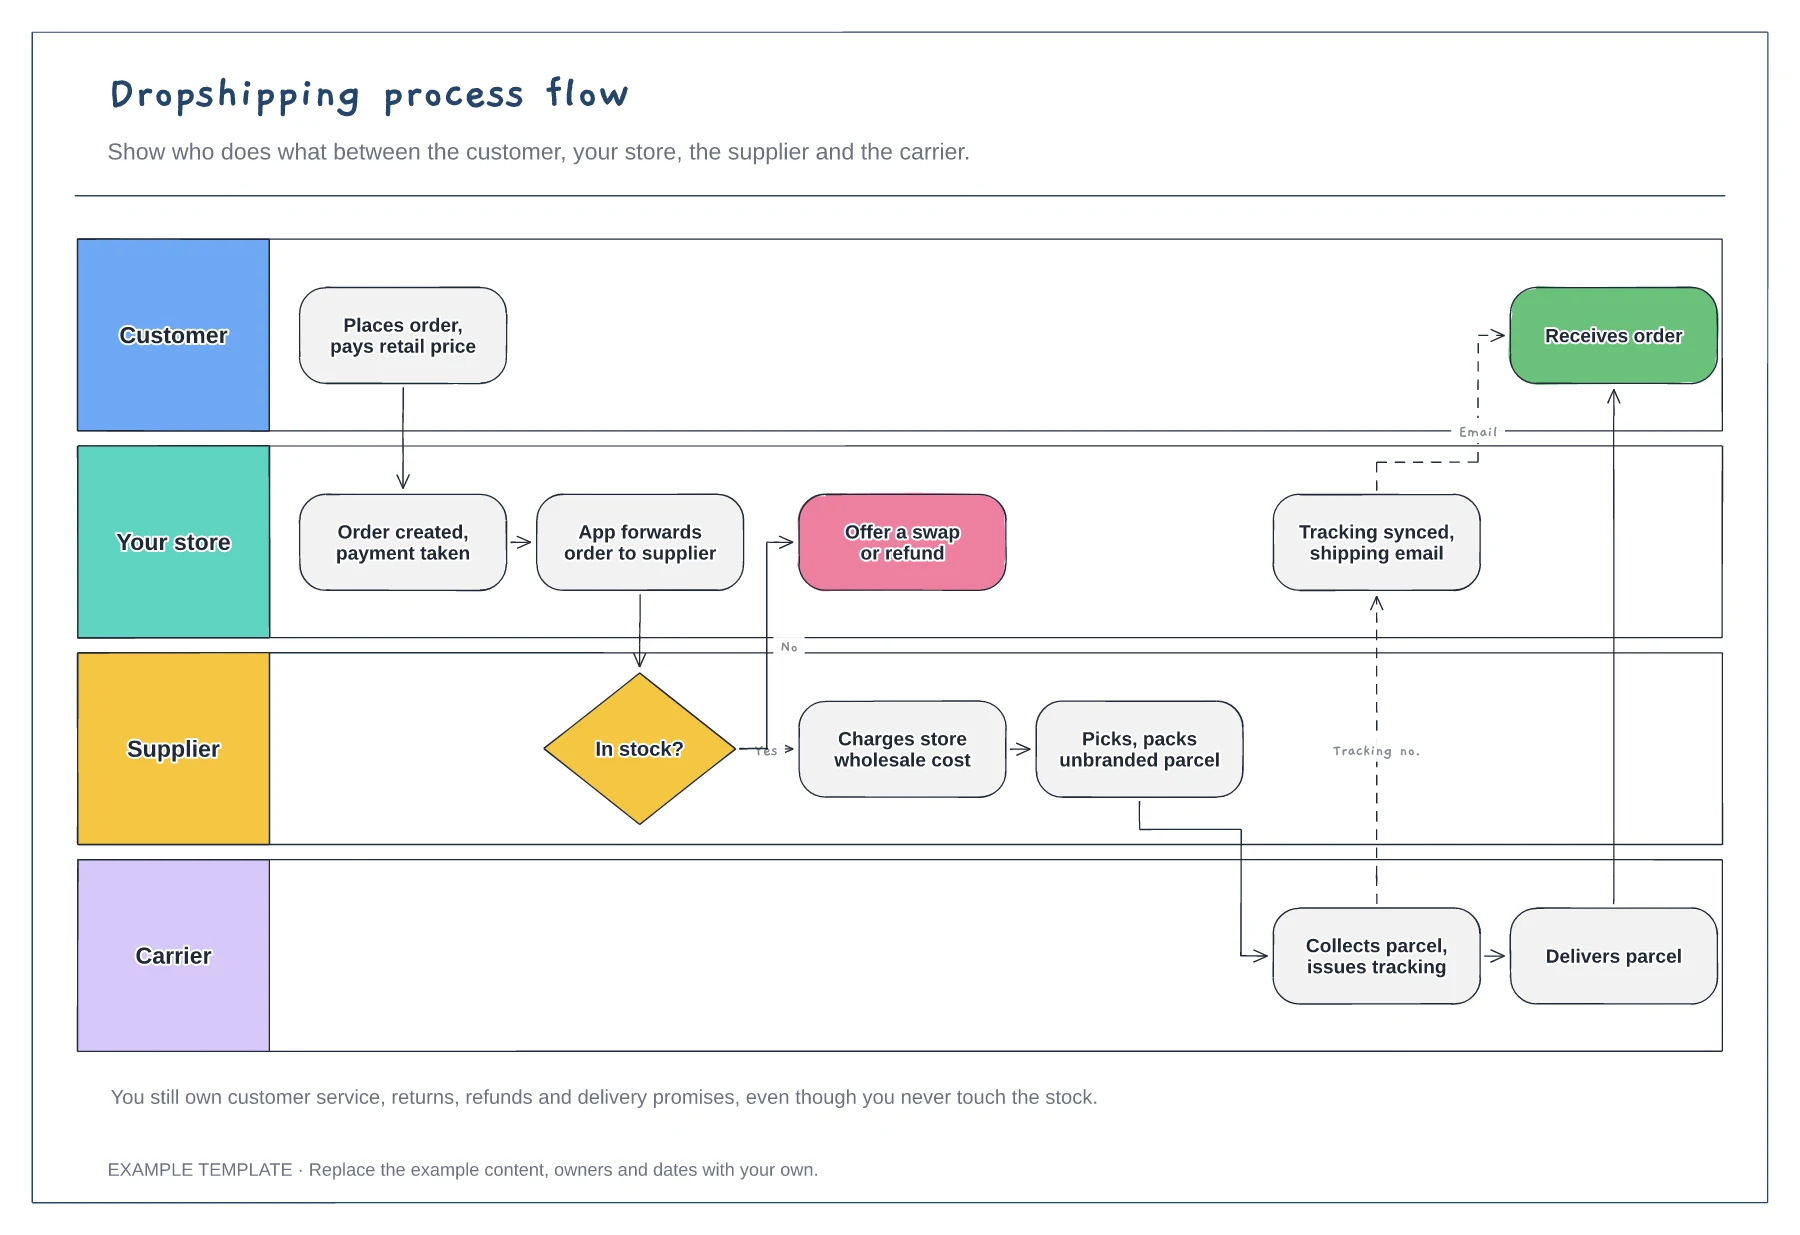
Four swimlanes with handoffs · Out-of-stock branch · Tracking sync back to the customer
Preview and use template →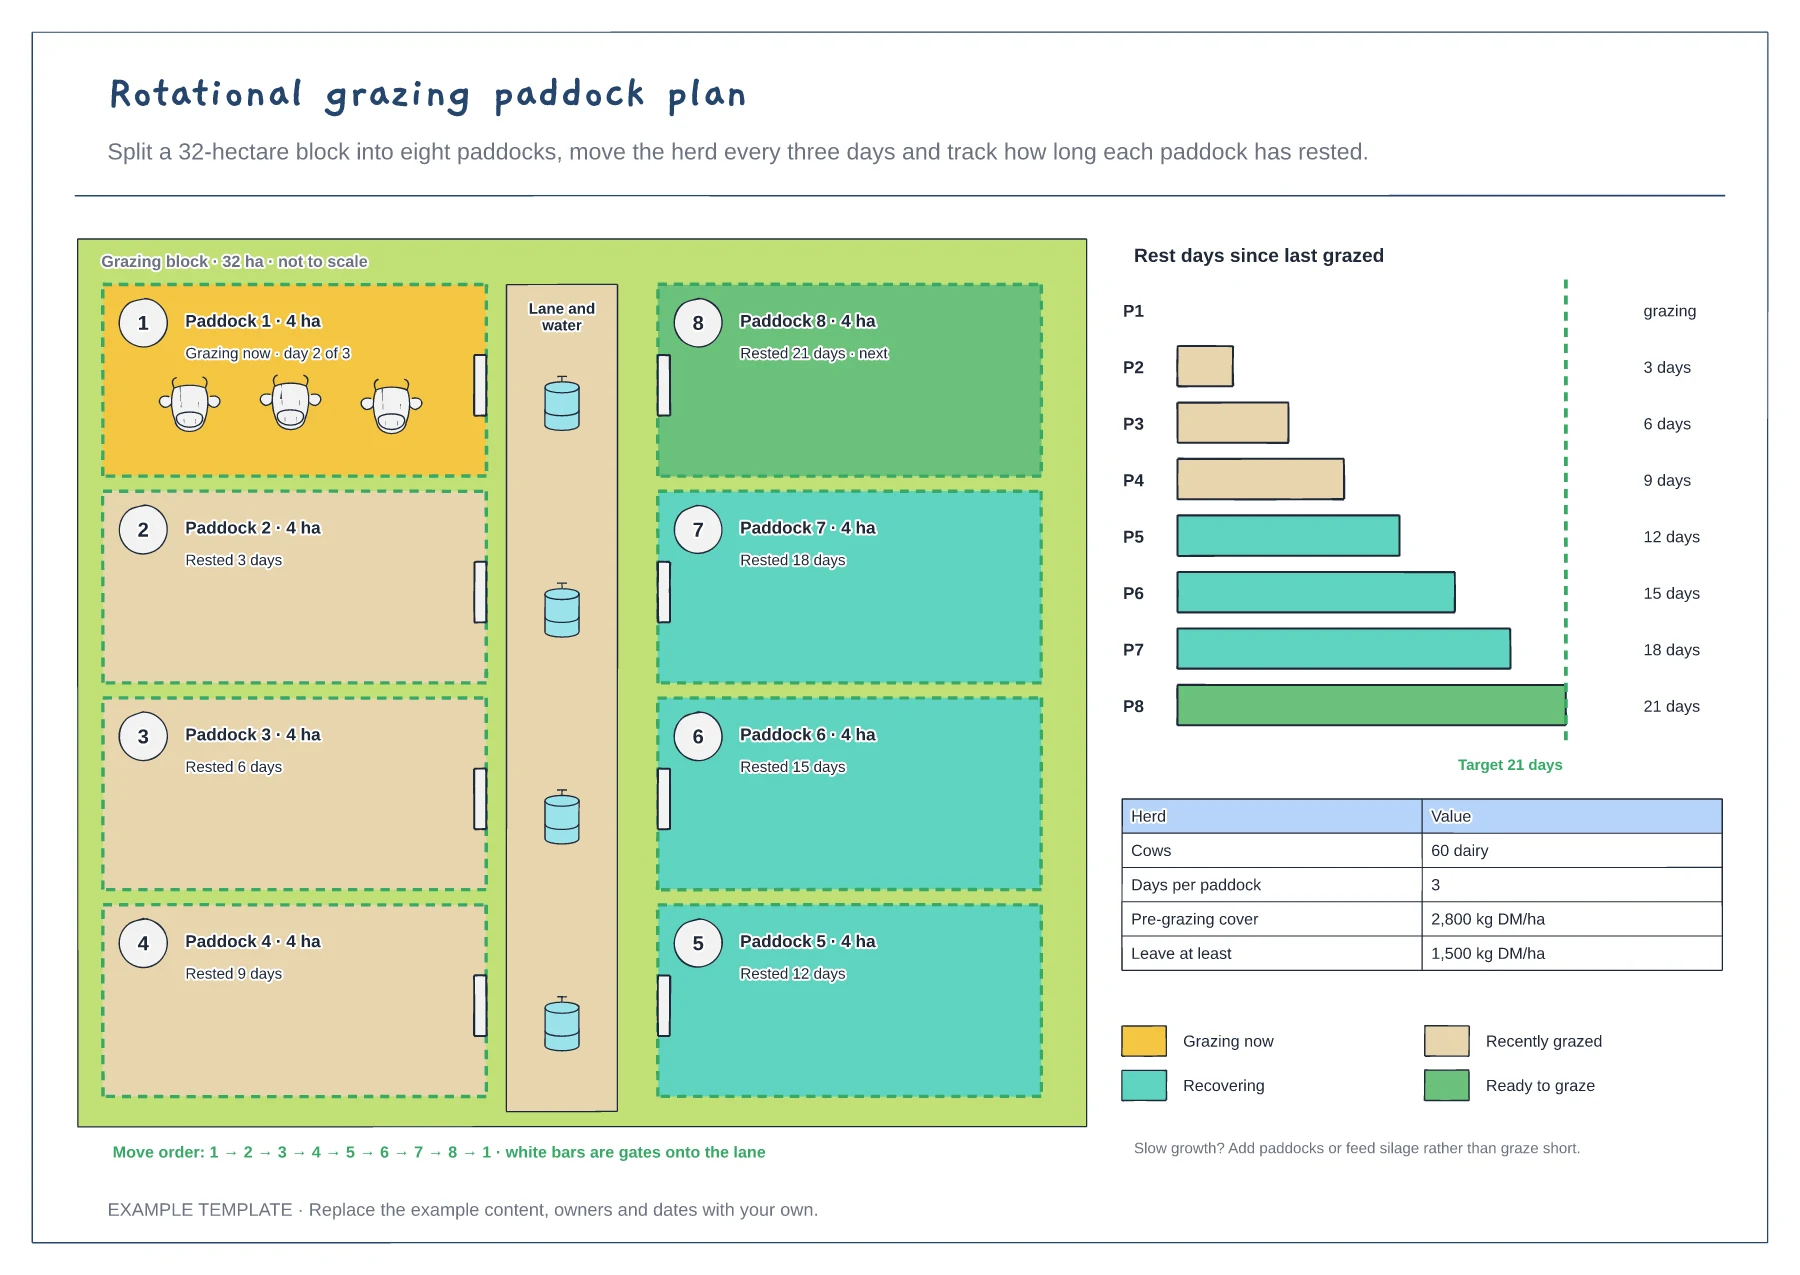
Eight paddocks off a lane with water and gates · Move order and paddock state colours · Rest days against a target and grass covers
Preview and use template →