A value stream map shows how one product gets from a customer's order to the customer's door, and where the time goes along the way. It puts every step on one page with the stock waiting between them and the information that tells each step what to do. The work itself usually takes a small share of that time, so the map is mostly a picture of where the product waits, and why.
You don't need a consultant or a full set of lean symbols to make one. You need one product family, a walk along the floor with a notepad and a watch, and a plain way to draw what you counted. This guide covers how to make a value stream map in four moves: choose the product family, walk the flow and collect timings, draw the material and information flow, then mark the biggest waits.
What a value stream map shows
The Lean Enterprise Institute's lexicon entry on value-stream mapping defines it as a diagram of every step in the material and information flows needed to bring a product from order to delivery. Material flow is the product moving through the work. Information flow is whatever tells each step what to make or do next. Seeing both on one page shows why the waits happen as well as where.
The lexicon distinguishes two maps. The current-state map records how the flow works today, and the future-state map is the target. This guide covers the current state, because you need to see the real flow before you can design a better one.
If the work you want to examine is an office process, such as approving invoices, with no stock moving between steps, make a process map with the people who do each step instead.
Choose one product family
To keep this concrete, the guide follows Ashgrove Furniture, a fictional small workshop that makes oak dining tables to order. The company, its people and every number on the map are invented. You run the workshop, and customers keep asking why a table takes over a month to arrive. They want to know when their table will come. Your job is to find out where the weeks go.
Ashgrove also makes benches and sideboards, so the first decision is what to map. The Lean Enterprise Institute's workbook Learning to See is firm on this: focus on one product family, because drawing every product's flow on one map is too complicated. It defines a family as products that pass through similar steps and common equipment near the customer end, and it suggests writing down the family, how many variants it has, how much the customer wants and how often. The lexicon entry on product families adds that the family is the unit of analysis for a value stream map.
At Ashgrove the family is oak dining tables in three lengths. All three go through the same five steps: cut, join and glue, sand, oil finish, then assemble and pack. Customers order about 10 a week, which is 2 tables per working day. That daily figure matters later, because it turns piles of stock into days of waiting.
Walk the flow and collect timings
The workbook describes value stream mapping as a pencil and paper tool, and it says to map the flow of products through the organisation, not the organisation chart. The US Environmental Protection Agency's Lean and Environment Toolkit puts the reason plainly: the method's strength comes from walking the floor, talking to the people who do the work and watching how the product is really made.
So take the walk yourself, with a data collection sheet. At each step, write down four things:
- Cycle time: how long one table takes at that step. The lexicon's cycle time entry describes it as something you find by timing the work.
- Changeover: how long it takes to switch from one job to the next, such as resetting a saw for a new length.
- People: how many work on that step.
- Waiting: how many tables, or sets of parts, are sitting in front of the step right now.
The EPA's example data boxes also record machine uptime, which a small workshop can leave out at first. Count every pile on the same walk, so the numbers describe one moment.
Ashgrove's counts at 10am showed timber for 16 tables in the rack, cut parts for 4 tables, 4 glued tops, 10 sanded tables and 4 finished tables waiting, plus 6 packed tables waiting for the van. Ask why each pile is there while you count it. At Ashgrove the answers were that oak arrives every two weeks, oiling is done in a batch on Tuesdays and Thursdays, and the van only goes out on Fridays.
Draw material and information flow
You have the counts and the times. Now arrange them so anyone can read the flow from left to right. Put the supplier at the top left, the customer at the top right and whoever schedules the work in between. Along the bottom, alternate the steps and the waits in the order the product moves, with solid arrows for material. Then draw the information as dashed arrows. Learning to See treats material and information as two sides of the same coin and says to map both.
The information flow explains some of those piles. At Ashgrove, orders come in by email and Priya keeps them in a spreadsheet. She phones the timber order every two weeks and prints a cutting list on Mondays. That list is the only schedule anyone receives. Every step after cutting works on whatever is waiting in front of it.
Under the row of steps, add a timeline. Convert each pile into days by dividing it by daily demand: 16 tables of timber at 2 tables a day is 8 days. Put the days under each wait and the cycle time under each step. Ashgrove's map adds up to 22 days of waiting and 300 minutes of work, about 5 hours. The lexicon's cycle time entry says processing time is typically a small fraction of production lead time, and here the work is under 3% of a lead time of about 23 working days.
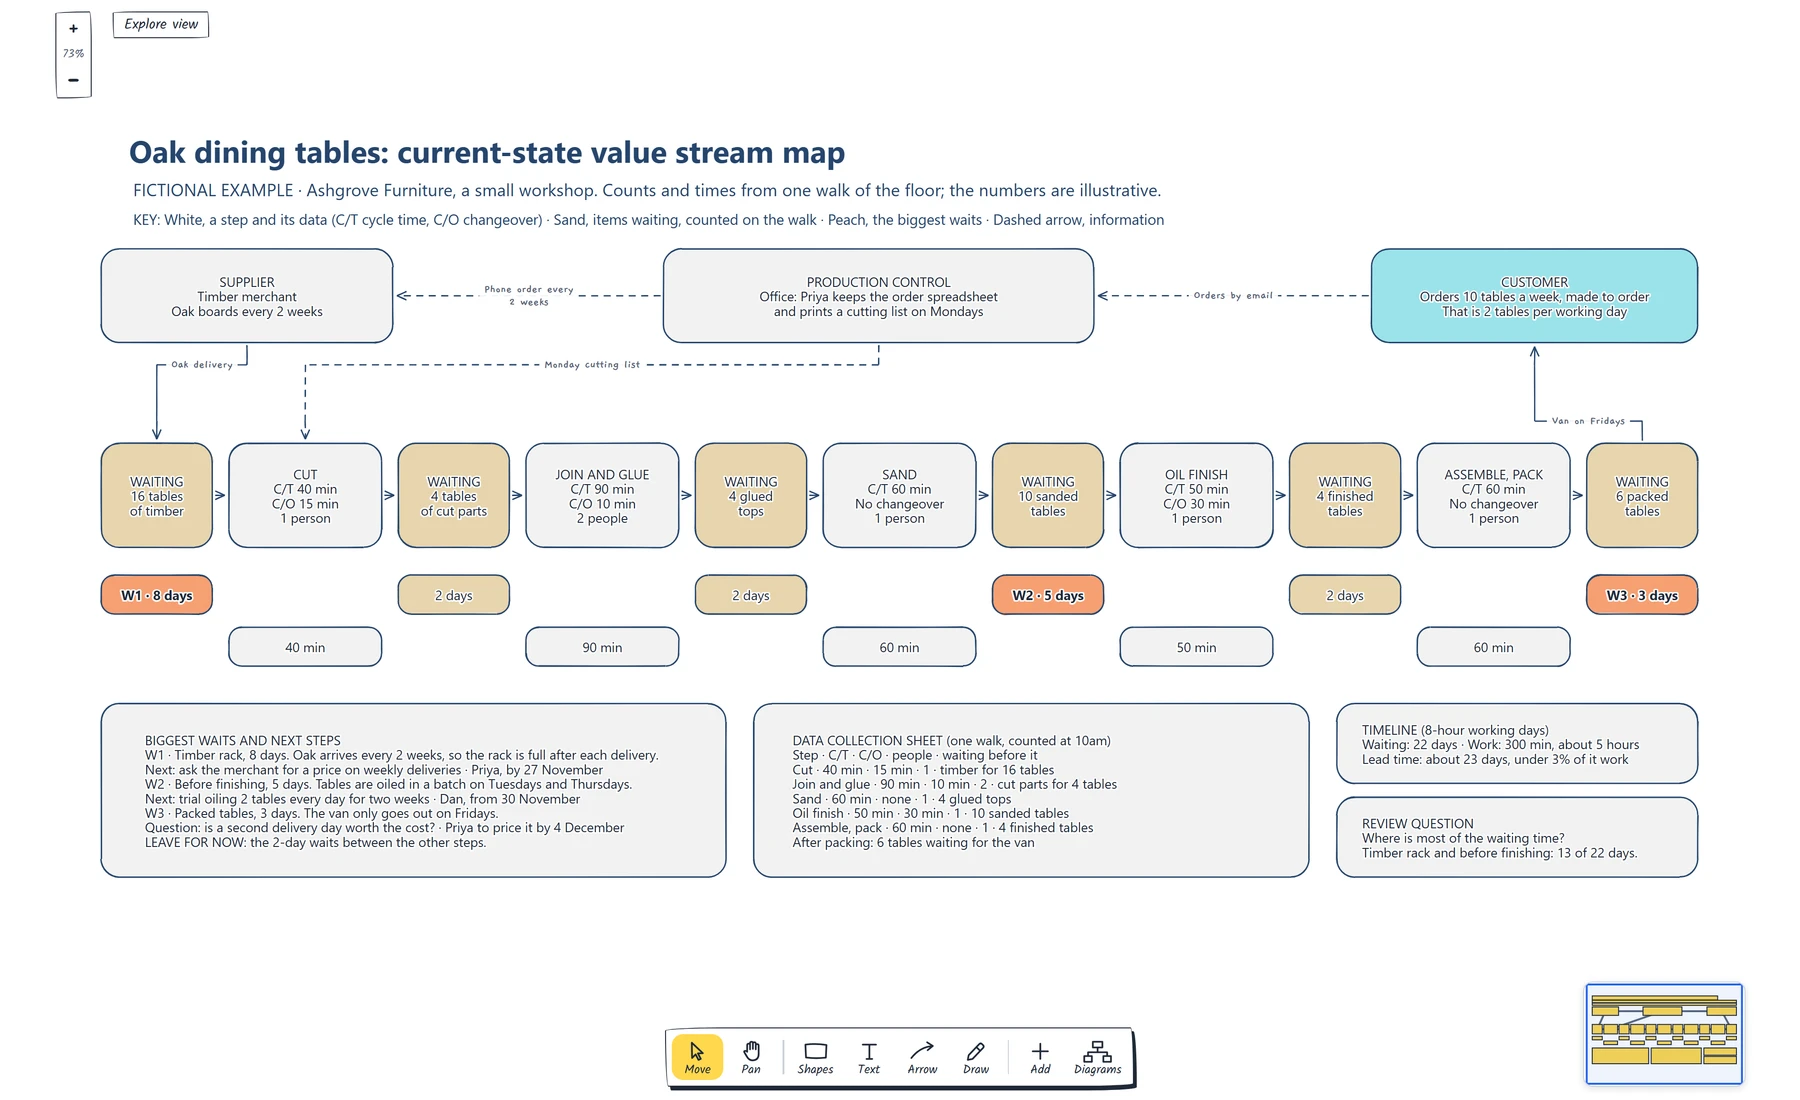
Follow the dashed arrows from the customer to the cutting step, then read the timeline from left to right. The peach boxes hold 16 of the 22 days of waiting.
For a larger template with process boxes, inventory queues and a timing line for an assembly process, start from the manufacturing value stream map.
Mark the biggest waits
Now ask the review question on the board: where is most of the waiting time? At Ashgrove, the timber rack and the pile before finishing hold 13 of the 22 days, and the packed tables add 3 more. Tag those three W1 to W3 so the list and the map point at the same place.
Each wait already has a reason from the walk, and the reason suggests the next step. Timber arrives every two weeks, so Priya will ask the merchant for a price on weekly deliveries. Oiling happens in batches, so Dan, who does the finishing, will try oiling two tables every day for two weeks. The Friday van is a cost decision, so W3 starts as a question with an owner.
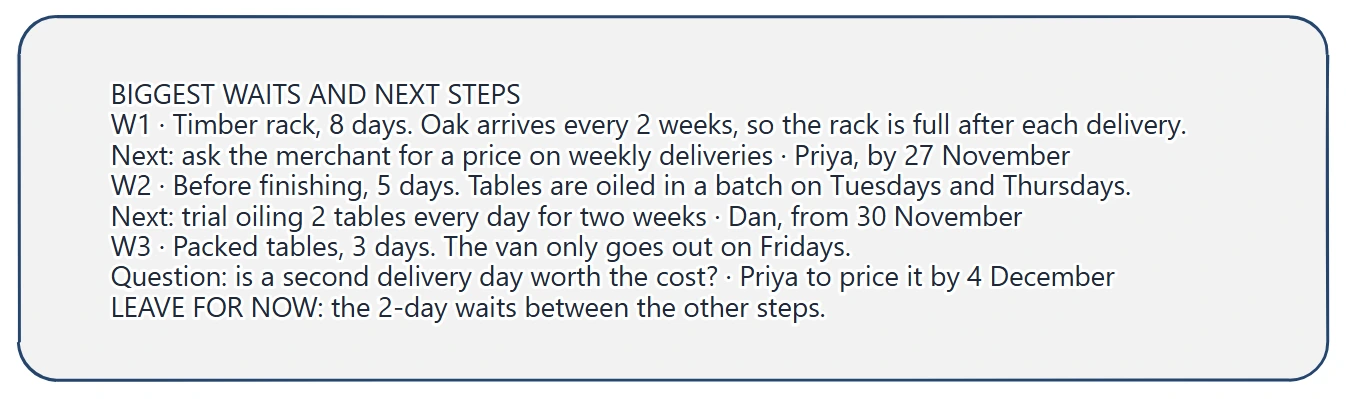
Check that each wait names its cause and that every next step has an owner and a date. W3 is still a question, so it has a price to find first.
Ashgrove leaves the 2-day waits alone for now and writes that down, so the next review doesn't start the same debate. Nothing has changed yet, but the team knows where a table's month goes and has three things to try. The workbook says the future-state map matters most. Once the trials have run, draw the future state with the changes that worked. The EPA's toolkit appendix says that when the future state becomes reality it becomes the new current state, and you draw a new future state from there.
You can open the editable starter near the top of this page to map your own product family. It adds a new page and leaves your existing drawings alone. Double-click a box to change its text, and select a box and choose a new Fill colour to mark one of your biggest waits.
If a wait has no obvious cause and the team disagrees about why it happens, sort its possible causes on a fishbone diagram before you choose a next step.
Review checklist
Copy this worksheet before you walk the floor:
Product family (the products that share the same final steps):
Variants in the family:
Customer demand per week, and per working day:
Walked on (date and time of the counts):
For each step: cycle time, changeover, people, items waiting before it:
How each step finds out what to make next:
Waits converted to days (count divided by daily demand):
Total waiting days and total work time:
The three biggest waits and why each one happens:
Next step or question, owner and date for each:
Waits left alone, and why:
Date to walk the flow again:
Before you share the map, read it left to right and answer the question on the board: where is most of the waiting time?
Optional: create the example with an AI assistant
If you use an AI assistant that supports remote MCP with OAuth sign-in, you can ask it to build this value stream map example in your EpicDraw workspace. MCP is the connection that lets the assistant use EpicDraw's diagram tools.
This route needs a free EpicDraw account and cloud sync. Open More, choose Connect AI assistant and add https://epicdraw.app/mcp in your assistant. When EpicDraw asks you to approve the connection, allow it to create and edit diagrams. The MCP connection guide walks through each step.
Paste this prompt into the connected assistant:
Using the connected EpicDraw MCP server, create a new editable page named "Oak dining table value stream map and data sheet". Leave existing pages unchanged.

Build a fictional current-state value stream map for oak dining tables at Ashgrove Furniture, a small workshop. Add a key: white for a step and its data (C/T cycle time, C/O changeover), sand for items waiting, peach for the biggest waits and dashed arrows for information. Along the top, add a supplier card (timber merchant, oak boards every 2 weeks), a production control card (Priya keeps the order spreadsheet and prints a cutting list on Mondays) and an aqua customer card (10 tables a week, made to order, 2 tables per working day). Draw dashed information arrows labelled "Orders by email" from the customer to production control, "Phone order every 2 weeks" from production control to the supplier and "Monday cutting list" from production control to the cutting step. In one row from left to right, alternate sand waiting boxes and white steps: 16 tables of timber, CUT (C/T 40 min, C/O 15 min, 1 person), 4 tables of cut parts, JOIN AND GLUE (C/T 90 min, C/O 10 min, 2 people), 4 glued tops, SAND (C/T 60 min, no changeover, 1 person), 10 sanded tables, OIL FINISH (C/T 50 min, C/O 30 min, 1 person), 4 finished tables, ASSEMBLE, PACK (C/T 60 min, no changeover, 1 person) and 6 packed tables. Connect them with solid arrows, add "Oak delivery" from the supplier to the timber and "Van on Fridays" from the packed tables to the customer. Underneath, add a timeline with the days each pile represents (8, 2, 2, 5, 2 and 3 days) under the waits and the minutes under each step, and mark the 8, 5 and 3 day waits in peach as W1, W2 and W3. Add a biggest waits card with the cause, next step, owner and date for W1 to W3, a data collection sheet card with the counts from one walk at 10am, a timeline totals card (22 days waiting, 300 minutes of work, lead time about 23 days) and the review question "Where is most of the waiting time?".

Use editable shapes, text and connectors. Label the example as fictional and the numbers as illustrative. This is a visual planning draft. Check for overlapping objects and overflowing labels, then return a PNG preview and the private editor link. Leave the result as a draft for me to review.
Open the returned private editor link while signed in. The assistant's layout may differ from the screenshot, and it knows nothing about your workshop. Replace the fictional counts, times and names with what you find when you walk your own product family.
Takeaways
- Map one product family, chosen by the steps its products share near the customer end.
- Walk the floor yourself and count what is waiting at each step at the same time of day, with cycle times you have timed.
- Draw the information flow as well as the material, because how each step finds out what to make often explains the piles.
- Convert each pile into days of demand, so the timeline shows how little of the lead time is work.
- Tag the biggest waits, give each a next step or question with an owner, and draw the future state once you know what worked.
Keep your next draft close
Create a free account to save your pages in the cloud and use them across devices.
Create a free accountYou can keep drawing without an account.