Customer support
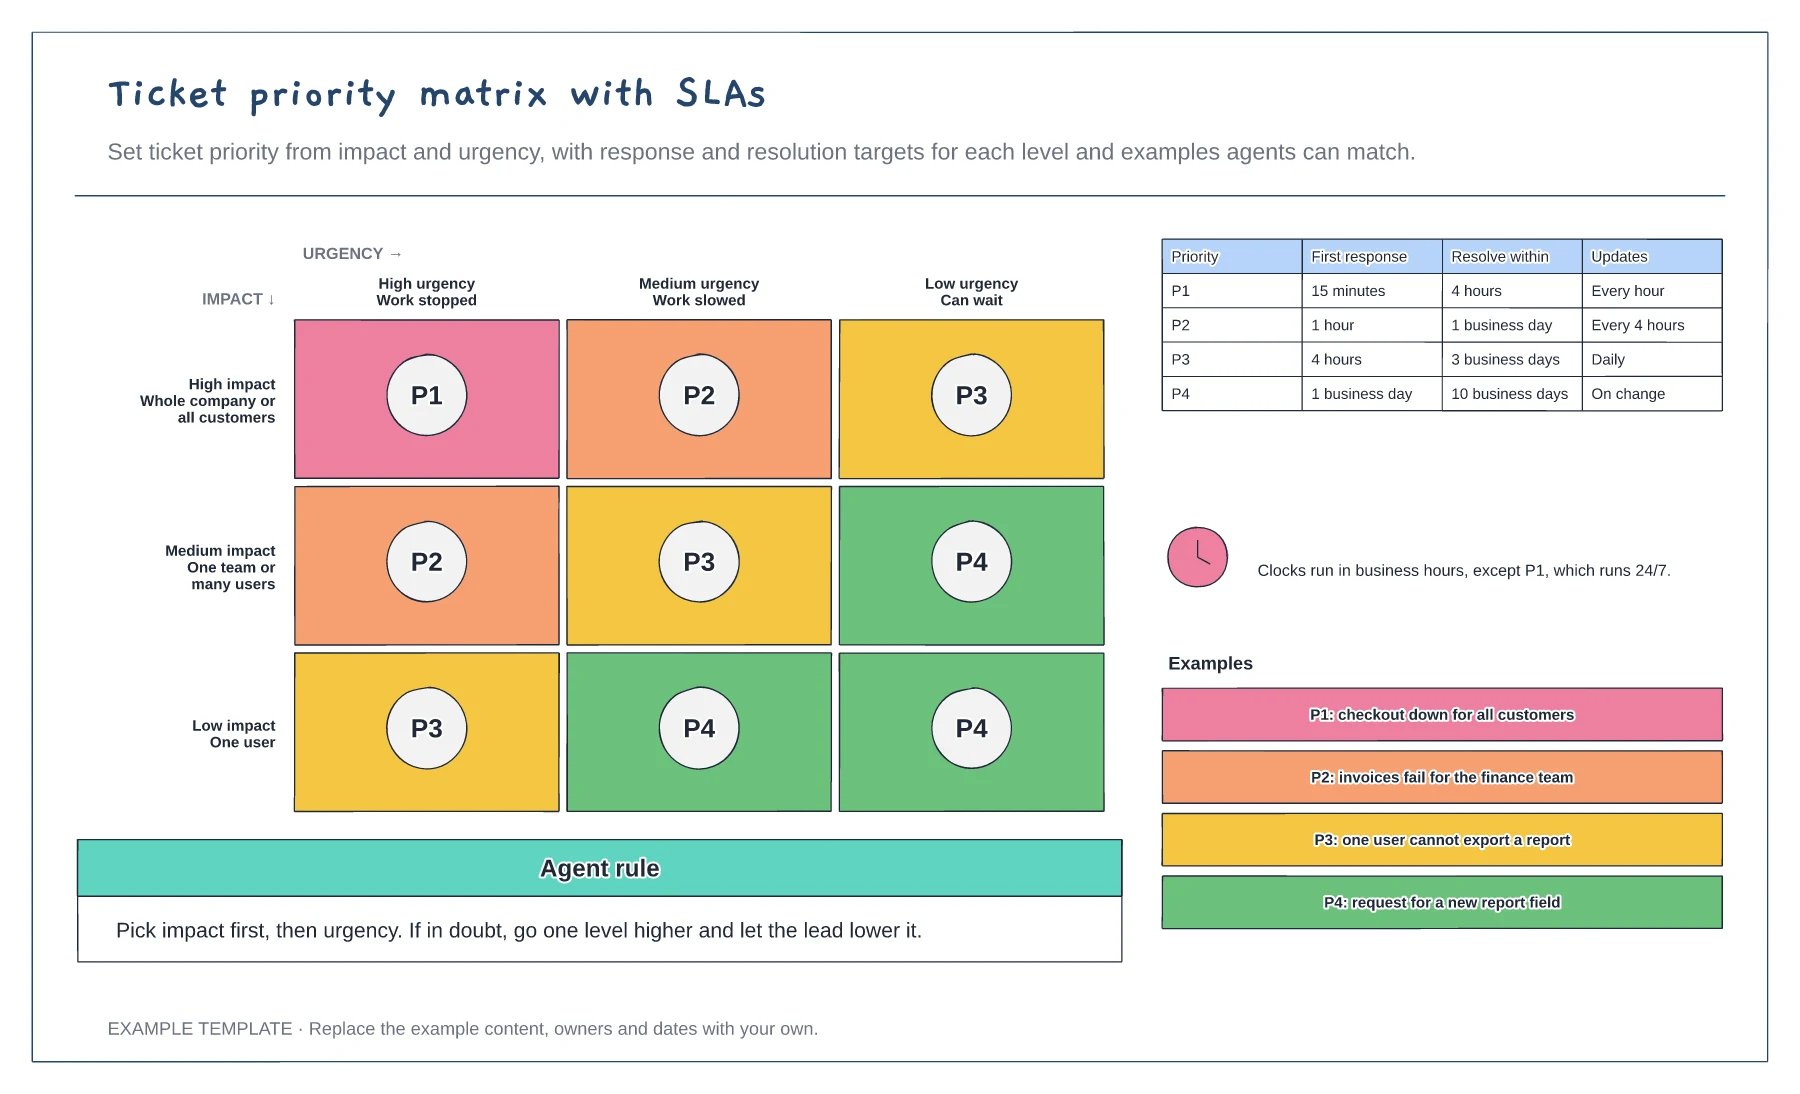
Ticket priority matrix with SLAs template
An impact by urgency matrix with P1 to P4 · Response, resolution and update targets · Worked examples for each priority
Preview and use template →A ticket lifecycle is easiest to agree as a state diagram. This example shows the six states most help desks use, the event that moves a ticket between them, the reopen path when a customer replies after a fix, and whether the SLA clock is running, paused or stopped in each state. A table underneath says who acts next in every state.
No account needed · Opens as your own editable page
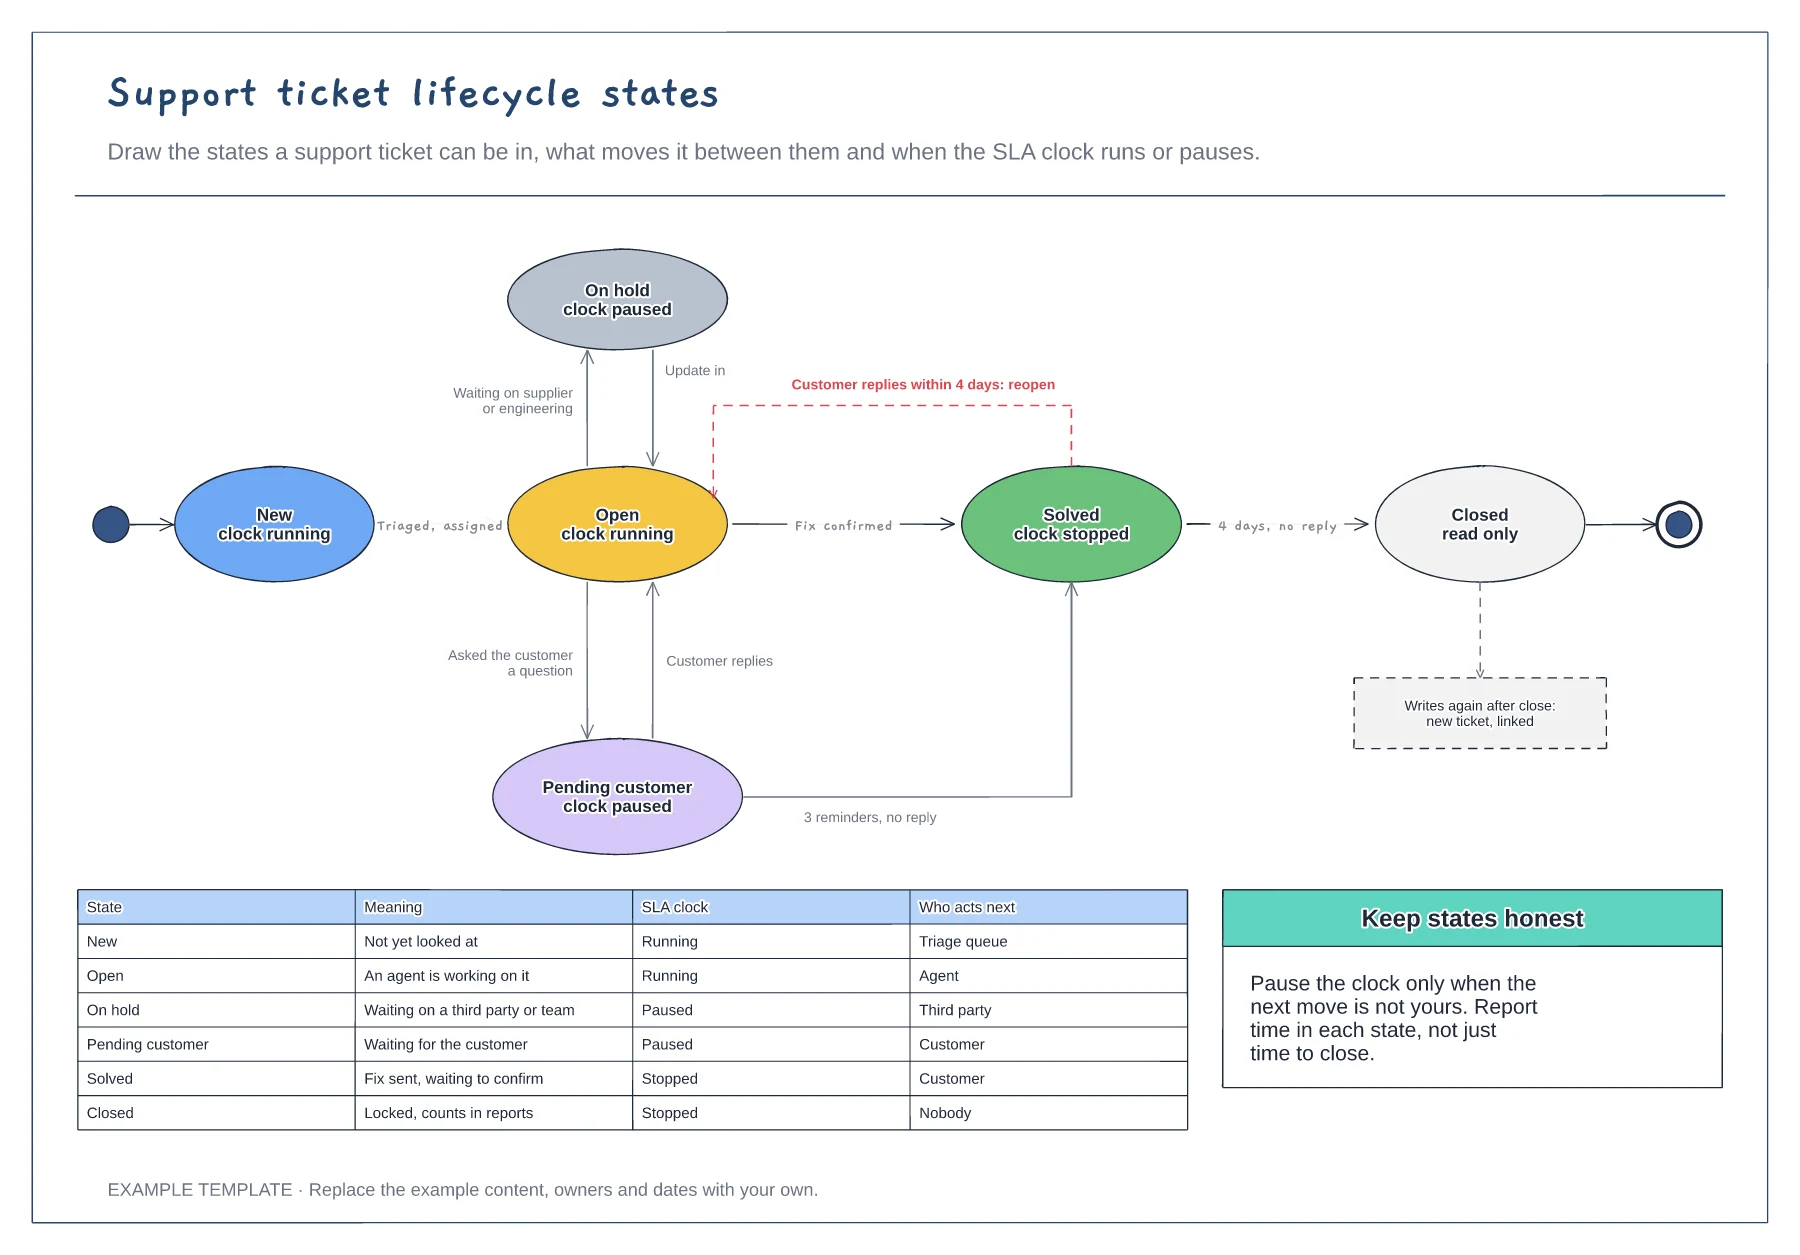
List the statuses your help desk really uses and merge any that mean the same thing to the customer.
Connect the states with arrows and label each one with the event that moves the ticket, including automatic ones such as closing after four days.
Mark where the SLA clock runs and where it pauses, then make sure your help desk settings match the drawing.
Yes. Add a state box, connect it with labelled arrows and add a row to the table saying whether the SLA clock runs, pauses or stops.
No. Open the template and edit it in your browser. Your work saves on this device. An account is optional if you want to sync your workspace.
Yes. Use Export in the editor to save a PNG, SVG or PDF, or download an editable .epicdraw backup.
An impact by urgency matrix with P1 to P4 · Response, resolution and update targets · Worked examples for each priority
Preview and use template →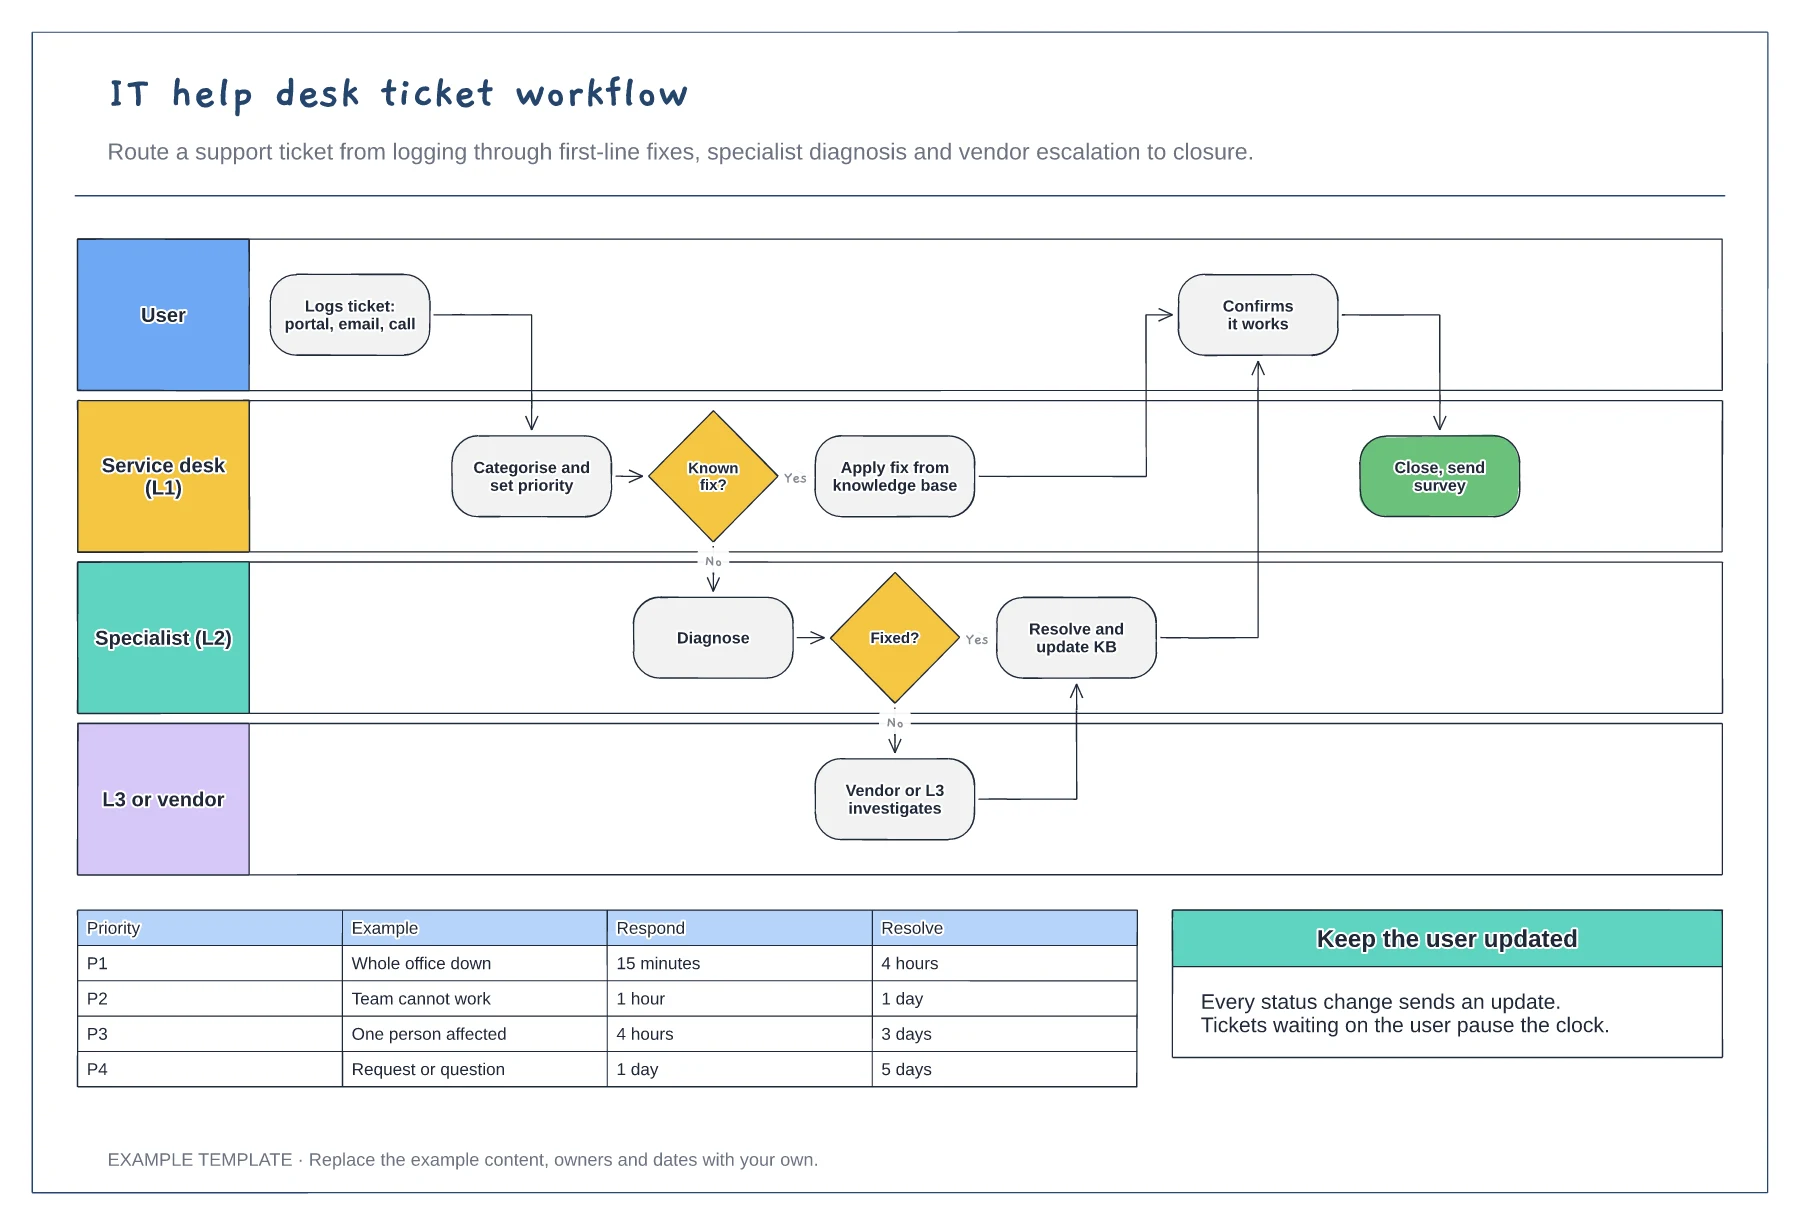
User, L1, L2 and L3 or vendor lanes · Knowledge base fix and escalation path · Priority SLA table
Preview and use template →
First-line triage and impact check · Specialist ownership and investigation · Customer updates and closure
Preview and use template →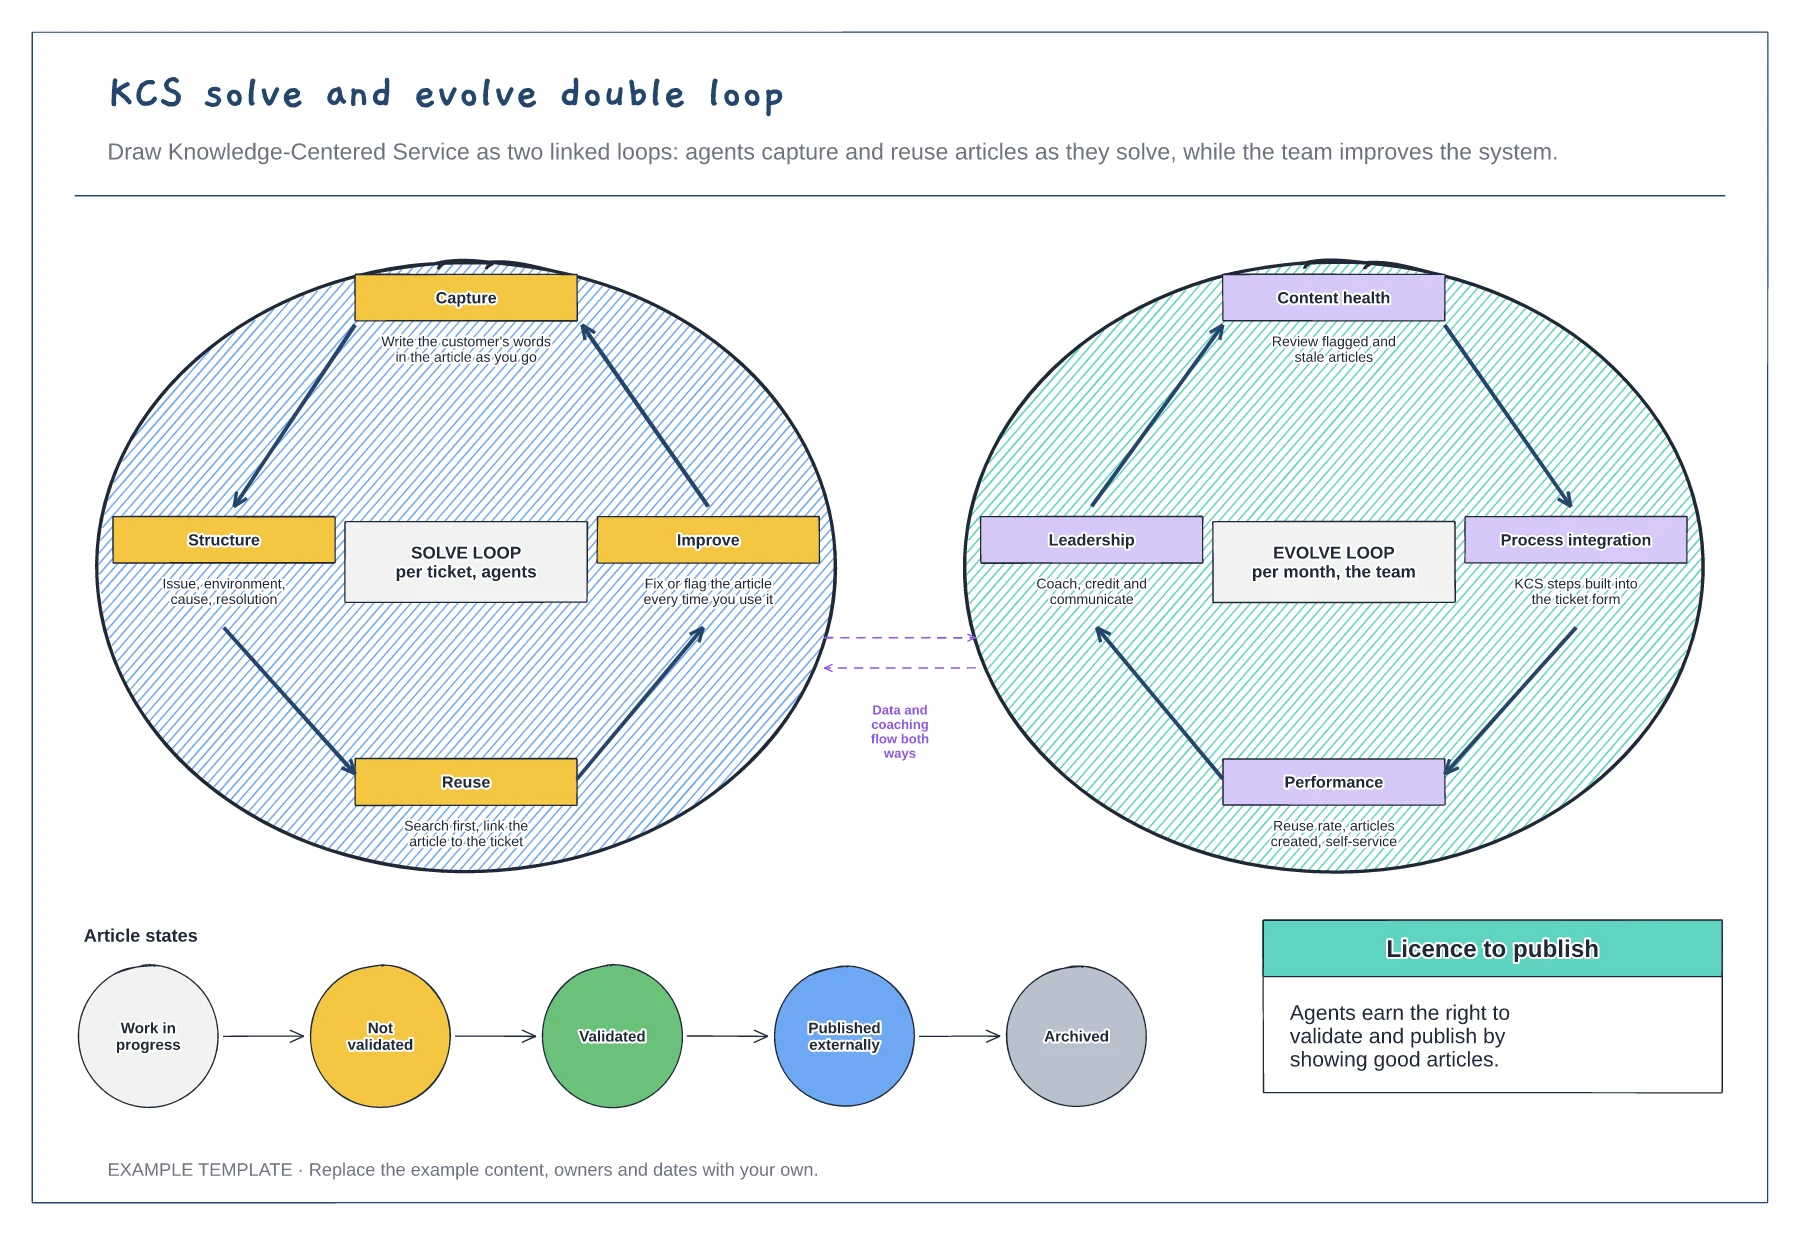
The solve loop for agents · The evolve loop for the team · Article states from draft to archived
Preview and use template →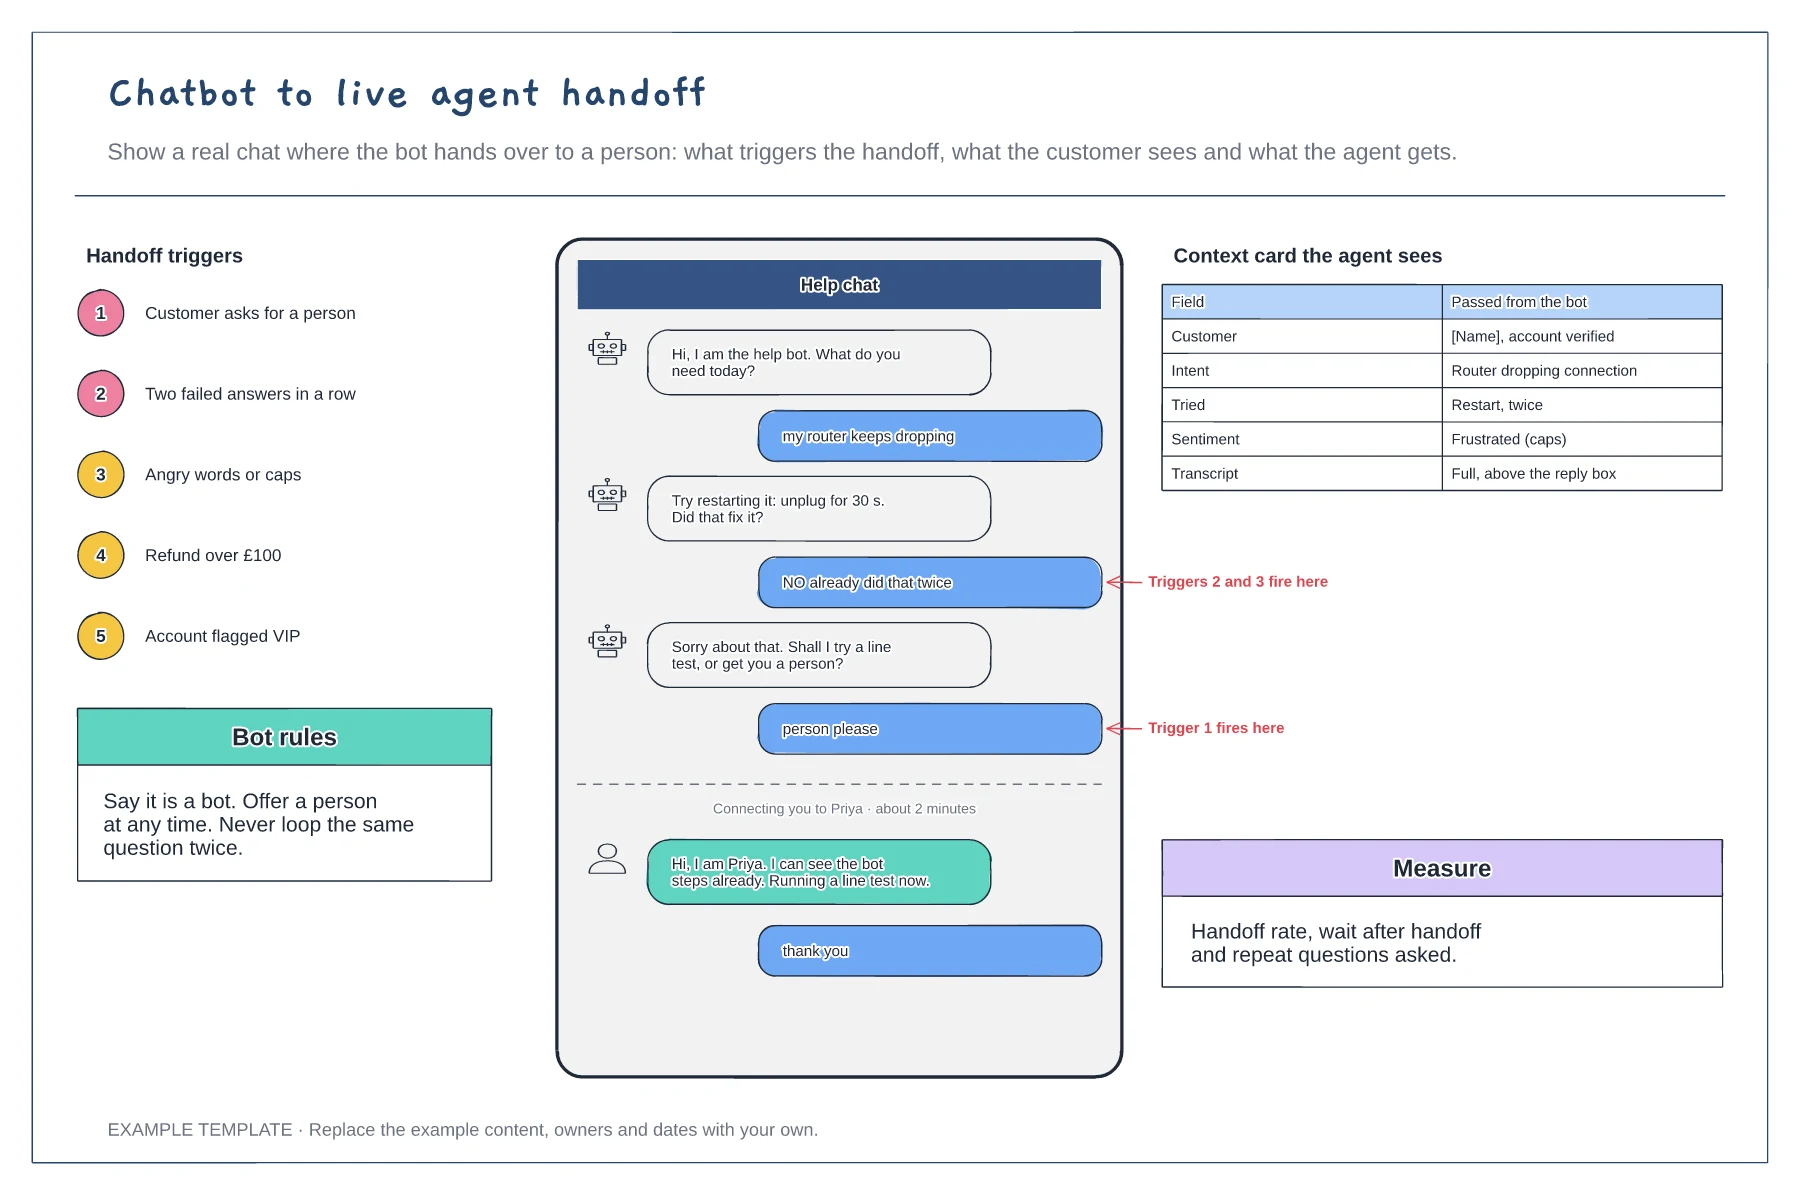
A chat transcript with the handoff moment marked · Five handoff triggers · The context card passed to the agent
Preview and use template →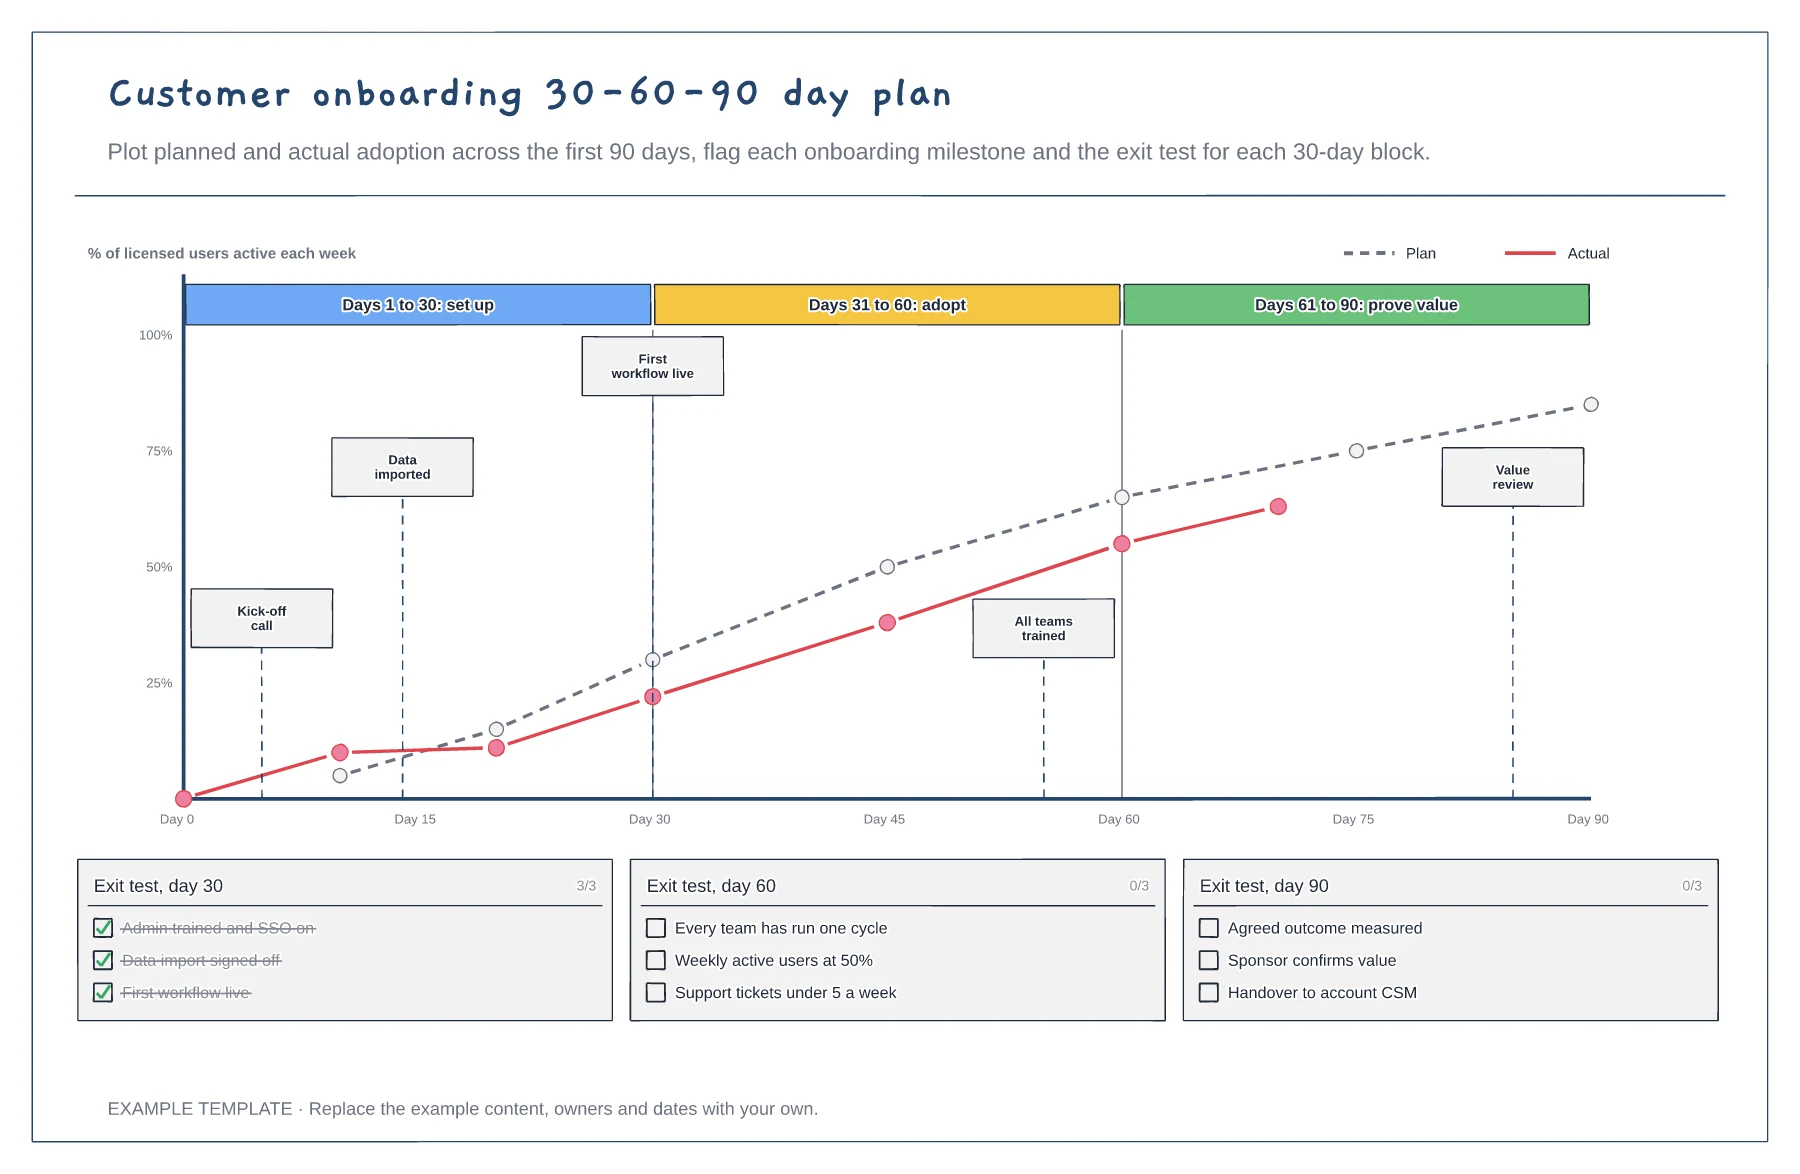
Planned versus actual adoption over 90 days · Milestone flags on the chart · Exit test checklists for days 30, 60 and 90
Preview and use template →