Logistics
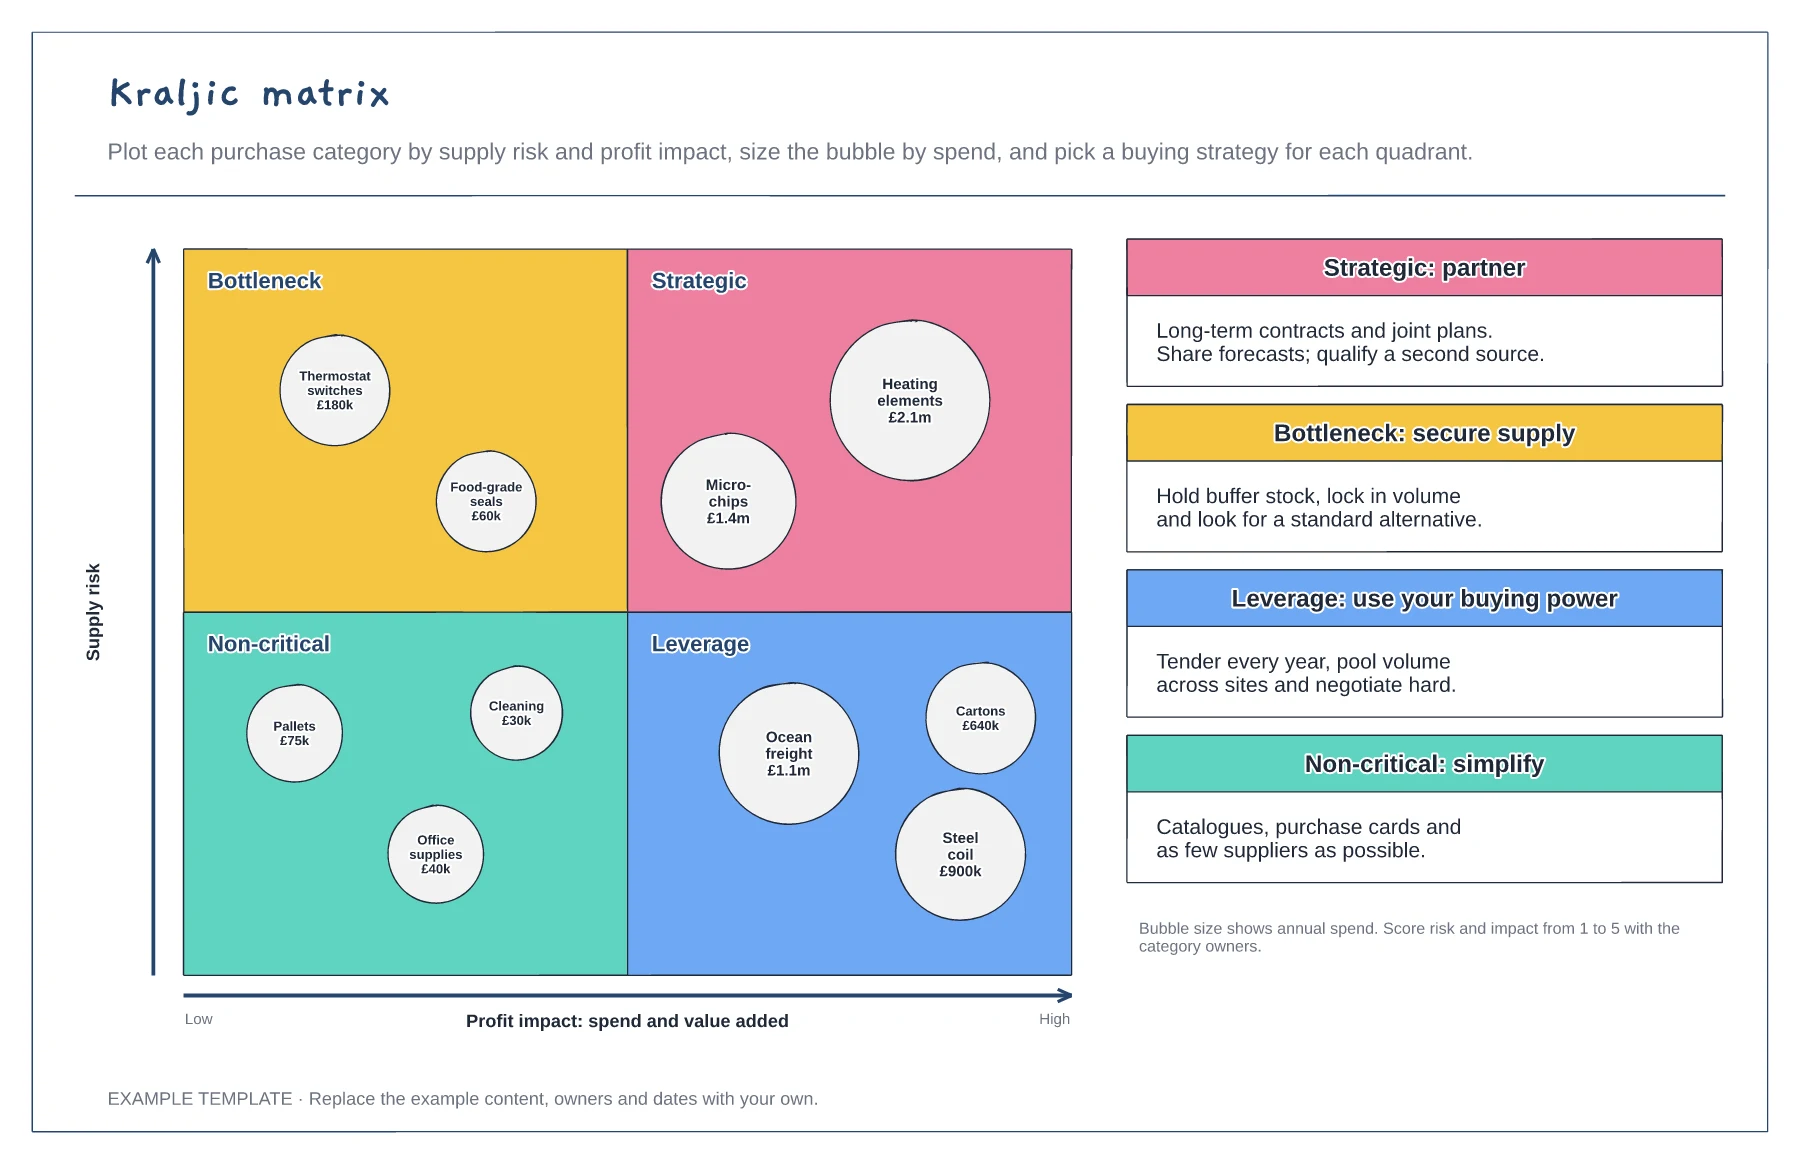
Kraljic matrix template
Four quadrants: strategic, bottleneck, leverage, non-critical · Categories as bubbles sized by annual spend · A buying strategy for each quadrant
Preview and use template →A supply chain map shows every step a product takes before it reaches a customer, and how long each step takes. This example follows a kettle from resin, steel and microchips through component makers and an assembly plant, across the sea to a UK distribution centre and out to stores, online shoppers and trade accounts. Lead times sit on each link, single-source suppliers are in red and a risk table says what is being done about each weak point.
No account needed · Opens as your own editable page
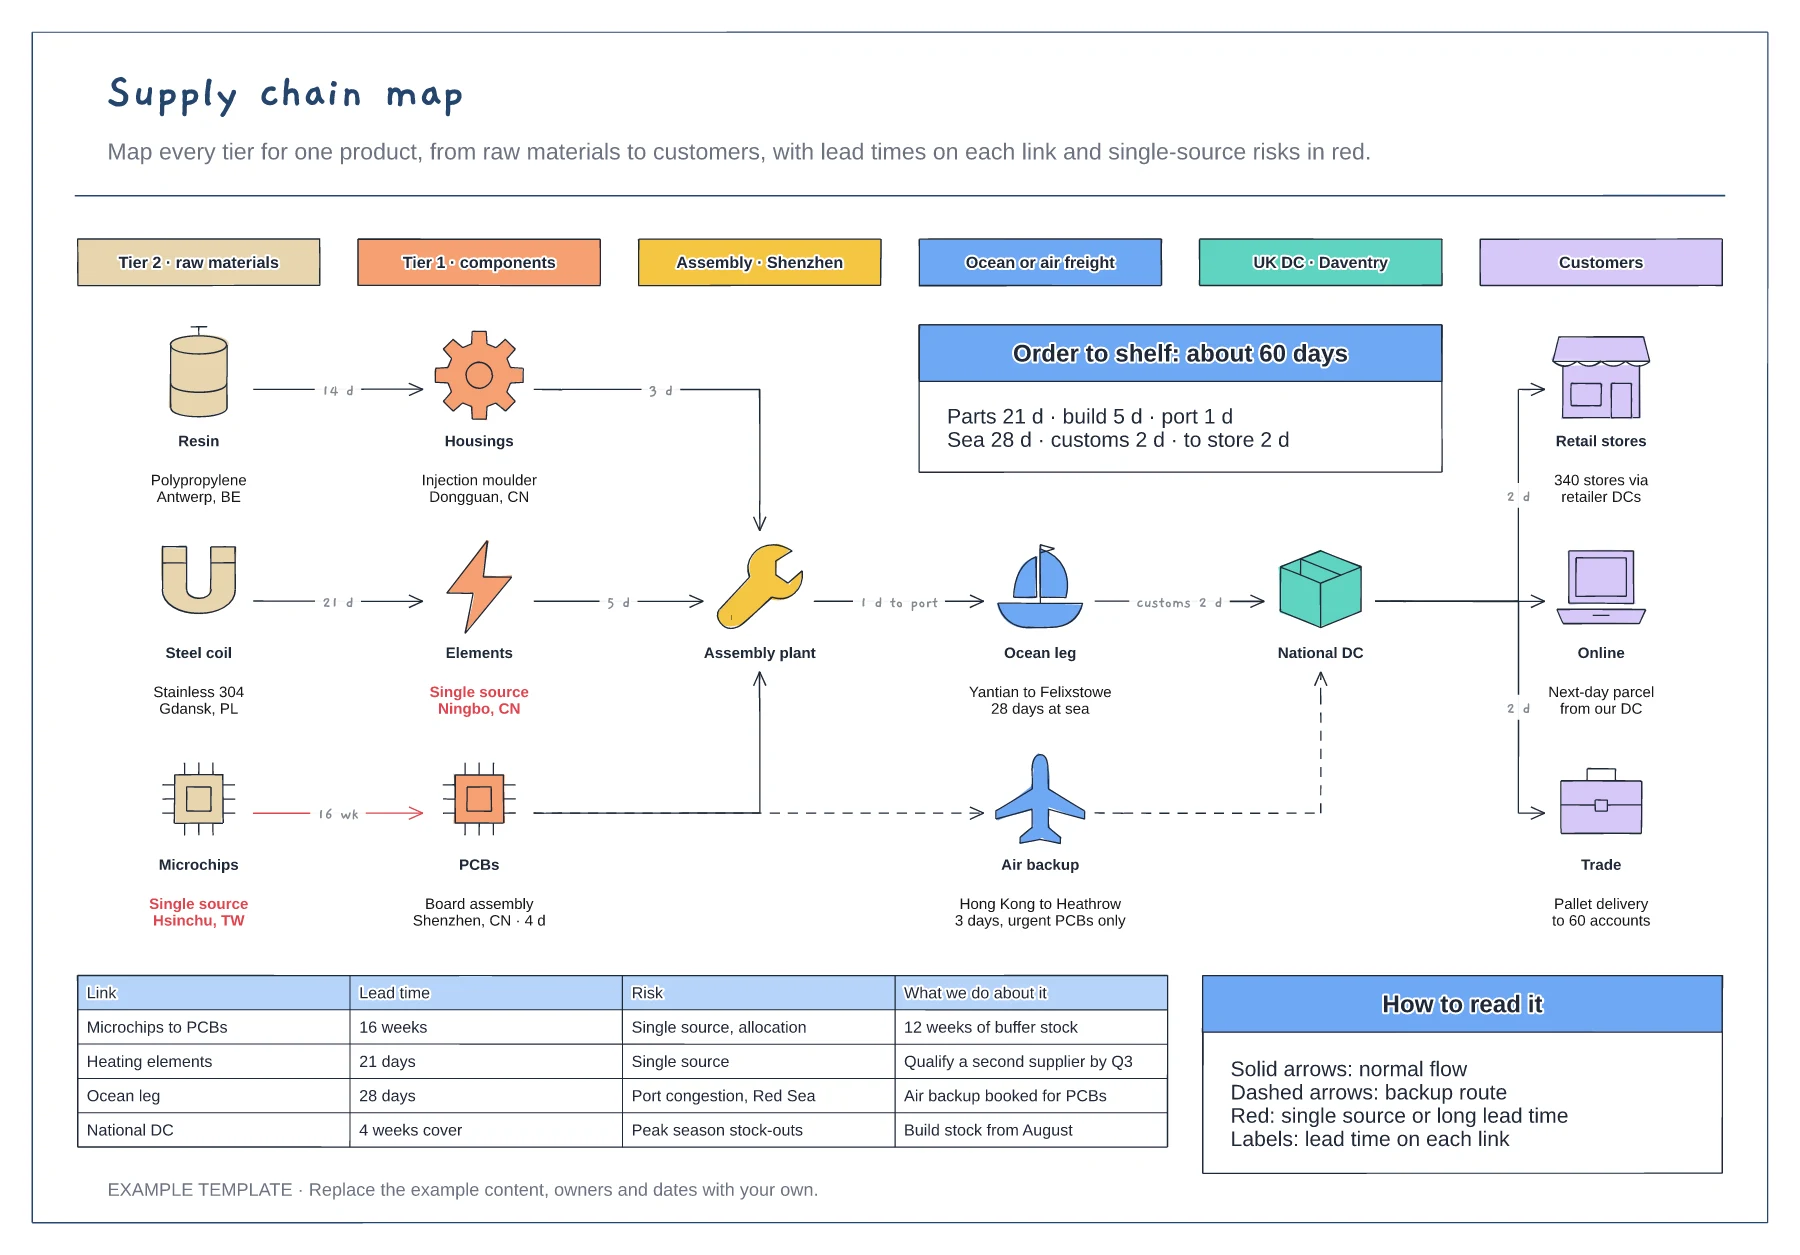
Map one product or product family at a time. A map of everything you buy turns into a wall of boxes nobody reads.
Start at the customer and ask each supplier who supplies them. Write the location and the lead time on each link as you go.
Colour single-source suppliers and the longest lead times, then add a line to the risk table for each with an owner and an action.
Red marks a single-source supplier, where one failure would stop supply. Use them to decide where to add a second source or buffer stock.
No. Open the template and edit it in your browser. Your work saves on this device. An account is optional if you want to sync your workspace.
Yes. Use Export in the editor to save a PNG, SVG or PDF, or download an editable .epicdraw backup.
Four quadrants: strategic, bottleneck, leverage, non-critical · Categories as bubbles sized by annual spend · A buying strategy for each quadrant
Preview and use template →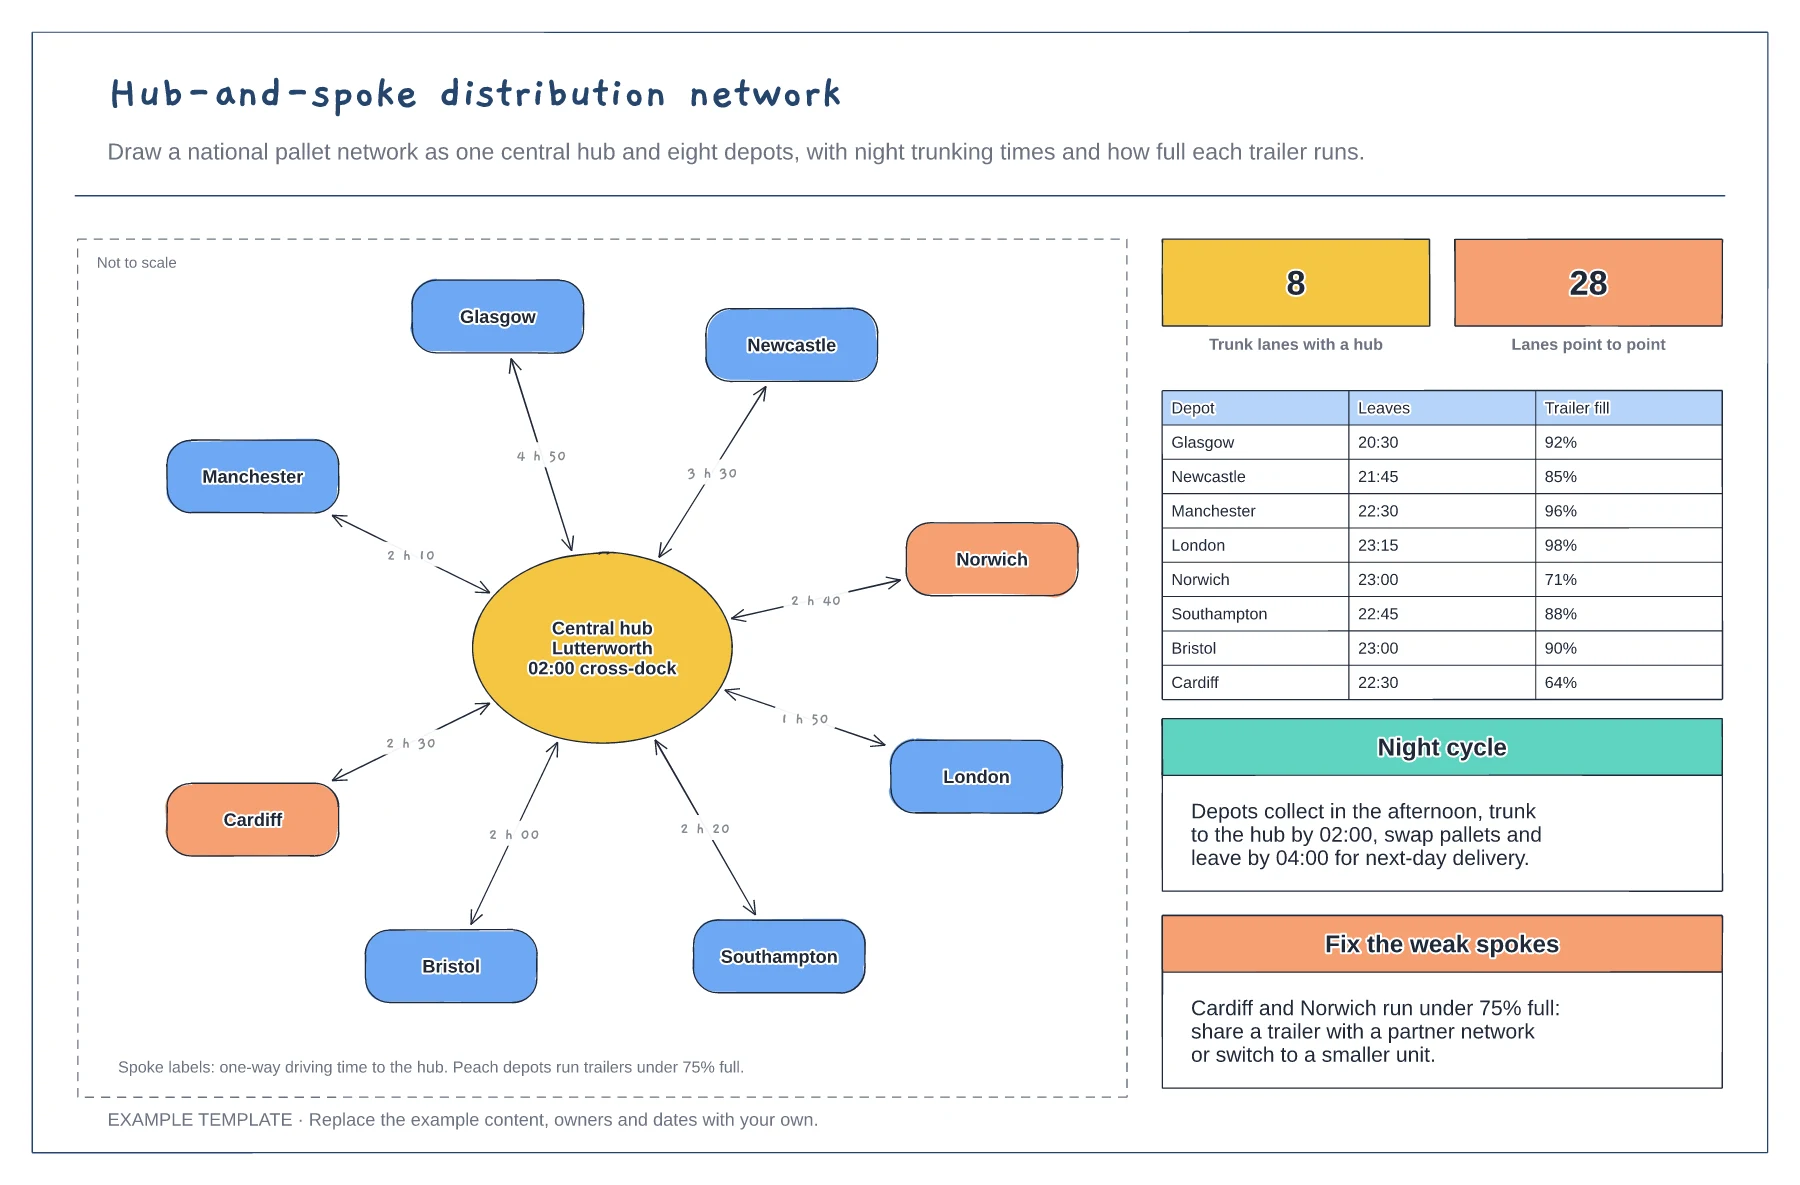
Central hub with eight spokes and driving times · Departure times and trailer fill for each depot · Night cycle and fixes for weak spokes
Preview and use template →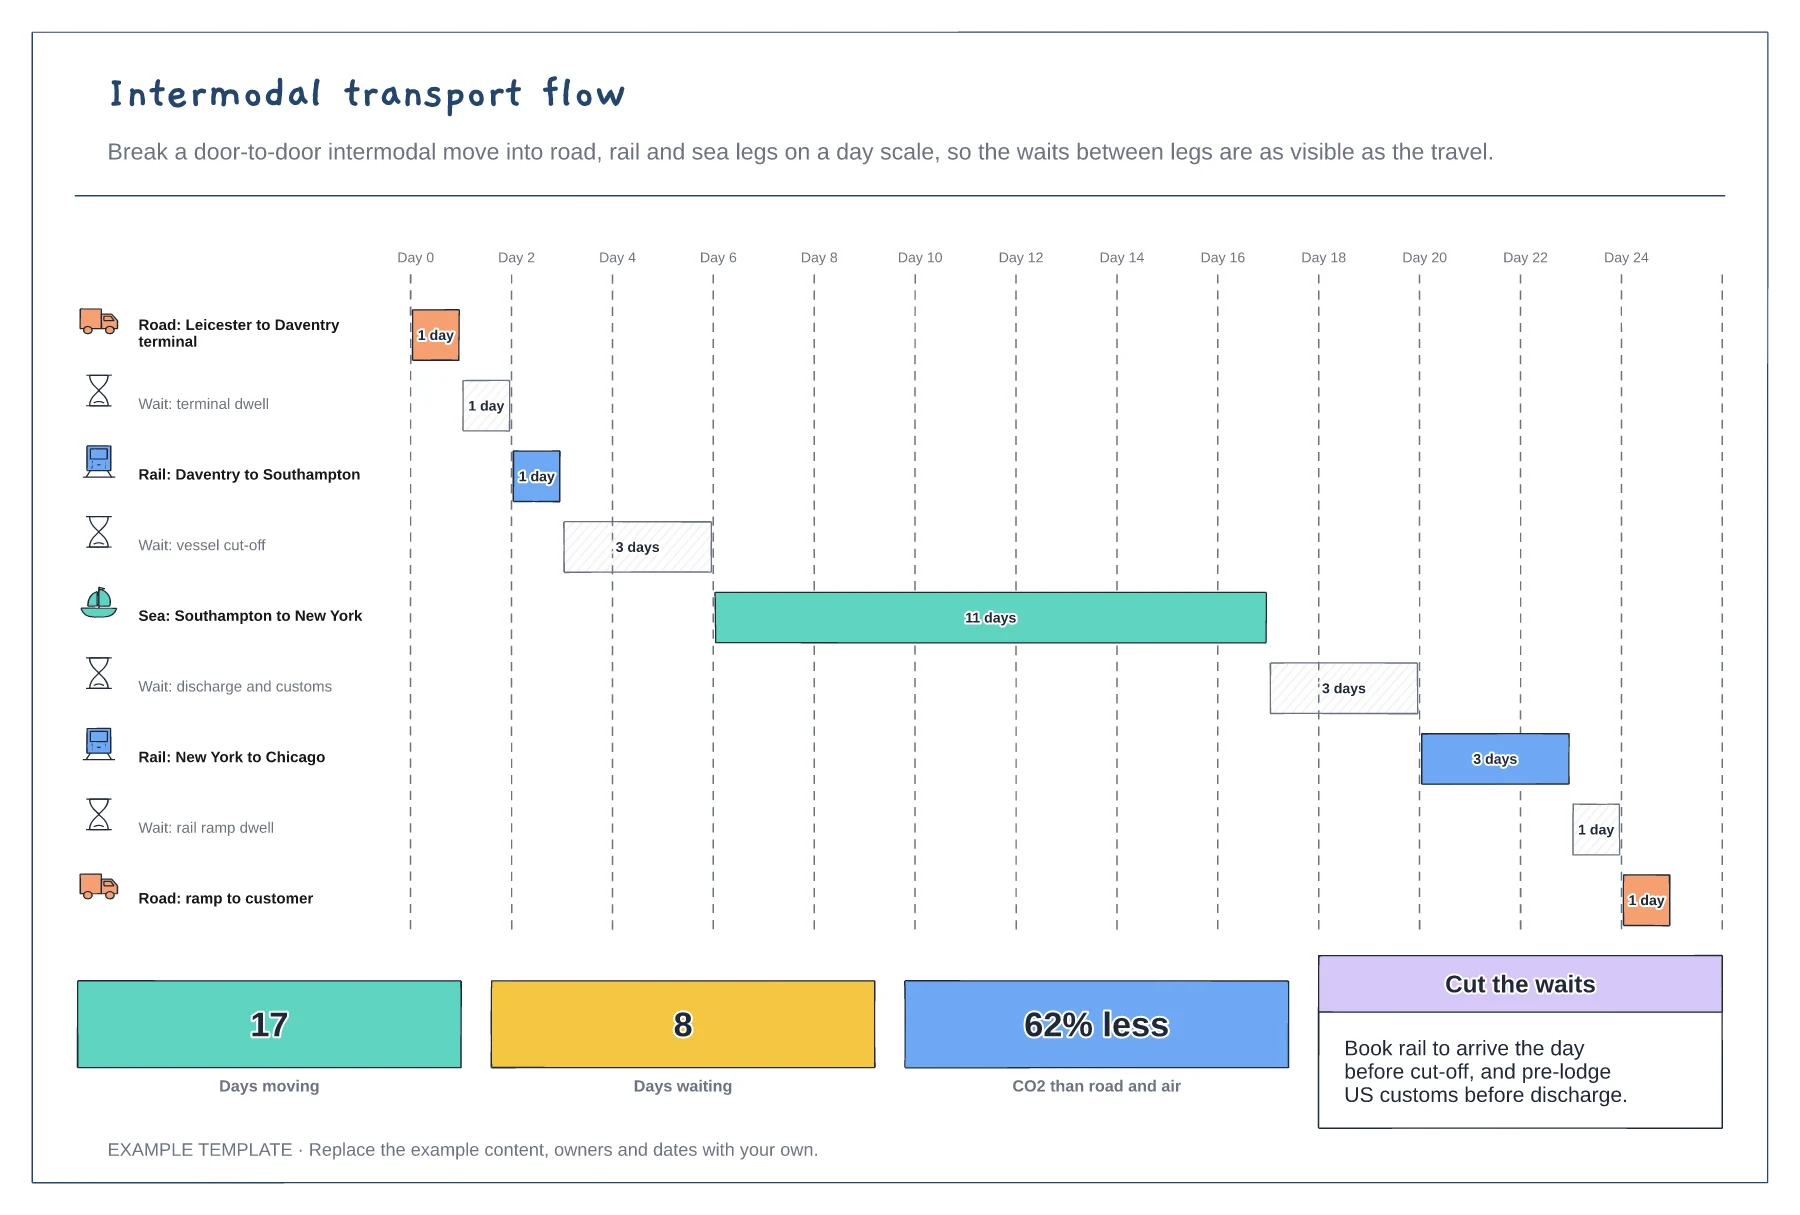
Every leg and wait as a bar on a day scale · Road, rail and sea legs with icons · Days moving, days waiting and carbon saved
Preview and use template →
Supplier, process and customer flow · Inventory queues and process data · Information flow and timing line
Preview and use template →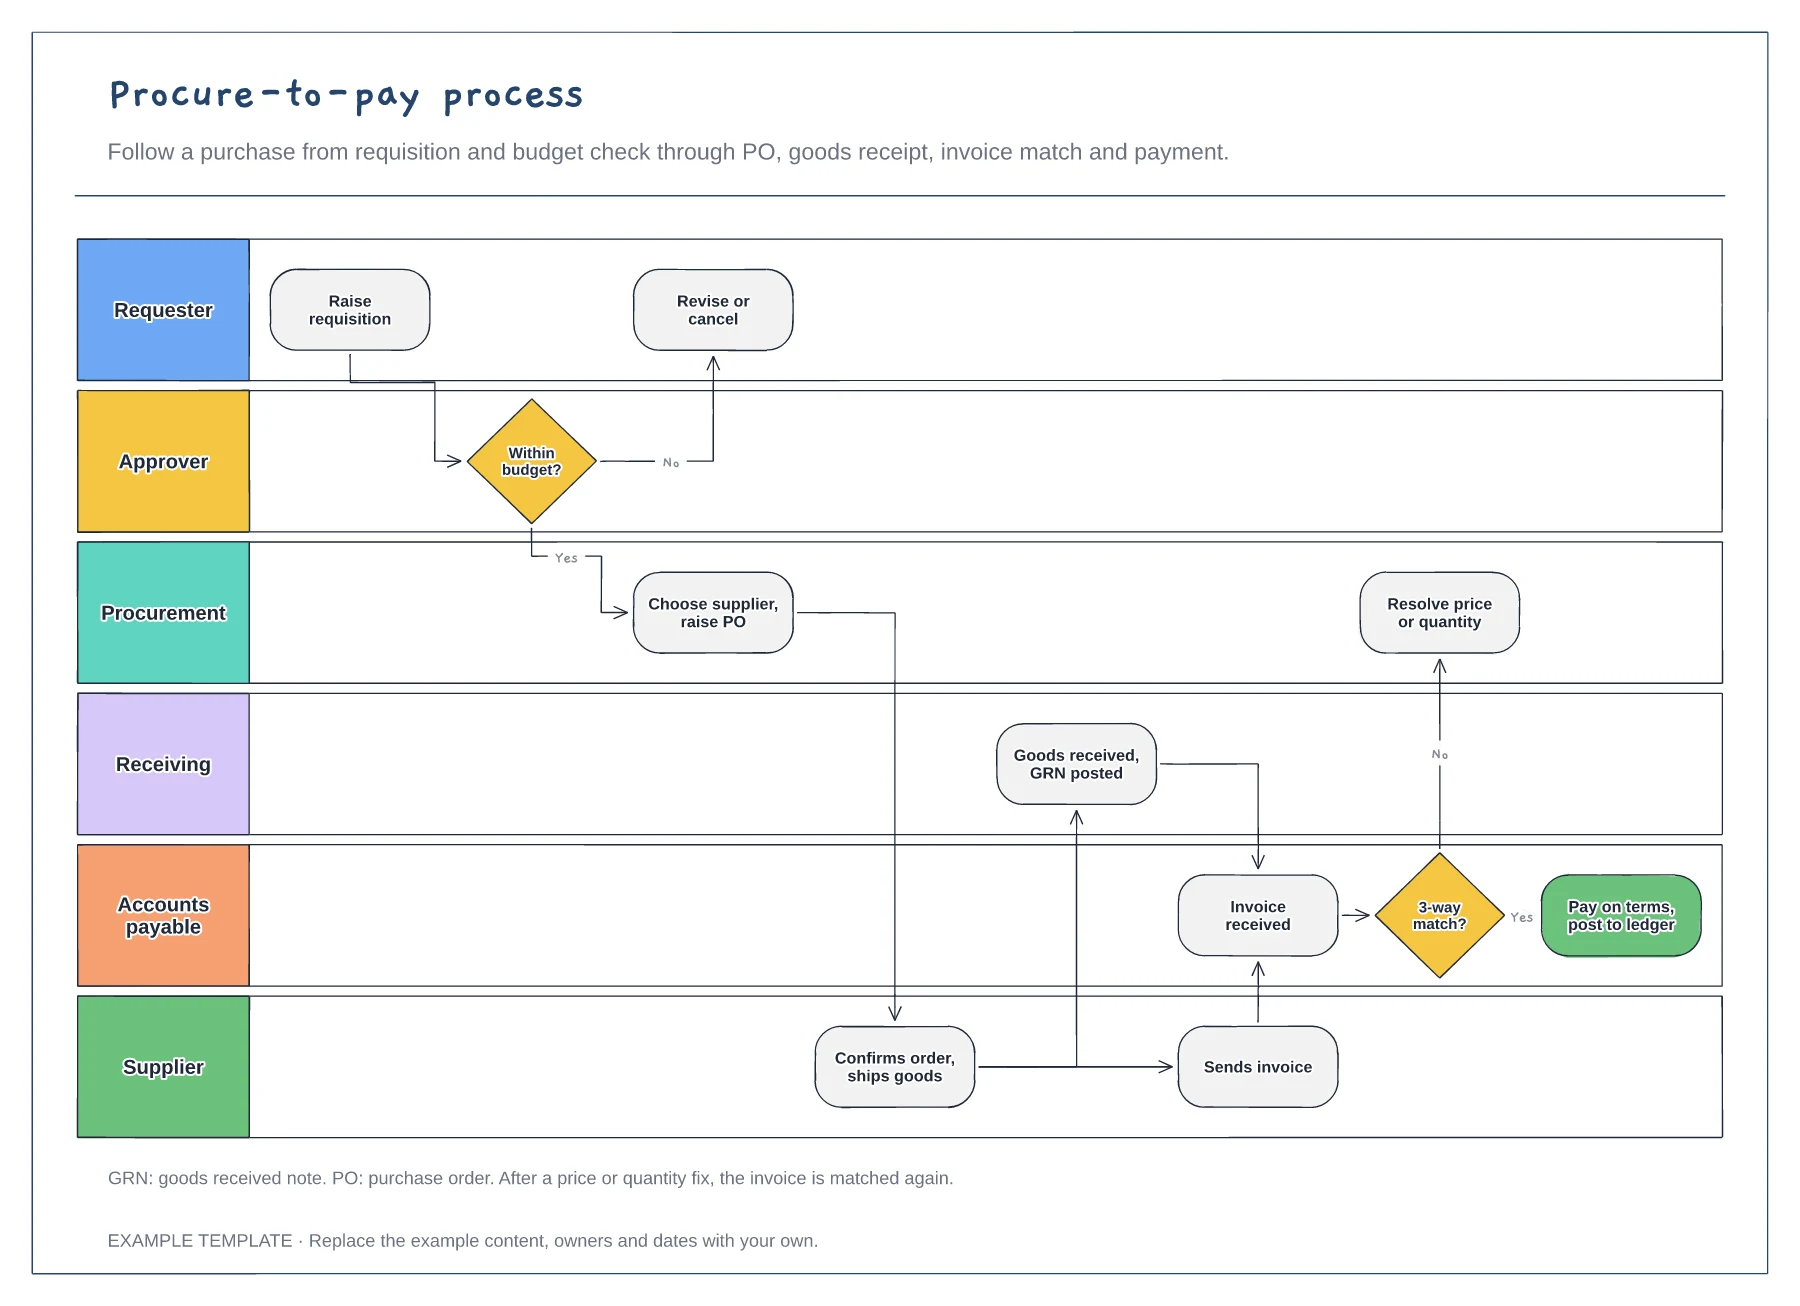
Six lanes from requester to supplier · Budget check and purchase order · Goods receipt, invoice match and payment
Preview and use template →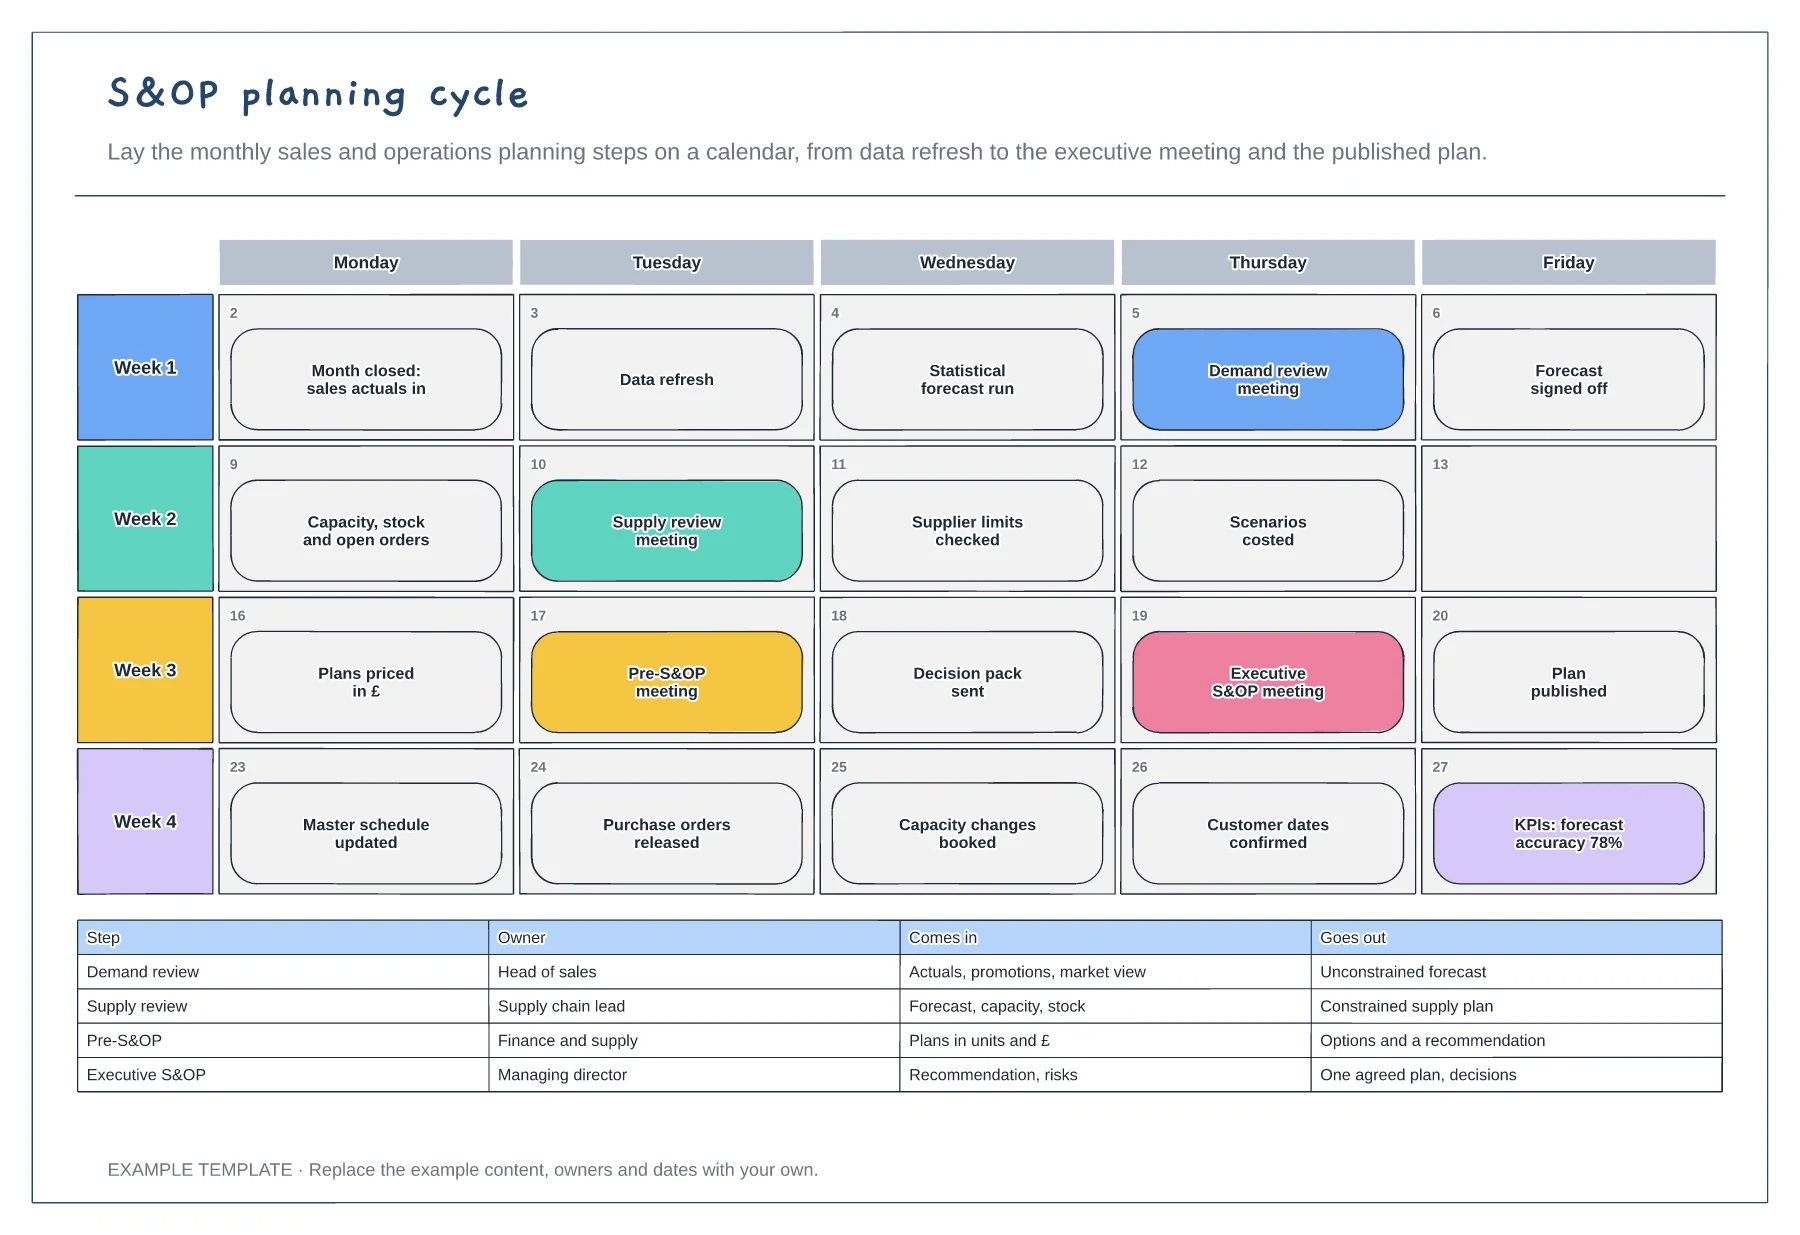
The monthly S&OP cycle on a four-week calendar · Key meetings highlighted with the work between them · Owner, inputs and outputs for each meeting
Preview and use template →