Engineering
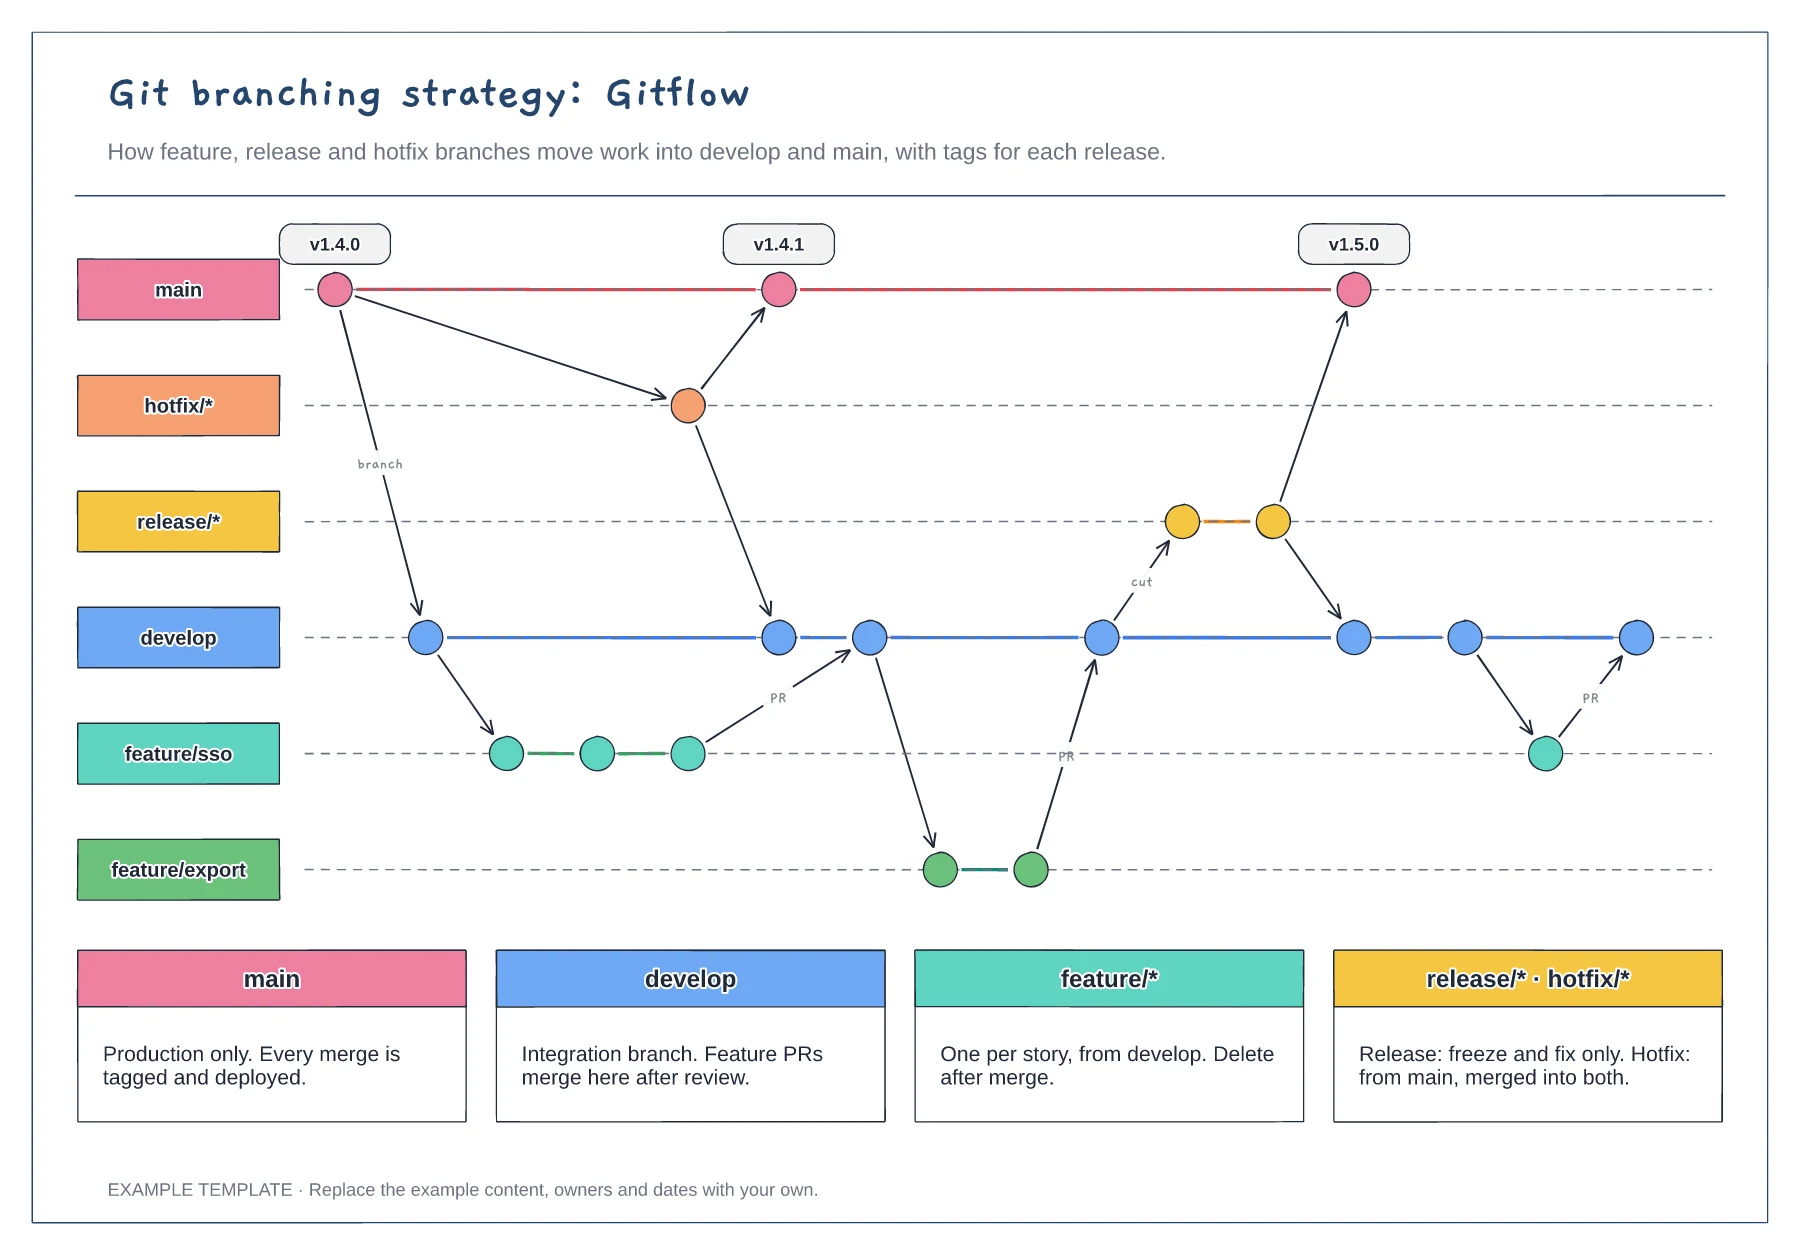
Git branching strategy diagram template
Lanes for main, develop, feature, release and hotfix · Commits, merges and version tags · One rule per branch type
Preview and use template →A CI/CD pipeline diagram shows what happens to a change between merge and production, and what stops a bad one. This example runs eight stages from commit to monitoring, then promotes a canary to full rollout or rolls back automatically, with the pipeline rules the team agreed underneath.
No account needed · Opens as your own editable page
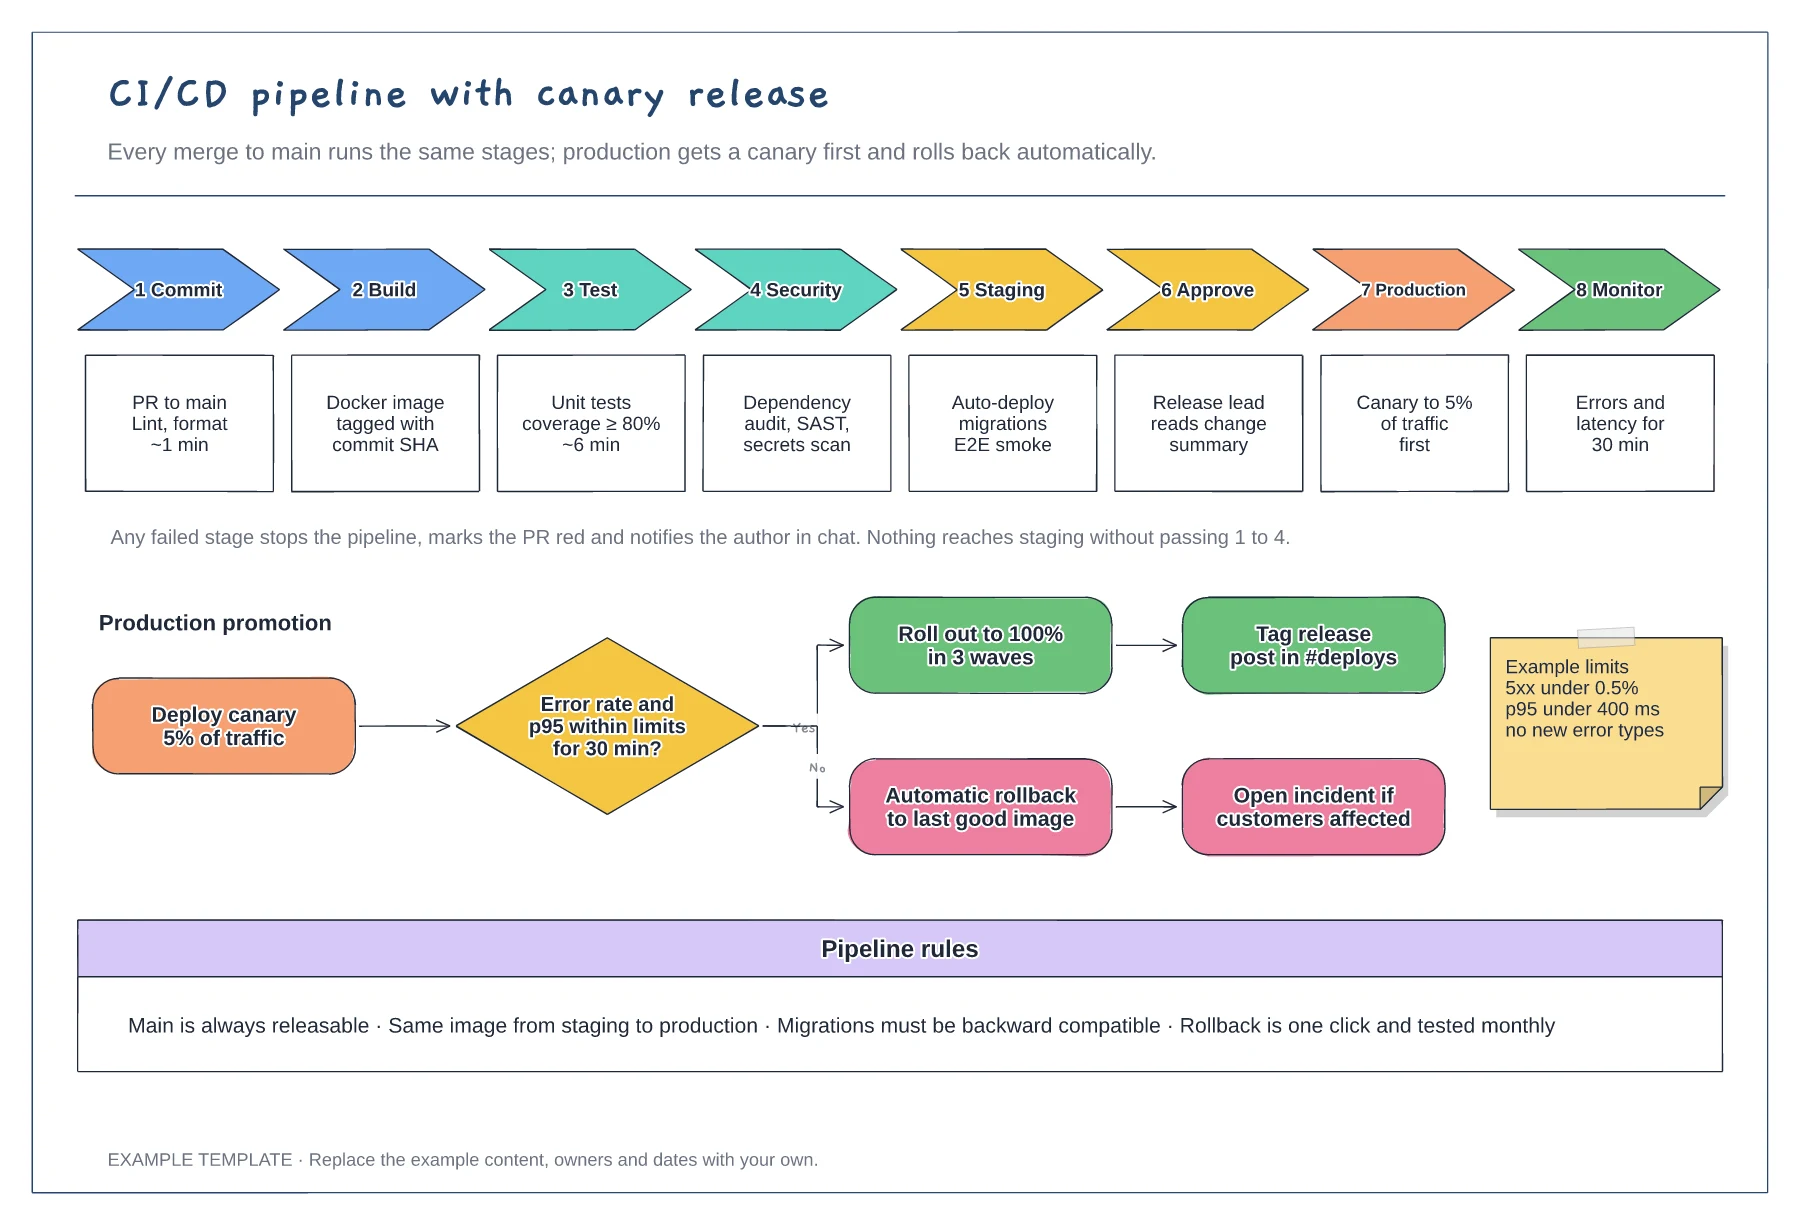
Rename the chevrons to match your CI configuration and add real durations. Seeing the time per stage shows where a slow pipeline loses minutes on every merge.
Replace the example error rate and latency limits with thresholds from your monitoring. Automatic rollback only helps if the limits are specific enough for a script to check.
Keep the rules short and testable, such as using the same image in staging and production. Review them whenever an incident shows that a rule was missing or ignored.
Yes. Delete the approval stage and connect the stage before it to the canary release if your team deploys automatically once every check passes.
No. Open the template and edit it in your browser. Your work saves on this device. An account is optional if you want to sync your workspace.
Yes. Use Export in the editor to save a PNG, SVG or PDF, or download an editable .epicdraw backup.
Lanes for main, develop, feature, release and hotfix · Commits, merges and version tags · One rule per branch type
Preview and use template →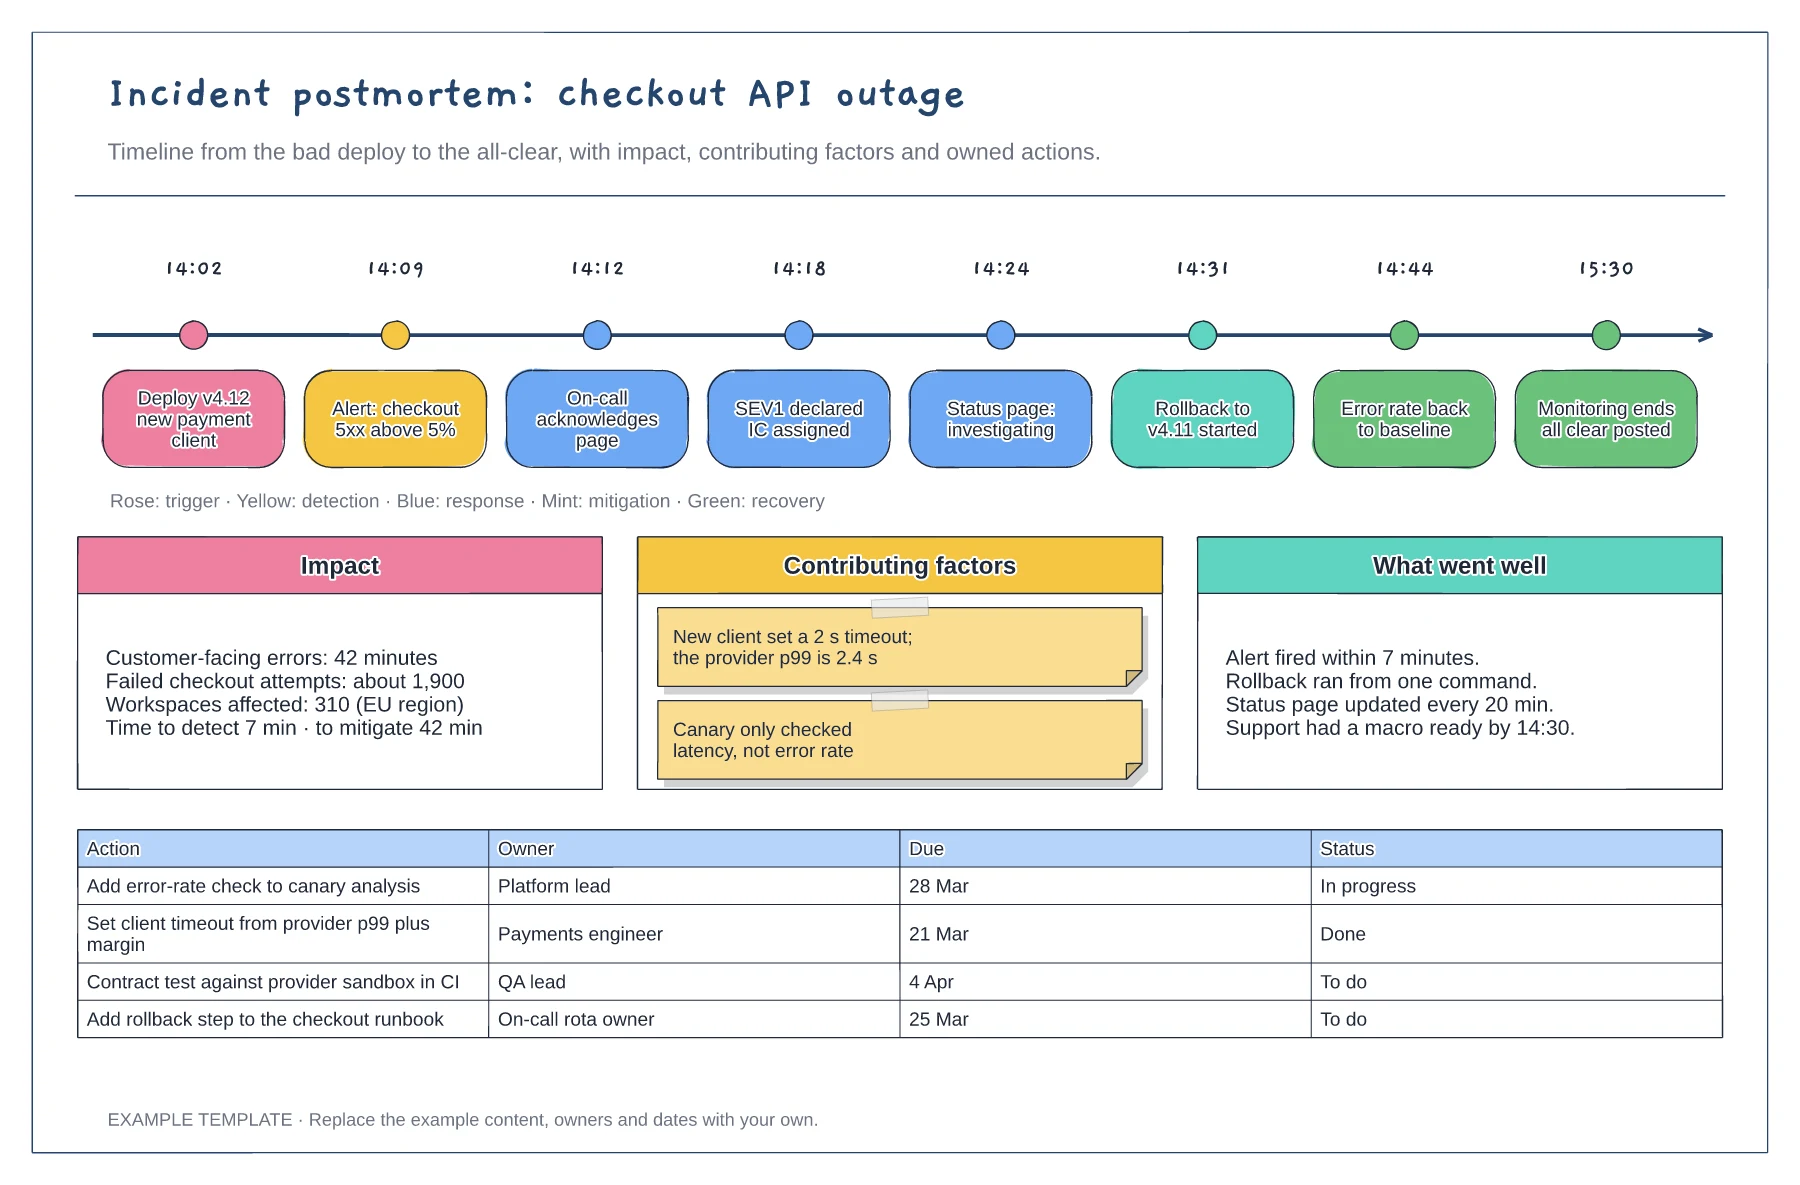
Timestamped events from deploy to all-clear · Impact, contributing factors and what went well · Action table with owners, due dates and status
Preview and use template →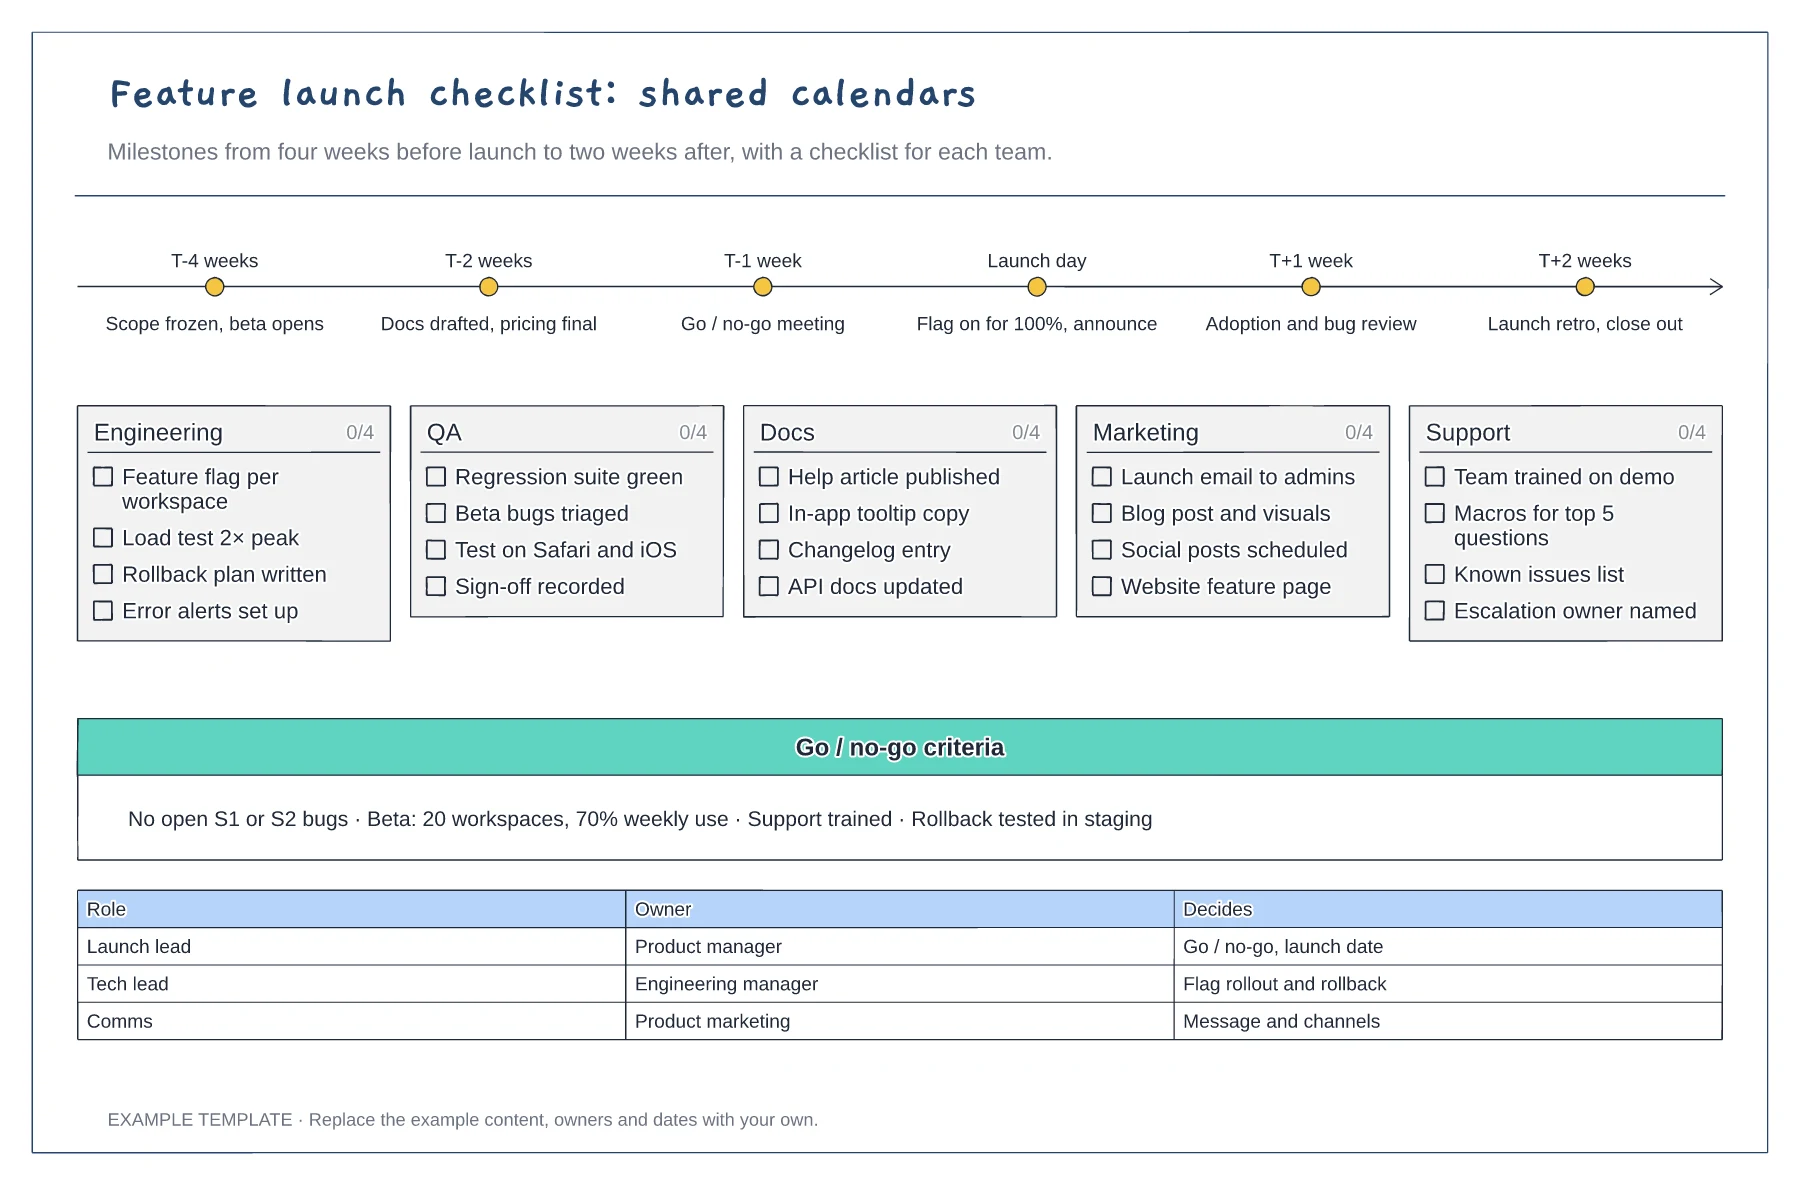
Milestones from T-4 weeks to T+2 weeks · Tickable checklists for five teams · Go or no-go criteria and decision owners
Preview and use template →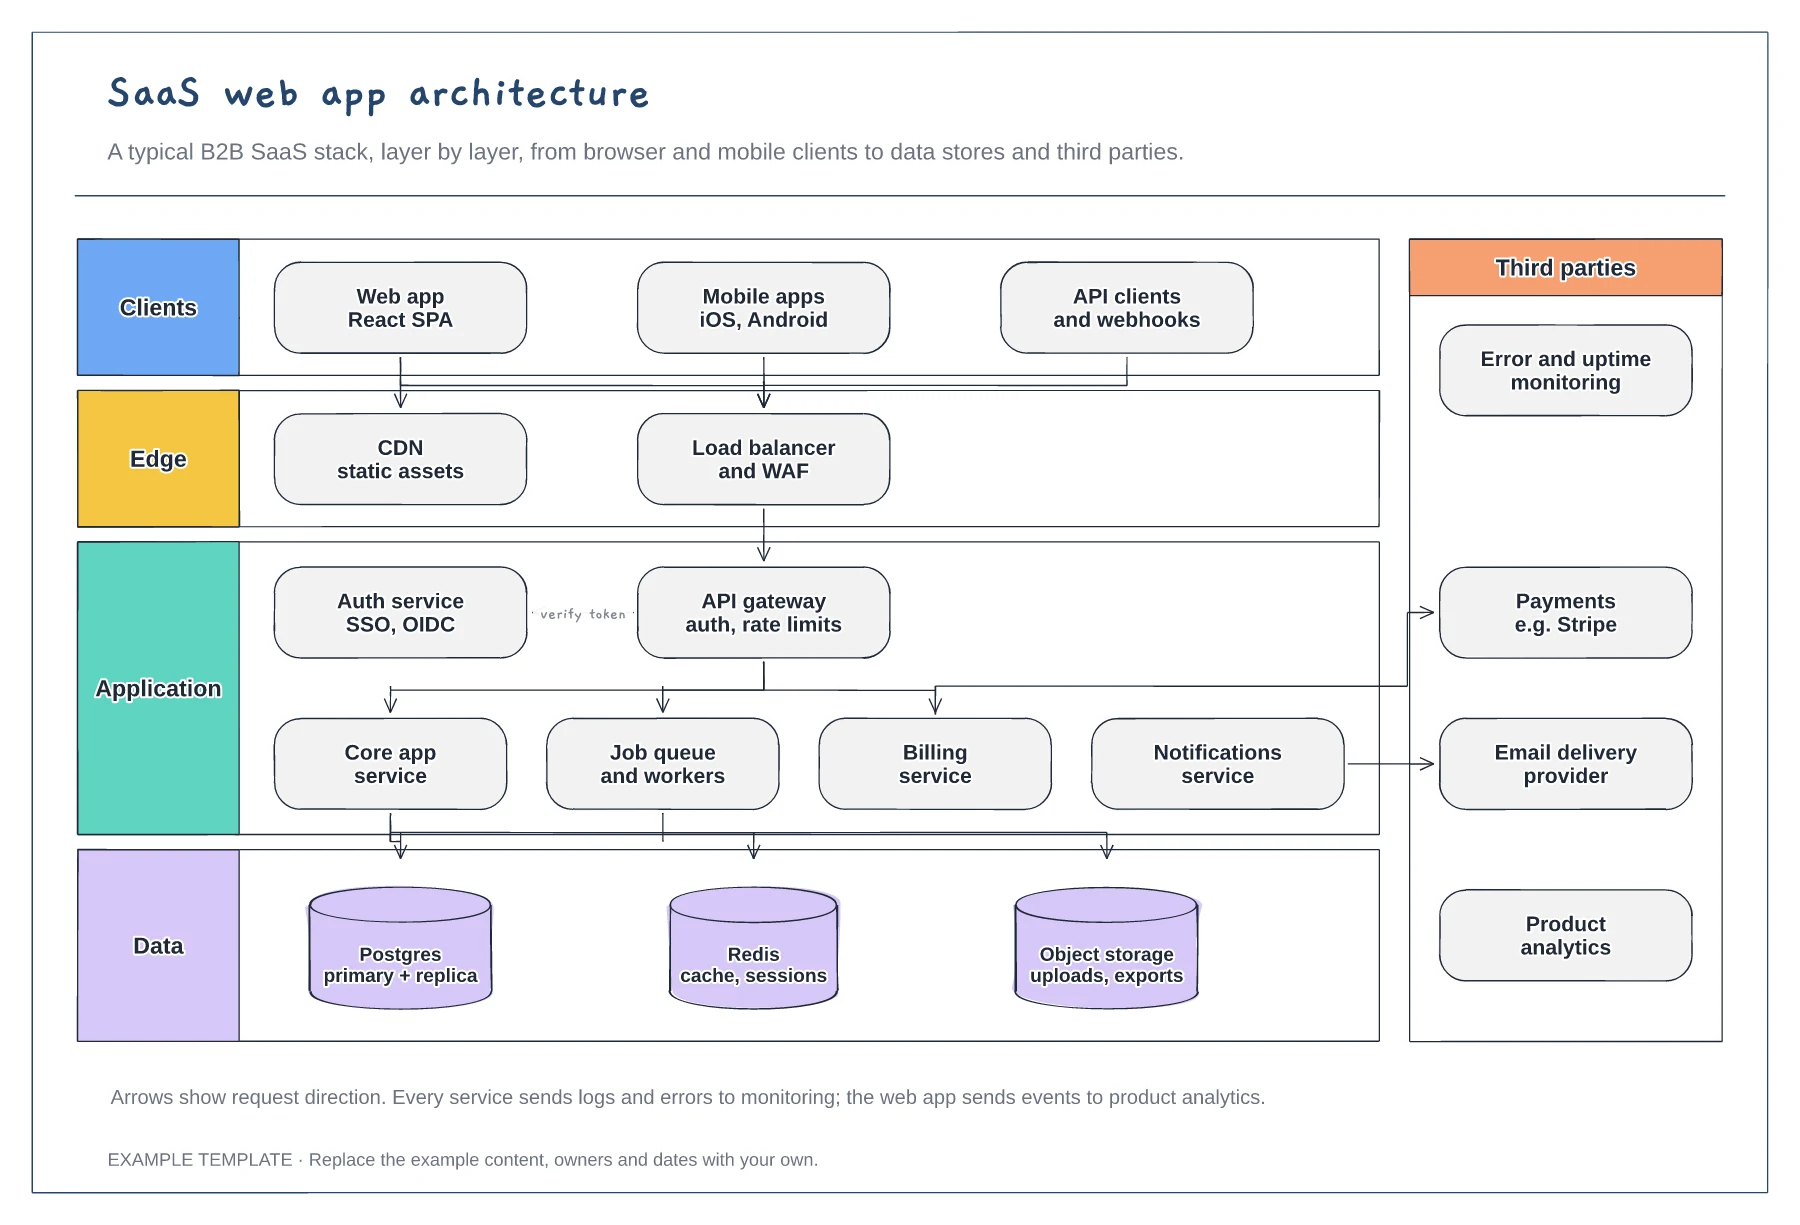
Client, edge, application and data layers · Services behind an API gateway and auth service · Third parties such as payments and email
Preview and use template →
Supplier, process and customer flow · Inventory queues and process data · Information flow and timing line
Preview and use template →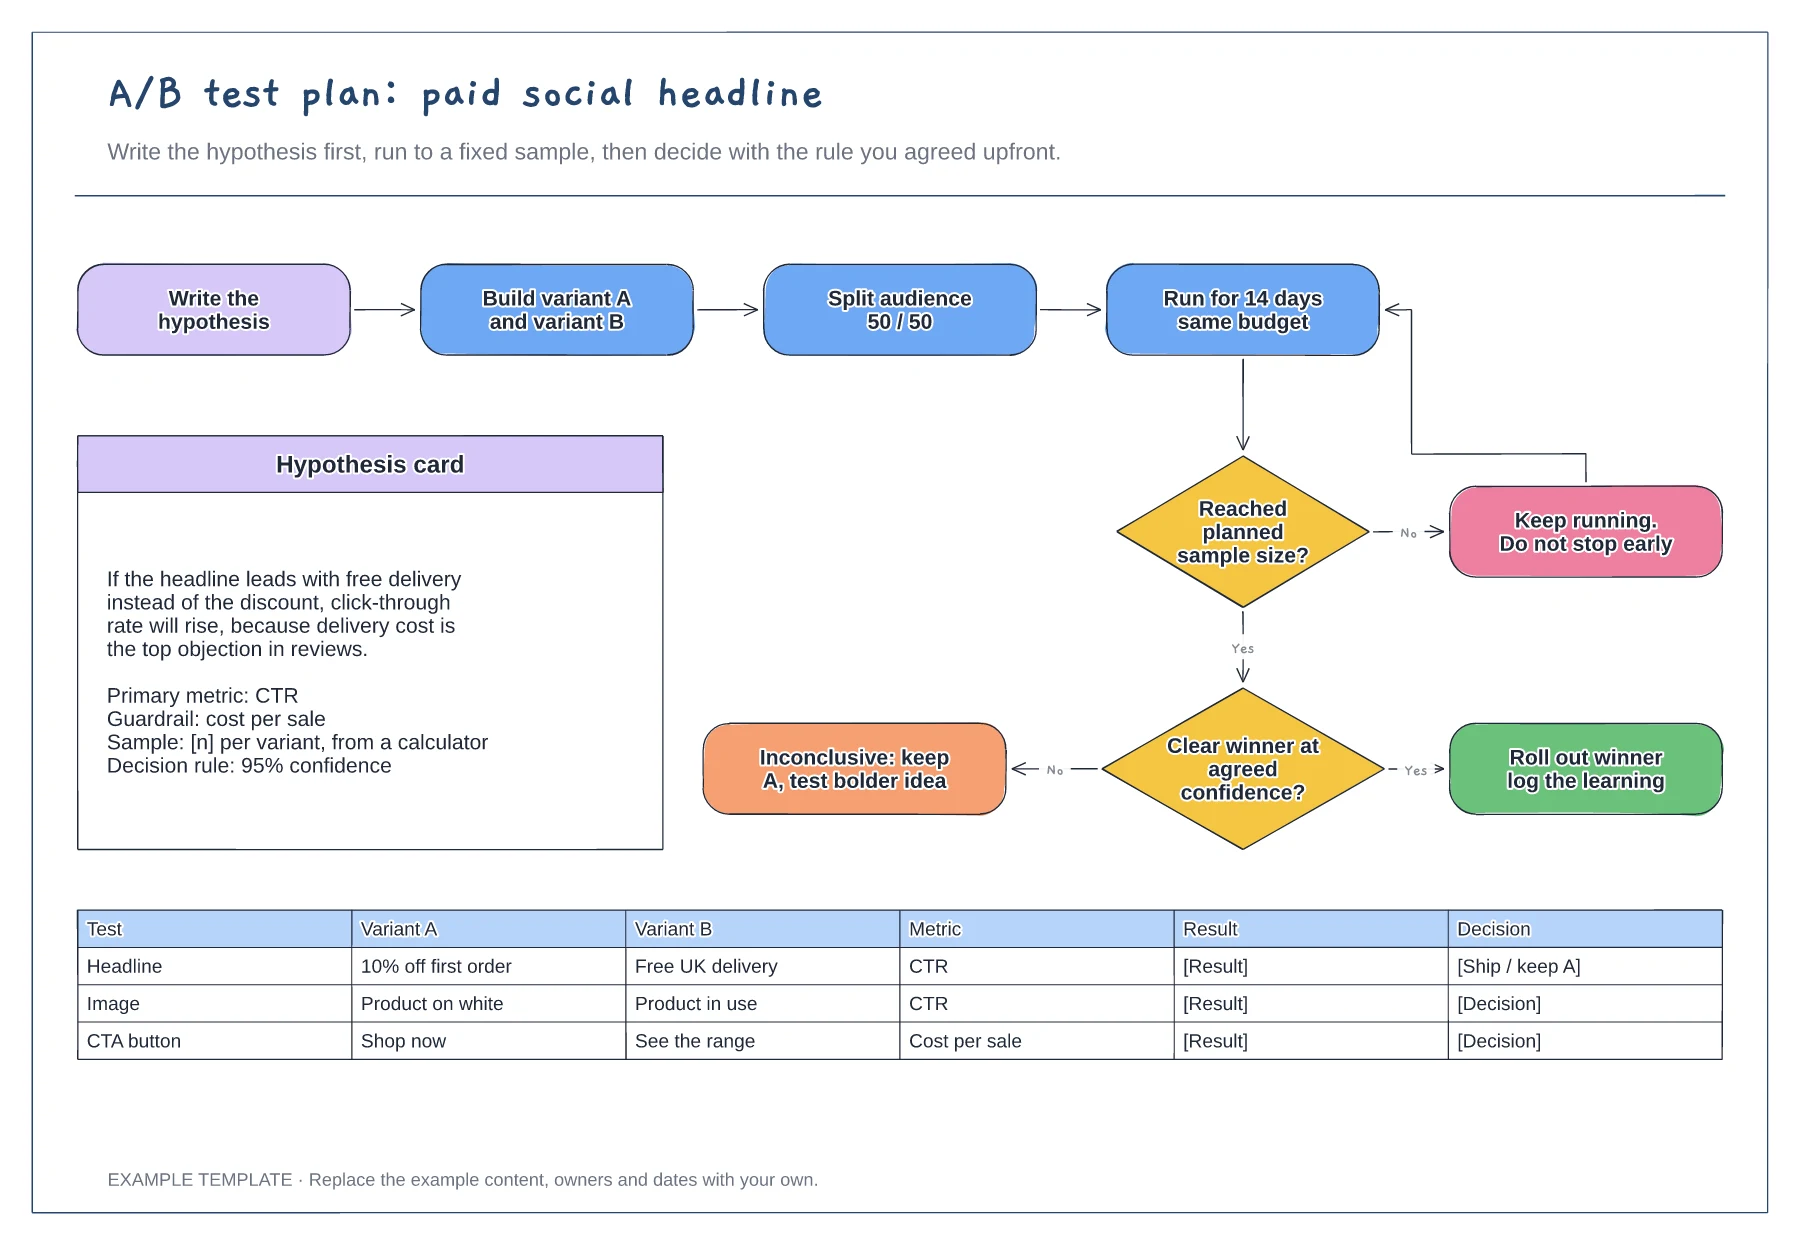
Hypothesis card with metric and guardrail · Decision flow with a no-peeking loop · Test log for variants and results
Preview and use template →